Machine Vision Using Multi-Spectral Imaging for Undercarriage - UIC
Machine Vision Using Multi-Spectral Imaging for Undercarriage - UIC
Machine Vision Using Multi-Spectral Imaging for Undercarriage - UIC

Create successful ePaper yourself
Turn your PDF publications into a flip-book with our unique Google optimized e-Paper software.
Abstract<br />
<strong>Machine</strong> <strong>Vision</strong> <strong>Using</strong> <strong>Multi</strong>-<strong>Spectral</strong> <strong>Imaging</strong> <strong>for</strong><br />
<strong>Undercarriage</strong> Inspection of Railroad Equipment<br />
J.M. Hart, E. Resendiz, B. Freid, S. Sawadisavi, C.P.L. Barkan, N. Ahuja<br />
University of Illinois at Urbana-Champaign, Urbana, USA<br />
Locomotive and rolling stock condition is an important element of railway safety, reliability, and<br />
service quality. Traditionally, railroads have monitored equipment condition by conducting<br />
regular inspections. Over the past several decades, certain inspection tasks have been<br />
automated using technologies that have reduced the cost and increased the effectiveness of the<br />
inspection. However, the inspection of most aspects of railroad equipment undercarriages is<br />
conducted manually. This is a labor-intensive process and often requires that railroad<br />
equipment be taken out of service so that the inspection can be conducted on specially<br />
equipped pit tracks. <strong>Machine</strong> vision technology offers the potential to quickly and automatically<br />
monitor, assess, record, and transmit detailed in<strong>for</strong>mation regarding the condition of railroad<br />
equipment undercarriages and components. <strong>Multi</strong>-spectral imaging (e.g. visible and infrared<br />
range) allows recording of both physical and thermal condition and correlation between the two.<br />
This allows precise comparison of any undercarriage component or element of interest using<br />
templates, and/or references to previously recorded inspections, of the same or similar<br />
equipment and enables other analyses such as trending of component wear and detection of<br />
progressive increases in component heating over time. <strong>Multi</strong>-spectrum machine vision<br />
algorithms can determine if a component is outside its normal operating range and if anomalies<br />
are correlated across different spectra. The inspection tasks of particular interest <strong>for</strong> this<br />
investigation include disc brake condition, bearing per<strong>for</strong>mance, and detection of incipient<br />
failure of electrical systems such as locomotive traction motors and air conditioning units. We<br />
are also investigating detection of damaged or missing components and <strong>for</strong>eign objects.<br />
Introduction<br />
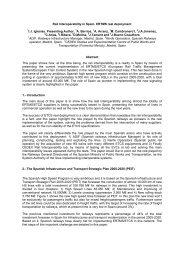
This paper describes research conducted to develop a new approach to undercarriage<br />
inspection using machine vision and multispectral imaging [1, 6]. This research was carried out<br />
by an interdisciplinary group of researchers working with experts in various other fields (studio<br />
lighting, infrared cameras and imaging, and passenger car inspection). Previous research by<br />
the University of Illinois at Urbana-Champaign on machine vision inspection systems provided a<br />
foundation <strong>for</strong> this project. These include recording digital video of trains passing by a fixed<br />
video camera [4, 7, 8] and the generation of panoramas of entire trains from these videos [8]. In<br />
this research we incorporated a below-track perspective and the integration of both visible and<br />
infrared spectrum images. Recording in-service trains at an operating passenger car service<br />
and inspection facility required consideration of various environmental factors and effects of<br />
adverse weather conditions. The specific inspection tasks we concentrated on were disc brake<br />
per<strong>for</strong>mance, bearing wear, locomotive traction motors, air-conditioning (A.C.) units and other<br />
electrical-based systems. These components are a source of thermal energy and certain<br />
incipient failures may be discovered through detection of irregularities or anomalies in their<br />
thermal signature. In combination with the visible spectrum images, their type and location can<br />
also be ascertained. In addition, the visible spectrum images can be used to detect damaged or<br />
missing components and <strong>for</strong>eign objects. These components and tasks <strong>for</strong>med the basis <strong>for</strong> our<br />
investigation of the feasibility of monitoring the health of rolling stock and locomotives using<br />
multi-spectral machine vision.<br />
1
Approach<br />
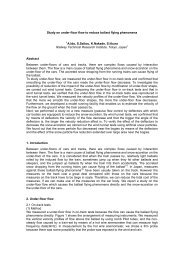
Our approach can be described in three basic modules consisting of: video acquisition,<br />
panoramic image generation, and machine vision inspection to identify <strong>for</strong>eign, missing, and<br />
damaged components (Figure 1). In the first module, visible and infrared (thermal) cameras<br />
were placed below the track and video recordings made of the train’s undercarriage as it<br />
passed above. In Module 2, these videos were used to create continuous undercarriage<br />
panoramic images in both visible and thermal spectra <strong>for</strong> all the railcars and locomotives in the<br />
train. These train panoramas were split into single car panoramas using machine vision<br />
algorithms to first detect the location of the axles and then the couplers. In Module 3, these<br />
individual car panoramas were compared with unique templates representing specific car types<br />
in normal condition, and car-level anomalies such as missing or <strong>for</strong>eign components were<br />
detected. Integration of the thermal panoramas with the visible panoramas was used to isolate<br />
and identify components with thermal anomalies. In conjunction with car-level templates, more<br />
detailed templates of specific components of interest were also produced. These componentlevel<br />
templates can identify lower level defects associated with these specific components.<br />
Additionally, like components on the same car or in the same train are compared to find thermal<br />
outliers; such as brake discs whose simultaneous application should produce similar<br />
temperature increases. The methods <strong>for</strong> thermal and visible anomaly detection can be used to<br />
detect overheating components and possible incipient failure indicators so that they can be<br />
repaired be<strong>for</strong>e they manifest as physical damage or an in-service failure.<br />
Figure 1: Overview of the multispectral inspection system.<br />
Module 1: Image Acquisition and Pre-processing<br />
Image Acquisition Prototype Development<br />
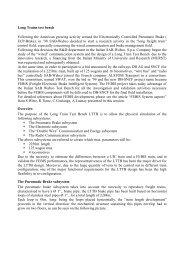
Recordings were made with the camera mounted in an inspection pit, below rail level and<br />
looking upward at the bottom of the train (Figure 2). The factor limiting the camera's view of the<br />
entire undercarriage is the gauge face of the rail. We determined the focal properties required to<br />
provide the necessary field of view in terms of image width and height and from this, the<br />
maximum depth of the camera lens below the railhead <strong>for</strong> a given piece of rolling stock. For a<br />
2
ailcar with a maximum width of 10.5 feet and an undercarriage 50 inches above the railhead,<br />
the maximum depth (l) was calculated using Equation (1)<br />
Figure 2: Camera perspective from beneath railcar and inverted triangle view.<br />
50 + l l<br />
= ⇒ l =<br />
126 56.<br />
5<br />
3<br />
2825<br />
69.<br />
5<br />
=<br />
40.<br />
65"<br />
=<br />
3.<br />
39<br />
The video camera has two characteristics that determine the field of view: the camera's charge<br />
coupled device (CCD) size and the focal length of the lens. The camera we used has a ½ inch<br />
CCD. Equation (2) is a general equation that relates focal length (f) with distance from the<br />
scene to the lens (D) and horizontal width (w). To calculate the appropriate focal length, we<br />
assumed a pit depth of 4 feet, and an enclosure slightly over 12 inches long and mounted on a<br />
tripod, giving a depth of 34 inches. Given that the horizontal width was 4 feet 8.5 inches at<br />
railhead height, and the constant (k) is 6.4 <strong>for</strong> a ½ inch CCD, we calculated an optimal focal<br />
length of 3.9mm (Equation 2). A 3.9mm lens was not available but a 3.6mm lens was found to<br />
be satisfactory and was used instead.<br />
D 34.<br />
00<br />
f = k = 6 . 4 = 3.<br />
9mm<br />
(2)<br />
w 56.<br />
5<br />
Similar considerations are needed <strong>for</strong> infrared imaging. Un<strong>for</strong>tunately, we were unable to obtain<br />
infrared camera lenses shorter than a 25mm lens, which is much longer than the 3.6mm lens<br />
used by the visible spectrum camera to capture the entire undercarriage. The 25mm lens did<br />
not allow the camera to capture the entire width of the undercarriage, so it was positioned to<br />
record a selected portion instead.<br />
<strong>Undercarriage</strong> Lighting <strong>for</strong> Visible Spectrum Recordings<br />
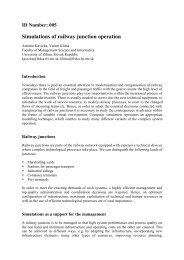
Based on initial experimentation and input from motion-picture lighting experts, we determined<br />
that four, studio-style 1,000-watt incandescent lights could provide adequate lighting (Figure 3a).<br />
In addition, we used scrims (light inhibiting screens) to achieve uni<strong>for</strong>m illumination across the<br />
undercarriage. The gray half of each light in the diagram represents the scrim placement<br />
(Figure 3b). The relative uni<strong>for</strong>mity of light intensity on the undercarriage was assessed using a<br />
light meter on a flat target held 50 inches above the railhead. The infrared camera was tilted 13degrees<br />
toward the edge of the pit in order to minimize infrared backplane reflection and align<br />
the infrared viewable area with the components of interest.<br />
We used a digital video camera that records 640x480-pixel resolution images (Figure 4a) at 30<br />
frames per second. A laptop computer was used to control the visible spectrum camera via a<br />
FireWire connection long enough to allow the computer to be located outside the pit. The focus<br />
of the visible-range camera was adjusted using targets at a distance roughly equivalent to the<br />
location of the undercarriage. The same method was effective <strong>for</strong> focusing the infrared camera<br />
(Figure 4b).<br />
(1)
(a) (b)<br />
Figure 3: (a) Camera and lighting setup in Amtrak pit and (b) plan view of equipment setup.<br />
(a) (b)<br />
Figure 4: (a) Field-of-view of the visible image, and (b) thermal image; white pixels indicate a<br />
high brake drum temperature.<br />
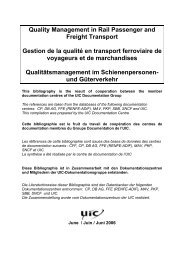
Both the A.C. unit and traction motor were located in the thermal and visible domains. The red<br />
area in Figure 5 indicates that the motor <strong>for</strong> the A.C. unit is hotter than its surroundings. The<br />
portion of the motor that is occluded by the rectangular covering in the visible domain becomes<br />
apparent in the thermal domain. The train speed was the normal pit speed of approximately<br />
3mph; however, the system could be modified <strong>for</strong> faster train speeds by increasing the video<br />
frame rate and using a shutter speed fast enough to prevent motion blur. More powerful lighting<br />
and/or a more sensitive CCD would also be required to accommodate these changes. The<br />
infrared camera was sensitive to ambient temperature, and needed to be recalibrated with<br />
significant ambient temperature changes. A production system <strong>for</strong> this technology would require<br />
development of an automated method of infrared camera adjustment to achieve consistent<br />
clarity <strong>for</strong> different trains operating in different conditions.<br />
Figure 5: Visible and infrared images of air conditioning blower unit.<br />
Module 2: Panoramic Image Processing<br />
Panoramas were generated by stitching together center strips of consecutive frames where the<br />
height of each center strip was determined by the inter-frame displacement. This was<br />
determined by fixing one frame and shifting the following frame opposite the direction of train<br />
motion until a pixel displacement, d, is found that minimizes the sum of absolute difference<br />
(SAD) between the two frames. A center strip of height d from the first frame is stitched into the<br />
panorama. This allows the train to move at variable speeds and accounts <strong>for</strong> depth-induced<br />
velocity differences in the undercarriage. The thermal panorama is <strong>for</strong>med in the same way.<br />
The train’s panorama is then parsed into individual car panoramas. Wheelset (wheel, axle, and<br />
brake disc) detection is used to approximate each car’s length and location, followed by coupler<br />
4
detection to detect car ends. Without axle detection, coupler detection is less robust since<br />
couplers have varied shapes and can be partially occluded. Axle detection is achieved by<br />
matching the edges of the panorama with the edges of an axle template, which are determined<br />
using a Canny edge detector [5]. Edges are used in matching because intensity variations are<br />
expected in both the visible and thermal images. A distance trans<strong>for</strong>m (DT) is used <strong>for</strong> robust<br />
matching since it doesn’t require a one-to-one match between the one-pixel-width edges [2].<br />
Relative to the visible-range camera, the infrared camera produced a magnified view due to its<br />
longer focal-length lens. To correct <strong>for</strong> this scale difference, the axle edge template was<br />
iteratively scaled to different sizes, and DT was used with the thermal edge image to find the<br />
best scale. <strong>Using</strong> the detected axles as anchor points, the thermal panorama was registered<br />
and overlaid with the visible panorama.<br />
Module 3: <strong>Machine</strong> <strong>Vision</strong> Inspection<br />
Global and coarse-level anomalies, in panoramas of both spectra, are detected in Module 3A.<br />
Then, individual components are inspected locally in Module 3B. Finally, components found at<br />
multiple locations in a railcar are analyzed to identify operational outliers in Module 3C.<br />
Module 3A: Global Anomaly Detection<br />
A relatively coarse-level analysis could be used <strong>for</strong> detection of <strong>for</strong>eign or missing components<br />
by comparing the railcar panorama to a car-level template. Car-specific visible and thermal<br />
templates were created and stored <strong>for</strong> each piece of equipment to allow <strong>for</strong> unique<br />
configurations due to repairs and other modifications. To detect anomalies, block-level<br />
correlation was per<strong>for</strong>med between the recorded panorama (Figure 6b) and the railcar's<br />
template (Figure 6a). An example of anomaly detection is illustrated by the junction box<br />
presentin the panorama <strong>for</strong> the car but not in the template. Areas of mismatch have a low<br />
correlation and the junction box is clearly evident (dark area in Figure 6c). Detection of thermal<br />
(a)<br />
(b)<br />
(c)<br />
(d)<br />
(e)<br />
(f)<br />
Figure 6: (a) Visible undercarriage template of an Amfleet-II coach, (b) undercarriage with an<br />
anomaly (a junction box not present on the template), and (c) the detected anomaly (dark block).<br />
(d) Partial thermal undercarriage template of an Amtrak Superliner car, (e) undercarriage with<br />
thermal anomaly, and (f) the detected anomaly (light blue block).<br />
5
anomalies is computed in a similar manner using differences in color values between the<br />
thermal panorama and the car’s thermal template (Figures 6d – 6f).<br />
Module 3B: Component-level Anomaly Detection<br />
Individual components were compared to the corresponding templates that contained the<br />
normal visible (or thermal) characteristics <strong>for</strong> each component. There should be one template<br />
<strong>for</strong> any allowable version of a component. The undercarriage components were examined in<br />
three steps.<br />
Step 1: Align components with template<br />
In the first step, we spatially aligned the components with their template using the DT applied to<br />
Canny edge images. An example is a template <strong>for</strong>med by merging three water tank images.<br />
The median-filtering technique was used to <strong>for</strong>m a composite image (Figure 7a). A particular<br />
water tank, after alignment was compared to the template and its missing faceplate is evident<br />
(Figure 7b). The thermal components are similarly aligned with their templates and then<br />
registered with the corresponding visible images.<br />
Step 2: Identify areas of mismatch<br />
In the second step, the areas of dissimilarity between the template and the detected component<br />
are identified (Figure 7c). We created small windows around each pixel in both the visible and<br />
thermal images. In the visible domain, we computed the correlation between the template and<br />
the potentially defective component <strong>for</strong> each pixel window, and in the thermal domain, the<br />
luminance difference is computed. Anomalous pixels in the visible and thermal images are<br />
pixels whose surrounding windows have exceeded the correlation or luminance difference<br />
threshold, respectively. The areas of low correlation in the visible domain between the water<br />
container template and a defective component can be seen in Figure 7c. Thermally mismatched<br />
areas were also located.<br />
(a) (b) (c) (d)<br />
Figure 7: (a) Water tank template, (b) defective water tank, (c) areas of visible mismatch, and<br />
(d) areas of mismatch, grouped into regions.<br />
Step 3: Learn defect categories<br />
In the third step, the areas from Step 2 are grouped into contiguous regions of similar pixels<br />
using the K-means clustering algorithm [3]. The following features were extracted from each<br />
region: 1) (x,y) coordinates of the centroid; 2) the mean red, green, and blue color values; 3)<br />
region area in pixels; 4) simple shape estimation (eccentricity); and 5) a measure of how<br />
compact the boundary is (compactness). Thus, each anomalous region can be represented by<br />
a five-dimensional (5D) feature vector. Each defect category is represented in the 5D feature<br />
space using a Gaussian mixture model (GMM) [3]. In our GMM, a single anomaly category is<br />
represented by a weighted combination of several Gaussian probability distributions. We learn<br />
the weighting coefficients and Gaussian parameters by training on examples of anomalous<br />
regions.<br />
6
Human intervention is required during training to classify regions. The class labels can be rough<br />
(defect/no defect) or specific (defect-corrosion, no defect-shine, defect-missing faceplate). In<br />
case an external condition causes a mismatch with the template (e.g., snow or ice buildup), it<br />
can be added as a class; there<strong>for</strong>e, this condition can be classified if encountered again.<br />
Regions from the thermal defective areas are learned similarly, and visible and thermal defects<br />
can be integrated in future work. In Figure 7d, the areas of mismatch have been grouped into<br />
regions and the classifications from training are shown. Two categories of regions were labeled<br />
by human intervention: “Missing Faceplate” and “No Defect – Shine”. Region 1 was labeled<br />
“Missing Faceplate” and Regions 2 and 3 were both labeled “No Defect – Shine”.<br />
During testing, the GMM classifier is tested on previously unseen regions. We created a<br />
different segmentation from Figure 7c during testing in which Regions 2 and 3 from Figure 7d<br />
were combined into one large region. This larger region was classified correctly (shine). This<br />
demonstrates the generalization capability of a GMM <strong>for</strong> defect classification and its robustness<br />
to different region <strong>for</strong>mation (segmentation) methods. Further, we can eliminate false positives<br />
by incorporating benign defect categories into the classification. Similar results were achieved<br />
using region-based grouping of anomalous temperature regions.<br />
Module 3C: Relative Anomaly Detection of Like Components<br />
Individual components that are found at several locations in an undercarriage are inspected <strong>for</strong><br />
operational consistency. For example, a locomotive’s traction motors, a passenger car’s A.C.<br />
blower units, and a car’s brakes should all be operating uni<strong>for</strong>mly.<br />
The temperature of each brake disc was recorded, and temperatures that are anomalous with<br />
respect to other brakes were identified. In Table 1, brighter orange and higher luminance<br />
corresponds to a hotter disc brake. Without predefined operating ranges, we considered the<br />
hottest brake as an outlier (in Table 1, the luminance of Brake 1 of Car 2 is 1.5 times the<br />
standard deviation).<br />
<strong>Using</strong> the edge image, the operating size of the return spring compression and the brake caliper<br />
are then measured to troubleshoot. This measurement indicates the contraction of the return<br />
spring device, and the resulting brake caliper contraction. This can then be used in a hybrid<br />
feature space that contains both distance and thermal measurements <strong>for</strong> further diagnosis. In<br />
Car 2, because of the smaller brake caliper opening and higher temperature of Brake 1, a<br />
thinner brake pad (with respect to Brake 2) is suspected. The diagnostic measurements along<br />
with the brake temperatures could also be learned using a GMM.<br />
Image of<br />
Disc Brake<br />
Area<br />
Mean<br />
Luminance<br />
Brake<br />
1<br />
Car 1 Car 2 Car 3 Car 4<br />
Brake<br />
2<br />
0.37 0.39<br />
Brake<br />
1<br />
Brake<br />
2<br />
7<br />
Brake<br />
1<br />
Brake<br />
2<br />
Brake<br />
1<br />
Brake<br />
2<br />
0.58 0.49 0.47 0.45 0.32 0.37<br />
Table 1: Images of different car and axle brake thermal condition.<br />
In our application, we have detected thermal outliers, and then used diagnostic measurements<br />
to <strong>for</strong>m a course diagnosis (e.g. thin brake pads). Further knowledge of brake failure causes<br />
would be needed <strong>for</strong> a working system. With more data and domain knowledge, incorporating<br />
visible and thermal outlier identification followed by troubleshooting would be used to verify<br />
uni<strong>for</strong>m component operation of the traction motors and A.C. blower units as well.
Conclusion<br />
The work presented here demonstrates that multispectral machine vision offers substantial<br />
potential advantages to inspection and repair personnel <strong>for</strong> monitoring the health of railroad<br />
equipment. The creation of detailed, whole-train panoramic images and whole-car templates <strong>for</strong><br />
comparison offers unprecedented inspection and condition monitoring capabilities <strong>for</strong> railway<br />
rolling stock and locomotive undercarriages. <strong>Using</strong> these images, the system can enhance<br />
normal visual inspections <strong>for</strong> missing or damaged components, and potentially identify <strong>for</strong>eign<br />
objects. The system has the additional advantage of facilitating digital recording and<br />
quantification of inspection results <strong>for</strong> comparison and trending. A significant additional benefit<br />
of the technology described in this paper is that the system provides a thermal view to help<br />
identify overheating or overworked mechanical and electrical components. Beyond this, we<br />
have demonstrated that through the integration of the visible and thermal views, diagnosis of<br />
incipient failures can be determined. We have also shown that the inherent cause of an incipient<br />
failure may be able to be isolated. <strong>Using</strong> multi-spectral machine vision techniques on railcar<br />
panoramas allows the system to monitor the physical and thermal condition of railroad<br />
equipment more efficiently and effectively than is possible using current methods and<br />
technologies.<br />
Acknowledgements<br />
This research was funded by the Transportation Research Board – High-Speed Rail IDEA<br />
Program, Project HSR-49. We are grateful to James Lundgren of the Transportation<br />
Technology Center, Inc. and Paul Steets, John Raila, and Dale Kay of Amtrak <strong>for</strong> their<br />
assistance, cooperation and guidance on this project. Thanks also to Gavin Horn <strong>for</strong> use of, and<br />
training on, the infrared camera, and to Derrick Hammer who provided the motion picture<br />
lighting equipment and guidance on its use. Special thanks to Amtrak and the Monticello<br />
Railway Museum <strong>for</strong> their cooperation and generous use of facilities.<br />
References<br />
[1] N. Ahuja and C. Barkan, "<strong>Machine</strong> <strong>Vision</strong> <strong>for</strong> Railroad Equipment <strong>Undercarriage</strong> Inspection<br />
<strong>Using</strong> <strong>Multi</strong>-<strong>Spectral</strong> <strong>Imaging</strong>", Transportation Research Board High-Speed Rail IDEA Program<br />
Final Report, (2007).<br />
[2] H.G. Barrow, J.M. Tanenbaum, R.C. Botles and H.C. Wolf, “Parametric correspondence and<br />
chamfer matching: Two new techniques <strong>for</strong> image matching,” In: Proc. of 5 th Int’l. Joint Conf. on<br />
Artificial Intelligence, Cambridge, MA, pp. 659–653, (1977).<br />
[3] Bishop, C., Pattern Recognition and <strong>Machine</strong> Learning. New York: Springer, (2006).<br />
[4] J.R. Edwards, C.P.L. Barkan, J.M. Hart, S. Todorovic, N. Ahuja, "Improving the efficiency<br />
and effectiveness of railcar safety appliance inspection using machine vision technology".<br />
JRC2006-94052, In: Proc. of the ASME JRC2006 Joint Rail Conf., Atlanta, GA, Apr. 4-6, (2006).<br />
[5] D.A. Forsyth, and J. Ponce, Computer <strong>Vision</strong>: A Modern Approach. Prentice Hall, (2003).<br />
[6] B. Freid, C.P.L. Barkan, N. Ahuja, J.M. Hart, S. Todorovic, N. Kocher, "<strong>Multi</strong>spectral<br />
<strong>Machine</strong> <strong>Vision</strong> <strong>for</strong> Improved <strong>Undercarriage</strong> Inspection of Railroad Rolling Stock". In: Proc. of<br />
the Int’l Heavy Haul Conf. "Specialist Technical Session", Kiruna, Sweden, pp. 737-744, (2007).<br />
[7] J.M. Hart, N. Ahuja, C.P.L. Barkan, D.D. Davis, "A <strong>Machine</strong> <strong>Vision</strong> System <strong>for</strong> Monitoring<br />
Railcar Health: Preliminary Results", TD-04-008, Association of American Railroads, (2004).<br />
[8] Y-C. Lai, C.P.L. Barkan, J. Drapa, N. Ahuja, J.M. Hart, P.J. Narayanan, C.V. Jawahar, A.<br />
Kumar, L. Milhon and M.P. Stehly. “<strong>Machine</strong> vision analysis of the energy efficiency of<br />
intermodal freight trains”. Journal of Rail and Rapid Transit, Volume 221, pp. 353-364, (2007).<br />
8