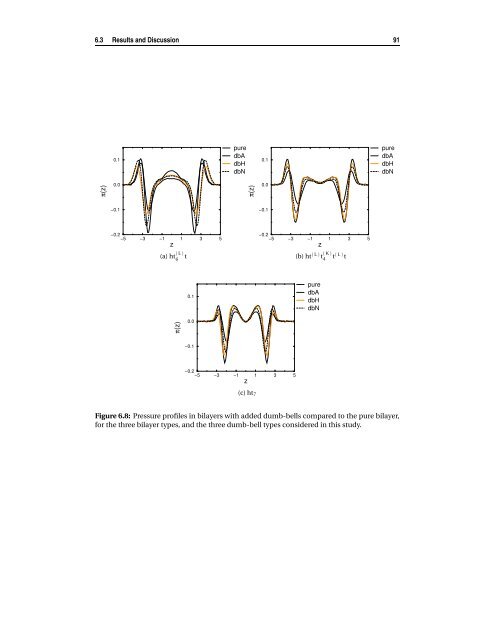
90 Interaction <strong>of</strong> small molecules <strong>with</strong> <strong>bilayers</strong> from figure 6.7). In the ht (L) 6 t bilayer, this decrease in chain order leads to a decrease in interdigitation, <strong>and</strong> the two monolayers become more separated. This results in an increase <strong>of</strong> the bilayer thickness, even if the end-to-end distance decreases. In the case <strong>of</strong> the flexible <strong>and</strong> unsaturated bilayer, the increase in thickness is much smaller, <strong>and</strong> it can be accounted for by both the presence <strong>of</strong> the solute molecules in the bilayer interior <strong>and</strong> by a (small) increase in the end-to-end distance. Since the <strong>lipid</strong>s in these bilayer types are already much less ordered than in the stiff bilayer, the addition <strong>of</strong> the solutes does not have a significant effect on the order parameters (data not shown). It is important to observe that the effect <strong>of</strong> the neutral dumb-bells on the bilayer properties is the same than the effect <strong>of</strong> the amphiphilic dumb-bells, because they both absorb at the bilayer interface. However, since the neutral molecules largely diffuse in the water phase (<strong>and</strong> sometimes even in the bilayer inner core) they have an effective lower concentration in the bilayer compared to the amphiphilic ones. For this reason, they have a lesser effect on the bilayer structure compared to the amphiphilic molecules. 6.3.3 Effect on the pressure distribution The effect <strong>of</strong> addition <strong>of</strong> solute molecules on the lateral pressure pr<strong>of</strong>ile across the bilayer is shown in figure 6.8, where we plot the pressure pr<strong>of</strong>iles in the <strong>bilayers</strong> <strong>with</strong> added the solutes to compare them to the pressure pr<strong>of</strong>ile in the pure <strong>bilayers</strong>. As a general observation, the peaks (both positive <strong>and</strong> negative) <strong>of</strong> the lateral pressure decrease in magnitude by addition <strong>of</strong> solutes, irrespective <strong>of</strong> the bilayer type, <strong>and</strong> <strong>of</strong> the nature <strong>of</strong> the added molecules. In this sense, the solutes can be seen as interfacial active molecules, that, like soap, have the effect <strong>of</strong> shifting to zero the local pressure (<strong>and</strong> the surface tension) <strong>of</strong> the interface where it locates. However, since a bilayer is not a simple interface, but has a complex structure, different molecules, at different position <strong>with</strong>in the bilayer, change the lateral pressure in different ways. To describe the characteristics <strong>of</strong> the pressure pr<strong>of</strong>ile, we make use <strong>of</strong> the interfaces defined in Chapter 4 (see figure 4.5 therein). It is important to remind that the integral <strong>of</strong> the lateral pressure across the bilayer is always zero, since the bilayer is in a tensionless state. Hence, a positive or negative change in the lateral pressure in one region <strong>of</strong> the bilayer, should be compensated by opposite changes in other regions <strong>of</strong> the bilayer. The largest shift in the pressure is at the headgroup/tails interface (first negative peak in figures 6.8), but the magnitude <strong>of</strong> this shift largely depends on the bilayer structure. For the stiff bilayer (figure 6.8(a)) both hydrophilic <strong>and</strong> hydrophobic solutes increase the local pressure by approximately the same amount, while for the more flexible <strong>bilayers</strong> (figure 6.8(b) <strong>and</strong> 6.8(c)) the amphiphilic molecules have a much larger effect than the hydrophobic ones. This shift <strong>of</strong> lateral pressure is com-
6.3 Results <strong>and</strong> Discussion 91 π(z) 0.1 0.0 −0.1 −0.2 −5 −3 −1 z 1 3 5 (a) ht (L) 6 t π(z) 0.1 0.0 −0.1 pure dbA dbH dbN π(z) 0.1 0.0 −0.1 −0.2 −5 −3 −1 z 1 3 5 (c) ht7 −0.2 −5 −3 −1 z 1 3 5 (b) ht (L) t (K) 4 t (L) t Figure 6.8: Pressure pr<strong>of</strong>iles in <strong>bilayers</strong> <strong>with</strong> added dumb-bells compared to the pure bilayer, for the three bilayer types, <strong>and</strong> the three dumb-bell types considered in this study. pure dbA dbH dbN pure dbA dbH dbN