Mesoscopic models of lipid bilayers and bilayers with embedded ...
Mesoscopic models of lipid bilayers and bilayers with embedded ...
Mesoscopic models of lipid bilayers and bilayers with embedded ...

You also want an ePaper? Increase the reach of your titles
YUMPU automatically turns print PDFs into web optimized ePapers that Google loves.
5.2 Single-tail <strong>lipid</strong> <strong>bilayers</strong> 69<br />
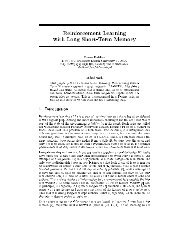
A L<br />
1.0<br />
0.9<br />
0.8<br />
0.7<br />
0.6<br />
a hh =10<br />
a hh =15<br />
a hh =20<br />
a hh =25<br />
a hh =35<br />
0.5<br />
0.8 0.9 1.0<br />
T*<br />
1.1 1.2<br />
(a) (b)<br />
(c)<br />
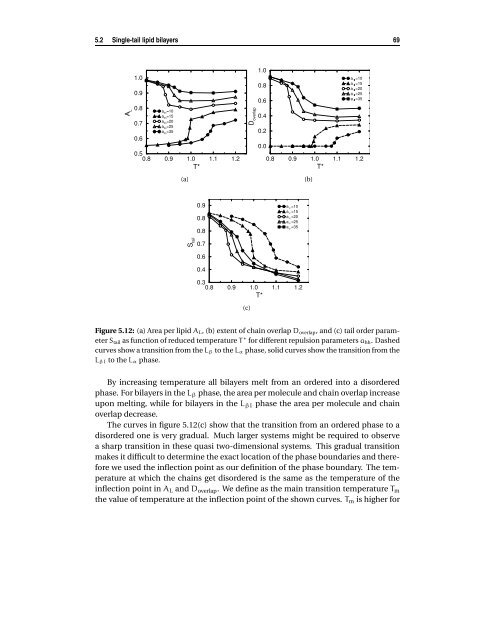
Figure 5.12: (a) Area per <strong>lipid</strong> AL, (b) extent <strong>of</strong> chain overlap Doverlap, <strong>and</strong> (c) tail order parameter<br />
Stail as function <strong>of</strong> reduced temperature T ∗ for different repulsion parameters ahh. Dashed<br />
curves show a transition from the Lβ to the Lα phase, solid curves show the transition from the<br />
LβI to the Lα phase.<br />
By increasing temperature all <strong>bilayers</strong> melt from an ordered into a disordered<br />
phase. For <strong>bilayers</strong> in the Lβ phase, the area per molecule <strong>and</strong> chain overlap increase<br />
upon melting, while for <strong>bilayers</strong> in the LβI phase the area per molecule <strong>and</strong> chain<br />
overlap decrease.<br />
The curves in figure 5.12(c) show that the transition from an ordered phase to a<br />
disordered one is very gradual. Much larger systems might be required to observe<br />
a sharp transition in these quasi two-dimensional systems. This gradual transition<br />
makes it difficult to determine the exact location <strong>of</strong> the phase boundaries <strong>and</strong> therefore<br />
we used the inflection point as our definition <strong>of</strong> the phase boundary. The temperature<br />
at which the chains get disordered is the same as the temperature <strong>of</strong> the<br />
inflection point in AL <strong>and</strong> D overlap. We define as the main transition temperature Tm<br />
the value <strong>of</strong> temperature at the inflection point <strong>of</strong> the shown curves. Tm is higher for