Mesoscopic models of lipid bilayers and bilayers with embedded ...
Mesoscopic models of lipid bilayers and bilayers with embedded ... Mesoscopic models of lipid bilayers and bilayers with embedded ...
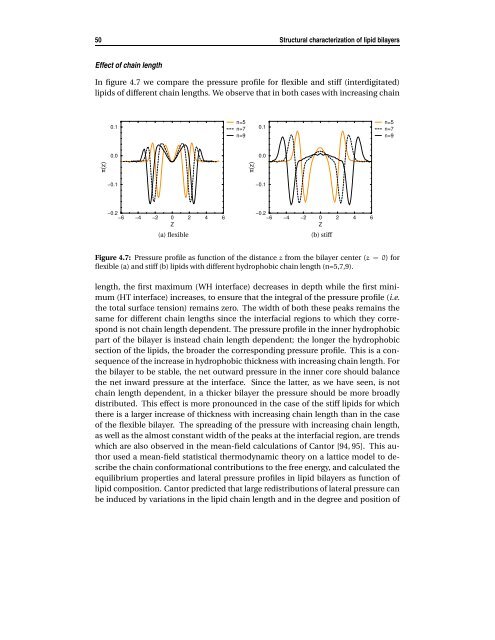
50 Structural characterization of lipid bilayers Effect of chain length In figure 4.7 we compare the pressure profile for flexible and stiff (interdigitated) lipids of different chain lengths. We observe that in both cases with increasing chain π(z) 0.1 0.0 −0.1 −0.2 −6 −4 −2 0 Z 2 4 6 (a) flexible n=5 n=7 n=9 π(z) 0.1 0.0 −0.1 −0.2 −6 −4 −2 0 Z 2 4 6 (b) stiff Figure 4.7: Pressure profile as function of the distance z from the bilayer center (z = 0) for flexible (a) and stiff (b) lipids with different hydrophobic chain length (n=5,7,9). length, the first maximum (WH interface) decreases in depth while the first minimum (HT interface) increases, to ensure that the integral of the pressure profile (i.e. the total surface tension) remains zero. The width of both these peaks remains the same for different chain lengths since the interfacial regions to which they correspond is not chain length dependent. The pressure profile in the inner hydrophobic part of the bilayer is instead chain length dependent; the longer the hydrophobic section of the lipids, the broader the corresponding pressure profile. This is a consequence of the increase in hydrophobic thickness with increasing chain length. For the bilayer to be stable, the net outward pressure in the inner core should balance the net inward pressure at the interface. Since the latter, as we have seen, is not chain length dependent, in a thicker bilayer the pressure should be more broadly distributed. This effect is more pronounced in the case of the stiff lipids for which there is a larger increase of thickness with increasing chain length than in the case of the flexible bilayer. The spreading of the pressure with increasing chain length, as well as the almost constant width of the peaks at the interfacial region, are trends which are also observed in the mean-field calculations of Cantor [94, 95]. This author used a mean-field statistical thermodynamic theory on a lattice model to describe the chain conformational contributions to the free energy, and calculated the equilibrium properties and lateral pressure profiles in lipid bilayers as function of lipid composition. Cantor predicted that large redistributions of lateral pressure can be induced by variations in the lipid chain length and in the degree and position of n=5 n=7 n=9
4.4 Results and discussion 51 chain unsaturation, as well as by changes in the headgroup repulsion. Effect of local changes in the lipid chain To investigate if the effect of a modification in the lipid architecture on the distribution of the pressure profile depends on the position of the change along the chain, we compare fully flexible lipids with flexible lipids in which a bond-bending potential with equilibrium angle θo = 180 o is introduced either close to the headgroup (ht (L) tn−1) or toward the end of the tail (htn−2t (L) t). We also compare stiff lipids with lipids in which a kink is introduced either between the first two bonds (ht (K) t (L) n−2 t), or the last two bonds of the chain (ht (L) n−2 t(K) t). In both cases short lipids with n = 5 tail beads and long ones with n = 9 tail beads are studied. The effect of a local stiffness in the bilayer of flexible amphiphiles of short and long chains is shown in figure 4.8. From these plots it can be observed that an in- π(z) 0.1 0.0 −0.1 −0.2 −4 −2 0 2 4 Z (a) ht 5 ht 3 t (L) t ht (L) t 4 π(z) 0.1 0.0 −0.1 −0.2 −4 −2 0 2 4 Z Figure 4.8: Pressure profile, π(z), as function of the distance z from the bilayer center (z=0). Fully flexible lipids and lipids with a stiffness near the headgroup or at the tail end are compared for (a) short lipids with 5 tail beads, and (b) long lipids with 9 tail beads. creased stiffness at the tail-end does not significantly change the pressure profile, in both cases of long and short lipids. However, if the stiffness is close to the head group we observe a larger effect. The maximum at the WH interface increases in magnitude and the minimum at the HT interface deepens compared to fully flexible lipids. Also, the first maximum in the hydrophobic core increases in height, while the central minimum does not change. The stiffness reduces the disorder of the tails and the headgroups pack more tightly, increasing the density at the interface and in the first region of the hydrophobic core. The higher density results in an increase of the lateral pressures in these regions, but since the effect is local, it does not propagate as far as the midplane. On the other hand, an increase in stiffness in the midplane region, (b) ht 9 ht 7 t (L) t ht (L) t 8
- Page 6 and 7: ii CONTENTS 5.3 Double-tail lipid b
- Page 8 and 9: 2 Introduction 1.1 The cell membran
- Page 10 and 11: 4 Introduction between the beads, a
- Page 12 and 13: 6 Introduction whether the preferre
- Page 14 and 15: 8 Simulation method for coarse-grai
- Page 16 and 17: 10 Simulation method for coarse-gra
- Page 18 and 19: 12 Simulation method for coarse-gra
- Page 20 and 21: 14 Simulation method for coarse-gra
- Page 22 and 23: 16 Simulation method for coarse-gra
- Page 24 and 25: 18 Simulation method for coarse-gra
- Page 27 and 28: III Surface tension in lipid bilaye
- Page 29 and 30: 3.2 Method of calculation of surfac
- Page 31 and 32: 3.2 Method of calculation of surfac
- Page 33 and 34: 3.3 Constant surface tension ensemb
- Page 35 and 36: 3.3 Constant surface tension ensemb
- Page 37 and 38: 3.4 Surface tension in lipid bilaye
- Page 39 and 40: 3.4 Surface tension in lipid bilaye
- Page 41 and 42: 3.4 Surface tension in lipid bilaye
- Page 43 and 44: IV Structural characterization of l
- Page 45 and 46: 4.2 Structural quantities 39 been r
- Page 47 and 48: 4.3 Computational details 41 lipid
- Page 49 and 50: 4.4 Results and discussion 43 ρ(z)
- Page 51 and 52: 4.4 Results and discussion 45 one l
- Page 53 and 54: 4.4 Results and discussion 47 WH HT
- Page 55: 4.4 Results and discussion 49 Shill
- Page 59 and 60: 4.4 Results and discussion 53 4.4.4
- Page 61: 4.4 Results and discussion 55 headg
- Page 64 and 65: 58 Phase behavior of coarse-grained
- Page 66 and 67: 60 Phase behavior of coarse-grained
- Page 68 and 69: 62 Phase behavior of coarse-grained
- Page 70 and 71: 64 Phase behavior of coarse-grained
- Page 72 and 73: 66 Phase behavior of coarse-grained
- Page 74 and 75: 68 Phase behavior of coarse-grained
- Page 76 and 77: 70 Phase behavior of coarse-grained
- Page 78 and 79: 72 Phase behavior of coarse-grained
- Page 80 and 81: 74 Phase behavior of coarse-grained
- Page 82 and 83: 76 Phase behavior of coarse-grained
- Page 85 and 86: VI Interaction of small molecules w
- Page 87 and 88: 6.2 Computational details 81 For re
- Page 89 and 90: 6.3 Results and Discussion 83 withi
- Page 91 and 92: 6.3 Results and Discussion 85 ρ(z)
- Page 93 and 94: 6.3 Results and Discussion 87 ρ(z)
- Page 95 and 96: 6.3 Results and Discussion 89 S m 0
- Page 97 and 98: 6.3 Results and Discussion 91 π(z)
- Page 99: 6.3 Results and Discussion 93 the l
- Page 102 and 103: 96 Mesoscopic model for lipid bilay
- Page 104 and 105: 98 Mesoscopic model for lipid bilay
50 Structural characterization <strong>of</strong> <strong>lipid</strong> <strong>bilayers</strong><br />
Effect <strong>of</strong> chain length<br />
In figure 4.7 we compare the pressure pr<strong>of</strong>ile for flexible <strong>and</strong> stiff (interdigitated)<br />
<strong>lipid</strong>s <strong>of</strong> different chain lengths. We observe that in both cases <strong>with</strong> increasing chain<br />
π(z)<br />
0.1<br />
0.0<br />
−0.1<br />
−0.2<br />
−6 −4 −2 0<br />
Z<br />
2 4 6<br />
(a) flexible<br />
n=5<br />
n=7<br />
n=9<br />
π(z)<br />
0.1<br />
0.0<br />
−0.1<br />
−0.2<br />
−6 −4 −2 0<br />
Z<br />
2 4 6<br />
(b) stiff<br />
Figure 4.7: Pressure pr<strong>of</strong>ile as function <strong>of</strong> the distance z from the bilayer center (z = 0) for<br />
flexible (a) <strong>and</strong> stiff (b) <strong>lipid</strong>s <strong>with</strong> different hydrophobic chain length (n=5,7,9).<br />
length, the first maximum (WH interface) decreases in depth while the first minimum<br />
(HT interface) increases, to ensure that the integral <strong>of</strong> the pressure pr<strong>of</strong>ile (i.e.<br />
the total surface tension) remains zero. The width <strong>of</strong> both these peaks remains the<br />
same for different chain lengths since the interfacial regions to which they correspond<br />
is not chain length dependent. The pressure pr<strong>of</strong>ile in the inner hydrophobic<br />
part <strong>of</strong> the bilayer is instead chain length dependent; the longer the hydrophobic<br />
section <strong>of</strong> the <strong>lipid</strong>s, the broader the corresponding pressure pr<strong>of</strong>ile. This is a consequence<br />
<strong>of</strong> the increase in hydrophobic thickness <strong>with</strong> increasing chain length. For<br />
the bilayer to be stable, the net outward pressure in the inner core should balance<br />
the net inward pressure at the interface. Since the latter, as we have seen, is not<br />
chain length dependent, in a thicker bilayer the pressure should be more broadly<br />
distributed. This effect is more pronounced in the case <strong>of</strong> the stiff <strong>lipid</strong>s for which<br />
there is a larger increase <strong>of</strong> thickness <strong>with</strong> increasing chain length than in the case<br />
<strong>of</strong> the flexible bilayer. The spreading <strong>of</strong> the pressure <strong>with</strong> increasing chain length,<br />
as well as the almost constant width <strong>of</strong> the peaks at the interfacial region, are trends<br />
which are also observed in the mean-field calculations <strong>of</strong> Cantor [94, 95]. This author<br />
used a mean-field statistical thermodynamic theory on a lattice model to describe<br />
the chain conformational contributions to the free energy, <strong>and</strong> calculated the<br />
equilibrium properties <strong>and</strong> lateral pressure pr<strong>of</strong>iles in <strong>lipid</strong> <strong>bilayers</strong> as function <strong>of</strong><br />
<strong>lipid</strong> composition. Cantor predicted that large redistributions <strong>of</strong> lateral pressure can<br />
be induced by variations in the <strong>lipid</strong> chain length <strong>and</strong> in the degree <strong>and</strong> position <strong>of</strong><br />
n=5<br />
n=7<br />
n=9


