Mesoscopic models of lipid bilayers and bilayers with embedded ...
Mesoscopic models of lipid bilayers and bilayers with embedded ...
Mesoscopic models of lipid bilayers and bilayers with embedded ...

You also want an ePaper? Increase the reach of your titles
YUMPU automatically turns print PDFs into web optimized ePapers that Google loves.
48 Structural characterization <strong>of</strong> <strong>lipid</strong> <strong>bilayers</strong><br />
0.2<br />
0.1<br />
0.0<br />
−0.1<br />
0.2<br />
0.1<br />
0.0<br />
−0.1<br />
0.2<br />
0.1<br />
0.0<br />
−0.1<br />
WH<br />
HT<br />
MP<br />
−5 −3 −1 1 3 5<br />
Z<br />
WH<br />
(a)<br />
−5 −3 −1 1 3 5<br />
Z<br />
WH<br />
HT MP<br />
HT<br />
(c)<br />
MP<br />
−5 −3 −1 1 3 5<br />
Z<br />
(e)<br />
w<br />
h<br />
t (1,..,n−1)<br />
t n<br />
ρ tot<br />
π(z)<br />
w<br />
h<br />
t (1,..,n−1)<br />
t n<br />
ρ tot<br />
π(z)<br />
w<br />
h<br />
t (1,..,n−1)<br />
t n<br />
ρ tot<br />
π(z)<br />
p L (z)−p N (z)<br />
p L (z)−p N (z)<br />
p L (z)−p N (z)<br />
0.8<br />
0.4<br />
0.0<br />
−0.4<br />
−0.8<br />
−5 −3 −1 1 3 5<br />
Z<br />
0.8<br />
0.4<br />
0.0<br />
−0.4<br />
(b)<br />
−0.8<br />
−5 −3 −1 1 3 5<br />
Z<br />
0.8<br />
0.4<br />
0.0<br />
−0.4<br />
(d)<br />
−0.8<br />
−5 −3 −1 1 3 5<br />
Z<br />
(f)<br />
total<br />
non bonded<br />
springs<br />
total<br />
non bonded<br />
springs<br />
bending<br />
total<br />
non bonded<br />
springs<br />
bending<br />
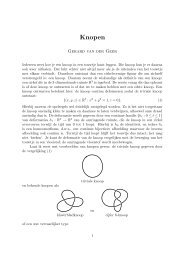
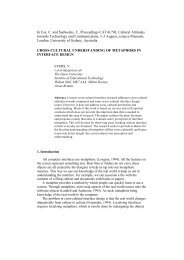
Figure 4.6: Lateral pressure pr<strong>of</strong>ile π(z) = pL(z) − pT (z), <strong>and</strong> contributions from the different<br />
inter <strong>and</strong> intra molecular potentials as function <strong>of</strong> the distance from the bilayer center z = 0.<br />
The figures refer to <strong>bilayers</strong> <strong>of</strong> fully flexible <strong>lipid</strong>s (top), stiff <strong>lipid</strong>s <strong>with</strong> headgroup repulsion<br />
parameter ahh = 15 (middle), <strong>and</strong> stiff <strong>lipid</strong>s <strong>with</strong> headgroup repulsion parameter ahh = 35<br />
(bottom). The density pr<strong>of</strong>iles ρ(z) for water (w), head (h), <strong>and</strong> tail (t) beads, as well as the<br />
total density, have been plotted in the same graphs to make clear the location <strong>of</strong> the maxima<br />
<strong>and</strong> minima <strong>of</strong> the pressure pr<strong>of</strong>ile <strong>with</strong>in the bilayer. The interfaces described in the text <strong>and</strong><br />
shown in figure 4.5 are also indicated. The density pr<strong>of</strong>iles have been rescaled to adjust to the<br />
pressure scale.