Mesoscopic models of lipid bilayers and bilayers with embedded ...
Mesoscopic models of lipid bilayers and bilayers with embedded ...
Mesoscopic models of lipid bilayers and bilayers with embedded ...

You also want an ePaper? Increase the reach of your titles
YUMPU automatically turns print PDFs into web optimized ePapers that Google loves.
3.4 Surface tension in <strong>lipid</strong> <strong>bilayers</strong> 33<br />
γ<br />
1.0<br />
0.0<br />
−1.0<br />
−2.0<br />
−3.0<br />
P(A L )<br />
−4.0<br />
=1.50<br />
−5.0<br />
1.42 1.44 1.46 1.48 1.50<br />
AL 1.52 1.54 1.56<br />
(a) γ = −2<br />
γ<br />
3.0<br />
2.0<br />
1.0<br />
0.0<br />
−1.0<br />
P(A L )<br />
−2.0<br />
=1.66<br />
−3.0<br />
1.60 1.62 1.64 1.66<br />
AL 1.68 1.70 1.72<br />
(b) γ = 0<br />
γ<br />
5.0<br />
4.0<br />
3.0<br />
2.0<br />
1.0<br />
P(A L )<br />
0.0<br />
=1.83<br />
−1.0<br />
1.76 1.78 1.80 1.82 1.84<br />
AL 1.86 1.88 1.90<br />
(c) γ = 2<br />
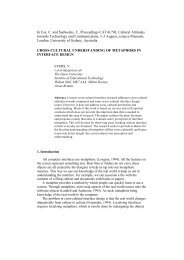
Figure 3.6: Histograms <strong>of</strong> the area per <strong>lipid</strong> AL <strong>and</strong> corresponding average value <strong>of</strong> the calculated<br />
surface tension γ (filled circles) in each bin. The three plots refer to a bilayer <strong>of</strong> 400<br />
h3(t5)2 <strong>lipid</strong>s <strong>with</strong> different values <strong>of</strong> the imposed surface tension: (a) γ = −2, (b) γ = 0, <strong>and</strong><br />
(c) γ = 2. The values on the graph ordinate refer to γ only, while the height <strong>of</strong> the bins in the<br />
histogram is proportional to P(AL), i.e. to the probability distribution <strong>of</strong> the area per <strong>lipid</strong>. The<br />
basis line <strong>of</strong> each <strong>of</strong> the histograms corresponds to the imposed value <strong>of</strong> γ. The average values<br />
<strong>of</strong> the area per <strong>lipid</strong>, 〈AL〉, are also reported in the graphs. The error on these values is ±0.02.<br />
at negative values <strong>of</strong> the surface tension, but also for stretched <strong>bilayers</strong>, <strong>and</strong> only tensionless<br />
<strong>bilayers</strong> were found to display no finite-size effects. It must be pointed out<br />
that the more complex <strong>and</strong> long range (electrostatic) interactions used in atomistic<br />
MD, <strong>and</strong> not represented in our mesoscopic model, might have an influence on the<br />
calculation <strong>of</strong> the surface tension <strong>and</strong> on its dependence on system size.<br />
A L<br />
2.1<br />
1.9<br />
1.7<br />
1.5<br />
N L =100<br />
N L =200<br />
N L =400<br />
N L =900<br />
N L =1600<br />
1.3<br />
−3 −2 −1 0 1 2 3 4<br />
γ<br />
Figure 3.8: Average values <strong>of</strong> the area per <strong>lipid</strong> at equilibrium, AL, as function <strong>of</strong> applied surface<br />
tension γ, for bilayer patches <strong>of</strong> different sizes, i.e. number <strong>of</strong> <strong>lipid</strong>s NL. The lines connecting<br />
the symbols are only a guide to the eye.