Mesoscopic models of lipid bilayers and bilayers with embedded ...
Mesoscopic models of lipid bilayers and bilayers with embedded ... Mesoscopic models of lipid bilayers and bilayers with embedded ...
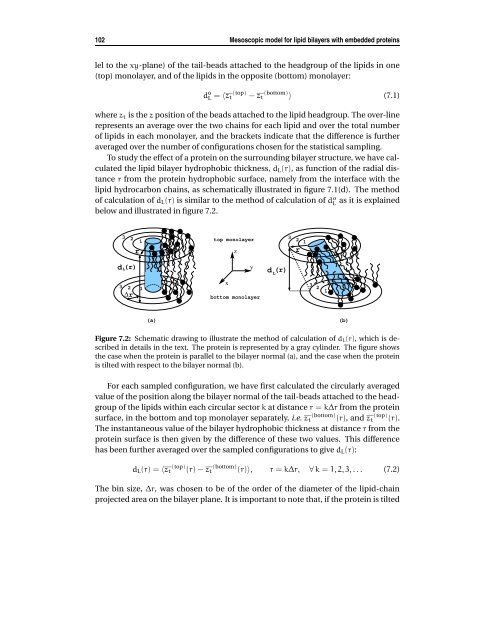
102 Mesoscopic model for lipid bilayers with embedded proteins lel to the xy-plane) of the tail-beads attached to the headgroup of the lipids in one (top) monolayer, and of the lipids in the opposite (bottom) monolayer: d o L = 〈zt (top) − zt (bottom) 〉 (7.1) where zt is the z position of the beads attached to the lipid headgroup. The over-line represents an average over the two chains for each lipid and over the total number of lipids in each monolayer, and the brackets indicate that the difference is further averaged over the number of configurations chosen for the statistical sampling. To study the effect of a protein on the surrounding bilayer structure, we have calculated the lipid bilayer hydrophobic thickness, dL(r), as function of the radial distance r from the protein hydrophobic surface, namely from the interface with the lipid hydrocarbon chains, as schematically illustrated in figure 7.1(d). The method of calculation of dL(r) is similar to the method of calculation of do L as it is explained below and illustrated in figure 7.2. dL(r) 3 3 2 ∆r 2 1 r 1 (a) top monolayer x z y bottom monolayer Figure 7.2: Schematic drawing to illustrate the method of calculation of dL(r), which is described in details in the text. The protein is represented by a gray cylinder. The figure shows the case when the protein is parallel to the bilayer normal (a), and the case when the protein is tilted with respect to the bilayer normal (b). For each sampled configuration, we have first calculated the circularly averaged value of the position along the bilayer normal of the tail-beads attached to the headgroup of the lipids within each circular sector k at distance r = k∆r from the protein surface, in the bottom and top monolayer separately, i.e. zt (bottom) (r), and zt (top) (r). The instantaneous value of the bilayer hydrophobic thickness at distance r from the protein surface is then given by the difference of these two values. This difference has been further averaged over the sampled configurations to give dL(r): dL(r) = 〈zt (top) (r) − zt (bottom) (r)〉, r = k∆r, ∀ k = 1, 2, 3, . . . (7.2) The bin size, ∆r, was chosen to be of the order of the diameter of the lipid-chain projected area on the bilayer plane. It is important to note that, if the protein is tilted d L (r) 3 2 r 1 3 2 1 (b)
7.2 Computational details 103 (figure 7.2b), the circular sectors at distance r from the protein surface in the top and bottom monolayer are shifted respect to each other in the bilayer plane, and the value of dL(r) calculated with the described method is an approximated value of the actual thickness in the vicinity of the tilted peptide. However, this value converges to the correct value in the bulk at distances sufficiently far from the protein. Moreover, because of the tilt, the conformation of the lipids around the protein might not be symmetric. We want to point out that these possible effects due to the asymmetry of the protein orientation in the bilayer have been averaged out. The behavior of dL(r) allowed us to access the extension of the protein-mediated perturbation on the bilayer. Based on previous theoretical finding [167], we first assumed that the perturbation induced by the protein on the surrounding lipids is of exponential type. We have then verified this assumption later by analyzing the deviation of the functional form of the calculated dL(r) from the assumed one. If the behavior of dL(r) is exponential, the protein-induced perturbation can be expressed in terms of a typical coherence length, the decay length ξP: dL(r) = d o L + (dP − d o L)e −r/ξP . (7.3) where do L is the mean hydrophobic thickness of the unperturbed pure lipid bilayer, and dP is the protein hydrophobic length. The above equation expresses the fact that away from the protein surface, and at distances at least of the order of ξP, the perturbed dL(r) decays to the bulk value do L , namely the value corresponding to that of the pure lipid system at the considered temperature, if no finite-size effects are present. In principle, by knowing dL(r), dP, and do L and by using equation 7.3 one can estimate ξP. In our case, we have determined the value of ξP by best-fitting the values dL(r) resulting from the simulations with equation 7.3, where ξP and do L are the fitting parameters. About the resulting value of the parameter do L obtained by the best-fitting, we have verified that this is equal, within the statistical accuracy, to the value of the lipid bilayer hydrophobic thickness in the bulk, and directly calculated from the simulations. Since the protein can be subjected to tilt, the input parameter we used for the fit is not the actual hydrophobic length of the model-protein, dP (or even the a priori estimate of it, dP), ˜ but instead an effective length, deff P . This effective length is defined as the projection onto the normal of the bilayer plane of the protein hydrophobic length directly obtained from the simulations: d eff P = dP cos(φ tilt ), where φ tilt is the tilt angle (see figure 7.1d). To calculate the degree of tilting of a protein with respect to the bilayer normal we have considered, for each chain of the protein, the vector that connects the position of the two hydrophobic beads bound to the protein hydrophilic beads (i.e. close to the lipid-water interface), one located in one monolayer of the bilayer, and the other in the opposite monolayer. The tilt angle, φ tilt , is defined as the average value, over all the chains of a protein, of the angle between this vector and the bilayer normal.
- Page 57 and 58: 4.4 Results and discussion 51 chain
- Page 59 and 60: 4.4 Results and discussion 53 4.4.4
- Page 61: 4.4 Results and discussion 55 headg
- Page 64 and 65: 58 Phase behavior of coarse-grained
- Page 66 and 67: 60 Phase behavior of coarse-grained
- Page 68 and 69: 62 Phase behavior of coarse-grained
- Page 70 and 71: 64 Phase behavior of coarse-grained
- Page 72 and 73: 66 Phase behavior of coarse-grained
- Page 74 and 75: 68 Phase behavior of coarse-grained
- Page 76 and 77: 70 Phase behavior of coarse-grained
- Page 78 and 79: 72 Phase behavior of coarse-grained
- Page 80 and 81: 74 Phase behavior of coarse-grained
- Page 82 and 83: 76 Phase behavior of coarse-grained
- Page 85 and 86: VI Interaction of small molecules w
- Page 87 and 88: 6.2 Computational details 81 For re
- Page 89 and 90: 6.3 Results and Discussion 83 withi
- Page 91 and 92: 6.3 Results and Discussion 85 ρ(z)
- Page 93 and 94: 6.3 Results and Discussion 87 ρ(z)
- Page 95 and 96: 6.3 Results and Discussion 89 S m 0
- Page 97 and 98: 6.3 Results and Discussion 91 π(z)
- Page 99: 6.3 Results and Discussion 93 the l
- Page 102 and 103: 96 Mesoscopic model for lipid bilay
- Page 104 and 105: 98 Mesoscopic model for lipid bilay
- Page 106 and 107: 100 Mesoscopic model for lipid bila
- Page 110 and 111: 104 Mesoscopic model for lipid bila
- Page 112 and 113: 106 Mesoscopic model for lipid bila
- Page 114 and 115: 108 Mesoscopic model for lipid bila
- Page 116 and 117: 110 Mesoscopic model for lipid bila
- Page 118 and 119: 112 Mesoscopic model for lipid bila
- Page 120 and 121: 114 Mesoscopic model for lipid bila
- Page 122 and 123: 116 Mesoscopic model for lipid bila
- Page 125 and 126: References [1] Tanford, C. Science
- Page 127 and 128: 7.4 Conclusion 121 [68] Ono, S.; Ko
- Page 129 and 130: 7.4 Conclusion 123 [139] Lee, A. Bi
- Page 131 and 132: Summary Biological membranes, as th
- Page 133 and 134: agreement we find gives us confiden
- Page 135 and 136: Samenvatting Biologische membranen,
- Page 137 and 138: de lage temperatuur gel fase of Lβ
- Page 139: ied dat het dichtst bij het hydrofo
- Page 143: This thesis is based on the followi
102 <strong>Mesoscopic</strong> model for <strong>lipid</strong> <strong>bilayers</strong> <strong>with</strong> <strong>embedded</strong> proteins<br />
lel to the xy-plane) <strong>of</strong> the tail-beads attached to the headgroup <strong>of</strong> the <strong>lipid</strong>s in one<br />
(top) monolayer, <strong>and</strong> <strong>of</strong> the <strong>lipid</strong>s in the opposite (bottom) monolayer:<br />
d o L = 〈zt (top) − zt (bottom) 〉 (7.1)<br />
where zt is the z position <strong>of</strong> the beads attached to the <strong>lipid</strong> headgroup. The over-line<br />
represents an average over the two chains for each <strong>lipid</strong> <strong>and</strong> over the total number<br />
<strong>of</strong> <strong>lipid</strong>s in each monolayer, <strong>and</strong> the brackets indicate that the difference is further<br />
averaged over the number <strong>of</strong> configurations chosen for the statistical sampling.<br />
To study the effect <strong>of</strong> a protein on the surrounding bilayer structure, we have calculated<br />
the <strong>lipid</strong> bilayer hydrophobic thickness, dL(r), as function <strong>of</strong> the radial distance<br />
r from the protein hydrophobic surface, namely from the interface <strong>with</strong> the<br />
<strong>lipid</strong> hydrocarbon chains, as schematically illustrated in figure 7.1(d). The method<br />
<strong>of</strong> calculation <strong>of</strong> dL(r) is similar to the method <strong>of</strong> calculation <strong>of</strong> do L as it is explained<br />
below <strong>and</strong> illustrated in figure 7.2.<br />
dL(r)<br />
3<br />
3<br />
2<br />
∆r<br />
2 1<br />
r<br />
1<br />
(a)<br />
top monolayer<br />
x<br />
z<br />
y<br />
bottom monolayer<br />
Figure 7.2: Schematic drawing to illustrate the method <strong>of</strong> calculation <strong>of</strong> dL(r), which is described<br />
in details in the text. The protein is represented by a gray cylinder. The figure shows<br />
the case when the protein is parallel to the bilayer normal (a), <strong>and</strong> the case when the protein<br />
is tilted <strong>with</strong> respect to the bilayer normal (b).<br />
For each sampled configuration, we have first calculated the circularly averaged<br />
value <strong>of</strong> the position along the bilayer normal <strong>of</strong> the tail-beads attached to the headgroup<br />
<strong>of</strong> the <strong>lipid</strong>s <strong>with</strong>in each circular sector k at distance r = k∆r from the protein<br />
surface, in the bottom <strong>and</strong> top monolayer separately, i.e. zt (bottom) (r), <strong>and</strong> zt (top) (r).<br />
The instantaneous value <strong>of</strong> the bilayer hydrophobic thickness at distance r from the<br />
protein surface is then given by the difference <strong>of</strong> these two values. This difference<br />
has been further averaged over the sampled configurations to give dL(r):<br />
dL(r) = 〈zt (top) (r) − zt (bottom) (r)〉, r = k∆r, ∀ k = 1, 2, 3, . . . (7.2)<br />
The bin size, ∆r, was chosen to be <strong>of</strong> the order <strong>of</strong> the diameter <strong>of</strong> the <strong>lipid</strong>-chain<br />
projected area on the bilayer plane. It is important to note that, if the protein is tilted<br />
d L<br />
(r)<br />
3<br />
2<br />
r<br />
1<br />
3<br />
2<br />
1<br />
(b)


