Review of 2008 Ten-Year Site Plans - Public Service Commission
Review of 2008 Ten-Year Site Plans - Public Service Commission
Review of 2008 Ten-Year Site Plans - Public Service Commission

You also want an ePaper? Increase the reach of your titles
YUMPU automatically turns print PDFs into web optimized ePapers that Google loves.
Firm Peak Demand (MW)<br />
58,000<br />
56,000<br />
54,000<br />
52,000<br />
50,000<br />
48,000<br />
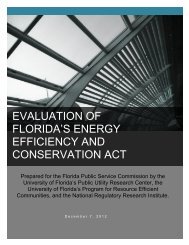
Figure 2. Summer Peak Demand Forecast<br />
46,000<br />
2007 <strong>2008</strong> 2009 2010 2011 2012 2013 2014 2015 2016 2017<br />
2007 <strong>2008</strong><br />
As seen in Figure 3 below, the reduction in summer and winter peak demand projections<br />
translates to a reduction in the utilities’ energy forecasts. Thus, a similar trend can be seen as current<br />
annual net energy for load projections are an average <strong>of</strong> nearly 6,000 GWh less than last year’s<br />
projections. Overall, Florida’s utilities project energy consumption to increase nearly 70,000 GWh<br />
over the planning period.<br />
Net Energy for Load (GWh)<br />
330,000<br />
310,000<br />
290,000<br />
270,000<br />
250,000<br />
Figure 3. Energy Demand Forecast<br />
2007 <strong>2008</strong> 2009 2010 2011 2012 2013 2014 2015 2016 2017<br />
2007 <strong>2008</strong><br />
The <strong>Commission</strong> has reviewed the historical forecast accuracy <strong>of</strong> total retail energy sales for<br />
the five-year period from 2003-2007. The <strong>Commission</strong>’s analysis, summarized in Table 3 on the<br />
following page, compared actual energy sales for each year to energy sale forecasts made three, four,<br />
<strong>Review</strong> <strong>of</strong> <strong>2008</strong> <strong>Ten</strong>-<strong>Year</strong> <strong>Site</strong> <strong>Plans</strong> - 9 -