What matters most for the sacrifice ratio? - Newcastle University
What matters most for the sacrifice ratio? - Newcastle University
What matters most for the sacrifice ratio? - Newcastle University

Create successful ePaper yourself
Turn your PDF publications into a flip-book with our unique Google optimized e-Paper software.
<strong>What</strong> <strong>matters</strong> <strong>most</strong> <strong>for</strong> <strong>the</strong> <strong>sacrifice</strong> <strong>ratio</strong>?<br />
Lynne Evans a and Anamaria Nicolae b<br />
a <strong>Newcastle</strong> <strong>University</strong> Business School, NE1 7RU, <strong>Newcastle</strong> upon Tyne, UK.<br />
b Department of Economics, Durham <strong>University</strong>, Durham DH1 3HY, UK.<br />
May 2012<br />
No 2012/01<br />
<strong>Newcastle</strong> Discussion Papers in<br />
Economics: ISSN 1361 - 1837
<strong>What</strong> <strong>matters</strong> <strong>most</strong> <strong>for</strong> <strong>the</strong> <strong>sacrifice</strong> <strong>ratio</strong>?<br />
Lynne Evans a Anamaria Nicolae b<br />
March 2012<br />
a Corresponding Author.<br />
<strong>Newcastle</strong> <strong>University</strong> Business School, 5 Barrack Road, <strong>Newcastle</strong> upon Tyne NE1 4SE, UK<br />
Lynne.Evans@ncl.ac.uk Tel: +44 (0)191 208 1701<br />
b Department of Economics, Durham <strong>University</strong>, 23-6 Old Elvet, Durham DH1 3HY, UK.<br />
Anamaria.Nicolae@durham.ac.uk Tel: +44(0)191 334 6358<br />
Abstract<br />
Despite its having high policy relevance, and despite extensive empirical work, little is<br />
known about <strong>the</strong> relative impact of <strong>the</strong> main drivers of <strong>the</strong> <strong>sacrifice</strong> <strong>ratio</strong>: initial inflation,<br />
speed of disinflation and imperfect credibility. To shed some light on this important matter,<br />
we employ a New Keynesian DSGE model with imperfect credibility to analyse modelgenerated<br />
<strong>sacrifice</strong> <strong>ratio</strong>s and <strong>the</strong> quantitative relevance of <strong>the</strong>ir main drivers. First, we show<br />
that <strong>the</strong> model can account <strong>for</strong> <strong>the</strong> output <strong>sacrifice</strong> of both <strong>the</strong> Thatcher and Volcker<br />
disinflations. Second, we find that 75% of <strong>the</strong> <strong>sacrifice</strong> <strong>ratio</strong> is attributable to <strong>the</strong> initial<br />
inflation rate, 14% to <strong>the</strong> initial lack of credibility and 11% to <strong>the</strong> speed of disinflation.<br />
Keywords<br />
Sacrifice <strong>ratio</strong>; Imperfect credibility; Disinflation speed.<br />
JEL classification<br />
E31; E5
1. Introduction<br />
There is general consensus that <strong>sacrifice</strong>s in output are needed to reduce inflation. These<br />
<strong>sacrifice</strong>s are captured in <strong>the</strong> short-run output response to a disinflation and are <strong>the</strong> focus of<br />
extensive empirical literature on <strong>the</strong> <strong>sacrifice</strong> <strong>ratio</strong> (<strong>the</strong> cumulative percentage output loss per<br />
inflation point decline). However, despite this substantive empirical work, <strong>the</strong>re is no<br />
consensus on <strong>the</strong> size of <strong>the</strong> <strong>sacrifice</strong> <strong>ratio</strong> even <strong>for</strong> a single disinflation in one country and<br />
certainly not across countries. For example, estimates of <strong>the</strong> <strong>sacrifice</strong> <strong>ratio</strong> <strong>for</strong> <strong>the</strong> famous<br />
Volcker disinflation range from around 1.8 (Ball, 1994a) to 2.8 (Zhang, 2005); and, <strong>for</strong><br />
episodes across all G7 countries, Zhang’s study reports estimates of 0.2 (1970s, Japan) up to<br />
11.9 (1990s, France).<br />
That estimates of <strong>the</strong> <strong>sacrifice</strong> <strong>ratio</strong> vary is not surprising. In part, this reflects <strong>the</strong> application<br />
of different empirical approaches, but, more importantly, it reflects episode specifics. It is<br />
well understood that <strong>the</strong> cost of a disinflation depends on <strong>the</strong> credibility of <strong>the</strong> disinflation<br />
policy, <strong>the</strong> speed of <strong>the</strong> disinflation and <strong>the</strong> size of <strong>the</strong> initial inflation; yet <strong>the</strong> empirical<br />
literature provides little in<strong>for</strong>mation on <strong>the</strong> relative importance of <strong>the</strong>se <strong>matters</strong>. Economists<br />
continue to puzzle over what <strong>matters</strong> <strong>most</strong>. The high policy relevance of <strong>the</strong> issue ensures<br />
that work continues; however, <strong>the</strong>re are many intractable challenges <strong>for</strong> <strong>the</strong> empirical<br />
estimation work. Among <strong>the</strong>se are <strong>the</strong> fundamental problems of identification, <strong>the</strong> extent to<br />
which it is appropriate to treat disinflation as exogenous, and measuring <strong>the</strong> cumulative<br />
output loss. Against this background, a <strong>the</strong>oretical approach – which permits control over <strong>the</strong><br />
specification of <strong>the</strong> disinflation – has obvious appeal.<br />
The aim of this paper is to quantitatively assess <strong>the</strong> importance of different characteristics of<br />
a disinflation in determining <strong>the</strong> size of <strong>the</strong> <strong>sacrifice</strong> <strong>ratio</strong>. We use a <strong>the</strong>oretical framework<br />
and run numerous disinflation experiments, each defined by <strong>the</strong> specific characteristics of<br />
speed of disinflation, initial inflation, and degree of imperfect credibility. We calculate <strong>the</strong><br />
<strong>sacrifice</strong> <strong>ratio</strong> <strong>for</strong> each experiment and use <strong>the</strong>se model-generated <strong>sacrifice</strong> <strong>ratio</strong>s to extract<br />
<strong>the</strong> relative impact of each characteristic.<br />
The framework we choose is a New Keynesian DSGE model with sticky prices, monopolistic<br />
competition and imperfect credibility (Nicolae and Nolan, 2006; hence<strong>for</strong>th, NN). The model<br />
nests a ground-breaking model which reconciles opposing views on disinflation speed by<br />
combining both state-dependent and time-dependent pricing strategies (Ireland, 1997).<br />
The model has a number of o<strong>the</strong>r highly desirable features. Firstly, it allows policymakers to<br />
choose <strong>the</strong> speed of <strong>the</strong> disinflation, announce <strong>the</strong>ir monetarist disinflation policy, and<br />
unwaveringly implement it. Secondly, <strong>the</strong> setup allows <strong>for</strong> temporary imperfect credibility in<br />
that agents take time to fully believe <strong>the</strong> announced policy, having started from different<br />
degrees of initial credibility. Thirdly, <strong>the</strong> model is solved using a nonlinear method. (Ascari<br />
and Merkl, 2009 have shown that taking <strong>the</strong> non-linearities into account has important<br />
qualitative and quantitative implications when studying disinflations.)
2. Model Per<strong>for</strong>mance<br />
It is well known that New Keynesian DSGE models assuming perfect <strong>for</strong>esight are largely<br />
unsuccessful in replicating a costly disinflation, and that implementing imperfect credibility<br />
in those models may correct this shortcoming. 1 First, we establish that <strong>the</strong> imperfect<br />
credibility model employed here explains <strong>the</strong> output gap experienced during two famous<br />
disinflation episodes: those of Thatcher and Volcker. These two episodes were attempts to<br />
put ‘monetarism’ into practice in <strong>the</strong> early 1980s. Broadly speaking, UK inflation fell from<br />
15% to 3% and US inflation from 10% to 4%. Both countries experienced a deep economic<br />
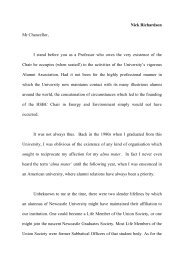
recession. Figures 1 and 2 show <strong>the</strong> OECD output gap (<strong>the</strong> solid line) alongside <strong>the</strong> model<br />
output gap and reveal <strong>the</strong> model’s ability to replicate <strong>the</strong> output <strong>sacrifice</strong> in <strong>the</strong>se two<br />
monetarist experiments. 2<br />
The model calib<strong>ratio</strong>n is as in NN. To back out <strong>the</strong> model output gap <strong>for</strong> each disinflation<br />
episode, we have used UK and US OECD data to calibrate <strong>the</strong> learning process. The modelcalculated<br />
<strong>sacrifice</strong> <strong>ratio</strong> 3<br />
<strong>for</strong> <strong>the</strong> Thatcher disinflation is 1.9 and <strong>for</strong> Volcker 1.8, both values<br />
within <strong>the</strong> range of estimates in <strong>the</strong> empirical literature.<br />
1<br />
0<br />
-1<br />
-2<br />
-3<br />
-4<br />
-5<br />
-6<br />
-7<br />
1979 1980 1981 1982 1983 1984 1985 1986 1987<br />
OECD Output Gap Model Output Gap<br />
Figure 1. Thatcher Disinflation: OECD and Model Output Gaps.<br />
1 See <strong>the</strong> extensive literature stemming from Ball (1994b).<br />
2 Both of <strong>the</strong>se disinflations pre-date explicit inflation targeting. At <strong>the</strong> time, <strong>the</strong> focus was on<br />
reducing inflation to ‘a low level’. Here, we assume a target of 1% (2%) was in place<br />
(reflecting average UK (US) inflation of <strong>the</strong> late 1950s). We use <strong>the</strong> currency component of<br />
M1 from 1979 until 1986 (1984) as <strong>the</strong> path <strong>for</strong> <strong>the</strong> UK (US) money stock during <strong>the</strong><br />
disinflation.<br />
3 We define <strong>the</strong> <strong>sacrifice</strong> <strong>ratio</strong> as per Ball (1994a) – see Section 3 below.
1<br />
0<br />
-1<br />
-2<br />
-3<br />
-4<br />
-5<br />
-6<br />
1979 1980 1981 1982 1983 1984 1985 1986 1987<br />
Figure 2. Volcker Disinflation: OECD and Model Output Gaps.<br />
3. Sacrifice Ratios<br />
OECD Output Gap Model Output Gap<br />
Next, to explore <strong>the</strong> impact of different disinflation characteristics on <strong>the</strong> cost of a<br />
disinflation, we use <strong>the</strong> model to calculate <strong>sacrifice</strong> <strong>ratio</strong>s <strong>for</strong> numerous disinflation<br />
experiments. 4<br />
Each experiment specifies particular characteristics of a disinflation: <strong>the</strong> initial rate of<br />
inflation (a range of initial (low) inflation rates up to 7%); <strong>the</strong> speed of disinflation<br />
(immediate and, at half-year intervals, up to a five-year gradual disinflation); and <strong>the</strong> degree<br />
5<br />
of initial credibility (full credibility, high, medium, low, absolute lack of credibility).<br />
We define <strong>the</strong> <strong>sacrifice</strong> <strong>ratio</strong> as in Ball (1994a, p. 160):<br />
SR = 1/(π
wider range of initial inflation rates considered in this paper. A three-year gradual disinflation<br />
is representative of a gradual disinflation in this literature, although many <strong>the</strong>oretical studies<br />
only consider immediate disinflations. 6<br />
Table 1. Model <strong>sacrifice</strong> <strong>ratio</strong>s <strong>for</strong> immediate and gradual (three-year) disinflation<br />
from 3%, 4% and 5% initial inflation.<br />
Length of disinflation Degree of initial credibility<br />
Initial<br />
inflation<br />
3% 4%<br />
Immediate Full credibility (0) 0.777 0.742 0.715<br />
Gradual<br />
(three-year)<br />
High (0.3) 0.937 0.901 0.870<br />
Medium (0.5) 1.037 0.998 0.966<br />
Low (0.7) 1.130 1.087 1.053<br />
Absolute lack of credibility (1) 1.260 1.210 1.165<br />
5%<br />
Full credibility (0) 0.071 0.069 0.067<br />
High (0.3) 0.083 0.082 0.080<br />
Medium (0.5) 0.106 0.103 0.100<br />
Low (0.7) 0.172 0.154 0.138<br />
Absolute lack of credibility (1) 0.286 0.259 0.237<br />
Table 1 shows <strong>sacrifice</strong> <strong>ratio</strong>s that are (consistently) higher, <strong>the</strong> lower is initial inflation: <strong>the</strong><br />
overall size of <strong>the</strong> disinflation <strong>matters</strong> (as in Zhang, 2005). Each inflation point decline is<br />
much more costly as inflation nears target, whe<strong>the</strong>r disinflation is immediate or gradual; and<br />
‘cold-turkey’ is always <strong>the</strong> more costly. Unsurprisingly, <strong>the</strong> more agents believe <strong>the</strong> policy at<br />
<strong>the</strong> outset (<strong>the</strong> higher <strong>the</strong> degree of initial credibility), <strong>the</strong> less costly is <strong>the</strong> disinflation.<br />
Perhaps more interesting than <strong>the</strong>se qualitative observations, is <strong>the</strong> quantitative. For<br />
example, <strong>the</strong> <strong>sacrifice</strong> <strong>ratio</strong> is as much as 11% higher when gradually disinflating from 3%<br />
than when disinflating from 4%. However, while <strong>the</strong>se tabled results convey some<br />
in<strong>for</strong>mation about <strong>the</strong> impact of different characteristics on <strong>the</strong> cost of a disinflation, <strong>the</strong>re is<br />
more we can learn from <strong>the</strong> systematic explo<strong>ratio</strong>n of our model-generated <strong>sacrifice</strong> <strong>ratio</strong>s.<br />
The experiment reveals that of <strong>the</strong> three disinflation characteristics specified, it is <strong>the</strong> initial<br />
inflation rate that has by far <strong>the</strong> <strong>most</strong> impact on <strong>the</strong> size of <strong>the</strong> <strong>sacrifice</strong> <strong>ratio</strong>, contributing<br />
6 The analysis of gradual disinflation experiments is warranted since, according to Ireland,<br />
(1997) and Nicolae and Nolan (2006), gradual disinflation is preferable when initial inflation<br />
is small. In our setup, policymakers are allowed to choose <strong>the</strong> speed at which <strong>the</strong>y disinflate.
approximately 75% to it. The next biggest contributor is imperfect credibility, making a 14%<br />
contribution while <strong>the</strong> speed of <strong>the</strong> disinflation makes a relatively modest 11% contribution.<br />
Certainly, lack of credibility makes a difference to <strong>the</strong> real effects of a disinflation, as does<br />
<strong>the</strong> gradualness of <strong>the</strong> disinflation; however, what really <strong>matters</strong> is <strong>the</strong> monetary authority’s<br />
resolve to disinflate. In all experiments here, <strong>the</strong> authorities are resolute in <strong>the</strong><br />
implementation of <strong>the</strong>ir monetarist disinflation and <strong>the</strong> real effects captured in <strong>the</strong> <strong>sacrifice</strong><br />
<strong>ratio</strong>s are predominantly attributable to this contractionary monetary policy action.<br />
This result is not insignificant. The scale of <strong>the</strong> task facing policymakers, measured by <strong>the</strong><br />
deviation of initial inflation from target, <strong>matters</strong> far more than <strong>the</strong> speed at which <strong>the</strong>y<br />
disinflate; and this is <strong>the</strong> case however much <strong>the</strong> disinflation policy announcement is<br />
believed. For policymakers wanting to minimise <strong>the</strong> cost of disinflation, <strong>the</strong> <strong>the</strong>oretical<br />
framework employed in this paper can be used to provide valuable policy guidance. Given<br />
<strong>the</strong> initial inflation and <strong>the</strong> level of credibility, policymakers could infer <strong>the</strong> extent to which a<br />
desired speed of disinflation – <strong>the</strong> only policy variable available here – could reduce <strong>the</strong> cost<br />
of <strong>the</strong> disinflation.<br />
4. Conclusion<br />
This paper uses a New Keynesian DSGE model with imperfect credibility which is shown to<br />
quantitatively account <strong>for</strong> <strong>the</strong> output <strong>sacrifice</strong> in both <strong>the</strong> Thatcher and Volcker disinflations.<br />
The model is employed to conduct a number of disinflation experiments with <strong>the</strong> objective of<br />
learning about <strong>the</strong> relative importance of different factors that drive <strong>the</strong> <strong>sacrifice</strong> <strong>ratio</strong> – a<br />
matter of high policy relevance, yet about which little is known. We find that, <strong>for</strong> <strong>the</strong> range of<br />
inflation rates considered here, what <strong>matters</strong> <strong>most</strong> <strong>for</strong> <strong>the</strong> <strong>sacrifice</strong> <strong>ratio</strong> is <strong>the</strong> scale of <strong>the</strong><br />
disinflation, followed by <strong>the</strong> degree of credibility and <strong>the</strong> speed of disinflation.<br />
References<br />
Ascari, G., Merkl C., 2009. Real wage rigidities and <strong>the</strong> cost of disinflations. Journal of<br />
Money Credit and Banking. 41, 417-435.<br />
Ascari,G., Ropele T., 2012 <strong>for</strong>thcoming. Sacrifice <strong>ratio</strong> in a medium-scale New Keynesian<br />
model. Journal of Money Credit and Banking.<br />
Ball, L., 1994a. <strong>What</strong> determines <strong>the</strong> <strong>sacrifice</strong> <strong>ratio</strong>?, in: Mankiw, N.G. (Ed.), Monetary<br />
Policy. NBER, Chicago, pp. 155-182.<br />
Ball, L., 1994b. Credible disinflation with staggered price-setting. American Economic<br />
Review. 84, 282-289.<br />
Ireland, P., 1997. Stopping inflations, big and small. Journal of Money, Credit and Banking.<br />
29, 759-775.
Nicolae, A., Nolan, C., 2006. The impact of imperfect credibility in a transition to price<br />
stability. Journal of Money, Credit and Banking. 38, 47-66.<br />
Zhang, L. H., 2005. Sacrifice <strong>ratio</strong>s with long-lived effects. International Finance. 8, 231-<br />
262.