The GNSS integer ambiguities: estimation and validation
The GNSS integer ambiguities: estimation and validation
The GNSS integer ambiguities: estimation and validation

You also want an ePaper? Increase the reach of your titles
YUMPU automatically turns print PDFs into web optimized ePapers that Google loves.
success rate<br />
percentage identical<br />
0.7<br />
0.6<br />
0.5<br />
0.4<br />
0.3<br />
0.2<br />
0.1<br />
0<br />
0 0.005 0.01 0.015 0.02 0.025 0.03 0.035 0.04 0.045 0.05<br />
fail rate<br />
1<br />
0.99<br />
0.98<br />
0.97<br />
0.96<br />
0.95<br />
0.94<br />
0.93<br />
0.92<br />
0.91<br />
DTIA<br />
RTIA<br />
OIA<br />
IALS<br />
EIA<br />
0.9<br />
0 0.005 0.01 0.015 0.02 0.025 0.03 0.035 0.04 0.045 0.05<br />
fail rate<br />
success rate<br />
percentage identical<br />
0.12<br />
0.1<br />
0.08<br />
0.06<br />
0.04<br />
0.02<br />
0<br />
0 0.005 0.01 0.015 0.02 0.025<br />
fail rate<br />
0.03 0.035 0.04 0.045 0.05<br />
1<br />
0.99<br />
0.98<br />
0.97<br />
0.96<br />
0.95<br />
0.94<br />
0.93<br />
0.92<br />
0.91<br />
DTIA<br />
RTIA<br />
OIA<br />
IALS<br />
EIA<br />
0.9<br />
0 0.005 0.01 0.015 0.02 0.025<br />
fail rate<br />
0.03 0.035 0.04 0.045 0.05<br />
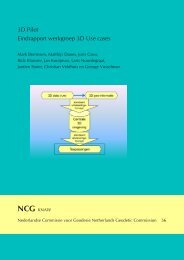
Figure 5.19: Top: Success rate as function of the fail rate; Bottom: percentages of solutions<br />
identical to OIA. Left: example 06 01. Right: example 06 02.<br />
quite well. <strong>The</strong> EIA estimator only performs well for examples 06 01 <strong>and</strong> 06 02. <strong>The</strong><br />
performance of the F -RTIA estimator seems to be much worse than the performance of<br />
the other estimators. <strong>The</strong> reason is that the F -RTIA estimator does not only consider<br />
the ambiguity residuals, but also the residuals of the float solution, so that the aperture<br />
space is not n-dimensional, but (m − p)-dimensional.<br />
Figures 5.19 <strong>and</strong> 5.20 show the success rates as function of the fail rate for those IA<br />
estimators that perform reasonably well; only low fail rates are considered. DTIA, RTIA<br />
<strong>and</strong> IALS <strong>estimation</strong> perform well for all examples: the success rates are almost equal<br />
to the OIA success rate, <strong>and</strong> the percentage of solutions identical to the OIA solution<br />
is high. For examples 06 01 <strong>and</strong> 06 02 the RTIA estimator performs best after OIA<br />
<strong>estimation</strong>; for examples 10 01 <strong>and</strong> 10 03 the DTIA estimator performs better than<br />
RTIA <strong>estimation</strong>. EIA <strong>estimation</strong> only performs well for example 06 02.<br />
Until now the performance of the IA estimators is solely based on the ambiguity success<br />
rates <strong>and</strong> fail rates. Of course, a user is more interested in the probability that the<br />
baseline estimate will be within a certain distance from the true baseline:<br />
P ( ˙ b − b 2 Q˙ b ≤ ɛ) (5.60)<br />
where ˙ b is either the float, fixed, or IA baseline estimator. <strong>The</strong> vc-matrices Qˇ b <strong>and</strong> Q¯ b<br />
can be determined from the estimates corresponding to the simulated float <strong>ambiguities</strong>.<br />
<strong>The</strong>se probabilities are difficult to interpret, but will be considered for completeness,<br />
because they tell something about the distributional properties of the baseline estimators.<br />
Comparison of the different IA estimators 121