AS PREMIA FOODS
AS PREMIA FOODS
AS PREMIA FOODS

Create successful ePaper yourself
Turn your PDF publications into a flip-book with our unique Google optimized e-Paper software.
<strong>AS</strong> <strong>PREMIA</strong> <strong>FOODS</strong> Consolidated Unaudited Interim Report for 4 th quarter and 12 months of 2012<br />
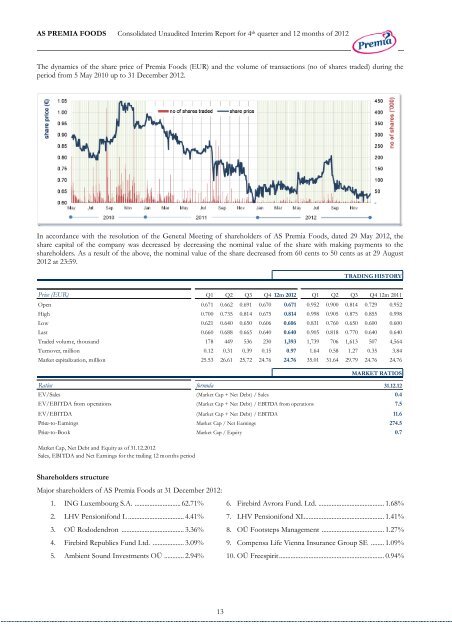
The dynamics of the share price of Premia Foods (EUR) and the volume of transactions (no of shares traded) during the<br />
period from 5 May 2010 up to 31 December 2012.<br />
In accordance with the resolution of the General Meeting of shareholders of <strong>AS</strong> Premia Foods, dated 29 May 2012, the<br />
share capital of the company was decreased by decreasing the nominal value of the share with making payments to the<br />
shareholders. As a result of the above, the nominal value of the share decreased from 60 cents to 50 cents as at 29 August<br />
2012 at 23:59.<br />
Shareholders structure<br />
Major shareholders of <strong>AS</strong> Premia Foods at 31 December 2012:<br />
1. ING Luxembourg S.A. ............................ 62.71%<br />
2. LHV Pensionifond L .................................. 4.41%<br />
3. OÜ Rododendron ...................................... 3.36%<br />
4. Firebird Republics Fund Ltd. ................... 3.09%<br />
5. Ambient Sound Investments OÜ ............ 2.94%<br />
13<br />
TRADING HISTORY<br />
Price (EUR) Q1 Q2 Q3 Q4 12m 2012 Q1 Q2 Q3 Q4 12m 2011<br />
Open 0.671 0.662 0.691 0.670 0.671 0.952 0.900 0.814 0.729 0.952<br />
High 0.700 0.735 0.814 0.675 0.814 0.998 0.905 0.875 0.855 0.998<br />
Low 0.621 0.640 0.650 0.606 0.606 0.831 0.760 0.650 0.600 0.600<br />
Last 0.660 0.688 0.665 0.640 0.640 0.905 0.818 0.770 0.640 0.640<br />
Traded volume, thousand 178 449 536 230 1,393 1,739 706 1,613 507 4,564<br />
Turnover, million 0.12 0.31 0.39 0.15 0.97 1.64 0.58 1.27 0.35 3.84<br />
Market capitalization, million 25.53 26.61 25.72 24.76 24.76 35.01 31.64 29.79 24.76 24.76<br />
MARKET RATIOS<br />
Ratios formula 31.12.12<br />
EV/Sales (Market Cap + Net Debt) / Sales 0.4<br />
EV/EBITDA from operations (Market Cap + Net Debt) / EBITDA from operations 7.5<br />
EV/EBITDA (Market Cap + Net Debt) / EBITDA 11.6<br />
Price-to-Earnings Market Cap / Net Earnings 274.5<br />
Price-to-Book Market Cap / Equity 0.7<br />
Market Cap, Net Debt and Equity as of 31.12.2012<br />
Sales, EBITDA and Net Earnings for the trailing 12 months period<br />
6. Firebird Avrora Fund. Ltd. ........................................ 1.68%<br />
7. LHV Pensionifond XL ................................................ 1.41%<br />
8. OÜ Footsteps Management ...................................... 1.27%<br />
9. Compensa Life Vienna Insurance Group SE ........ 1.09%<br />
10. OÜ Freespirit ................................................................ 0.94%