AS PREMIA FOODS
AS PREMIA FOODS
AS PREMIA FOODS

You also want an ePaper? Increase the reach of your titles
YUMPU automatically turns print PDFs into web optimized ePapers that Google loves.
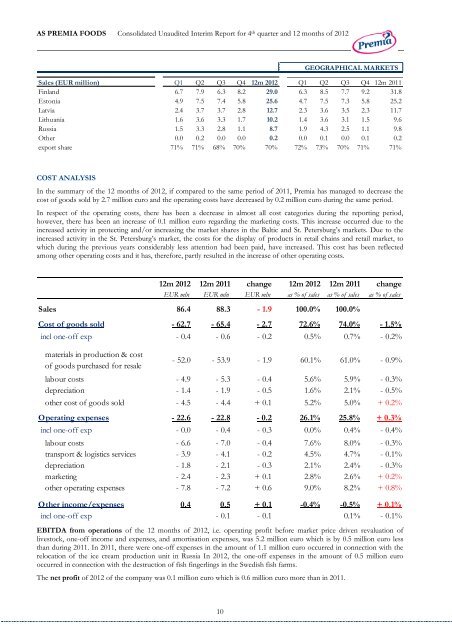
<strong>AS</strong> <strong>PREMIA</strong> <strong>FOODS</strong> Consolidated Unaudited Interim Report for 4 th quarter and 12 months of 2012<br />
COST ANALYSIS<br />
In the summary of the 12 months of 2012, if compared to the same period of 2011, Premia has managed to decrease the<br />
cost of goods sold by 2.7 million euro and the operating costs have decreased by 0.2 million euro during the same period.<br />
In respect of the operating costs, there has been a decrease in almost all cost categories during the reporting period,<br />
however, there has been an increase of 0.1 million euro regarding the marketing costs. This increase occurred due to the<br />
increased activity in protecting and/or increasing the market shares in the Baltic and St. Petersburg’s markets. Due to the<br />
increased activity in the St. Petersburg’s market, the costs for the display of products in retail chains and retail market, to<br />
which during the previous years considerably less attention had been paid, have increased. This cost has been reflected<br />
among other operating costs and it has, therefore, partly resulted in the increase of other operating costs.<br />
EBITDA from operations of the 12 months of 2012, i.e. operating profit before market price driven revaluation of<br />
livestock, one-off income and expenses, and amortisation expenses, was 5.2 million euro which is by 0.5 million euro less<br />
than during 2011. In 2011, there were one-off expenses in the amount of 1.1 million euro occurred in connection with the<br />
relocation of the ice cream production unit in Russia In 2012, the one-off expenses in the amount of 0.5 million euro<br />
occurred in connection with the destruction of fish fingerlings in the Swedish fish farms.<br />
The net profit of 2012 of the company was 0.1 million euro which is 0.6 million euro more than in 2011.<br />
10<br />
GEOGRAPHICAL MARKETS<br />
Sales (EUR million) Q1 Q2 Q3 Q4 12m 2012 Q1 Q2 Q3 Q4 12m 2011<br />
Finland 6.7 7.9 6.3 8.2 29.0 6.3 8.5 7.7 9.2 31.8<br />
Estonia 4.9 7.5 7.4 5.8 25.6 4.7 7.5 7.3 5.8 25.2<br />
Latvia 2.4 3.7 3.7 2.8 12.7 2.3 3.6 3.5 2.3 11.7<br />
Lithuania 1.6 3.6 3.3 1.7 10.2 1.4 3.6 3.1 1.5 9.6<br />
Russia 1.5 3.3 2.8 1.1 8.7 1.9 4.3 2.5 1.1 9.8<br />
Other 0.0 0.2 0.0 0.0 0.2 0.0 0.1 0.0 0.1 0.2<br />
export share 71% 71% 68% 70% 70% 72% 73% 70% 71% 71%<br />
12m 2012 12m 2011 change 12m 2012 12m 2011 change<br />
EUR mln EUR mln EUR mln as % of sales as % of sales as % of sales<br />
Sales 86.4 88.3 - 1.9 100.0% 100.0%<br />
Cost of goods sold - 62.7 - 65.4 - 2.7 72.6% 74.0% - 1.5%<br />
incl one-off exp - 0.4 - 0.6 - 0.2 0.5% 0.7% - 0.2%<br />
materials in production & cost<br />
of goods purchased for resale<br />
- 52.0 - 53.9 - 1.9 60.1% 61.0% - 0.9%<br />
labour costs - 4.9 - 5.3 - 0.4 5.6% 5.9% - 0.3%<br />
depreciation - 1.4 - 1.9 - 0.5 1.6% 2.1% - 0.5%<br />
other cost of goods sold - 4.5 - 4.4 + 0.1 5.2% 5.0% + 0.2%<br />
Operating expenses - 22.6 - 22.8 - 0.2 26.1% 25.8% + 0.3%<br />
incl one-off exp - 0.0 - 0.4 - 0.3 0.0% 0.4% - 0.4%<br />
labour costs - 6.6 - 7.0 - 0.4 7.6% 8.0% - 0.3%<br />
transport & logistics services - 3.9 - 4.1 - 0.2 4.5% 4.7% - 0.1%<br />
depreciation - 1.8 - 2.1 - 0.3 2.1% 2.4% - 0.3%<br />
marketing - 2.4 - 2.3 + 0.1 2.8% 2.6% + 0.2%<br />
other operating expenses - 7.8 - 7.2 + 0.6 9.0% 8.2% + 0.8%<br />
Other income/expenses 0.4 0.5 + 0.1 -0.4% -0.5% + 0.1%<br />
incl one-off exp - 0.1 - 0.1 0.1% - 0.1%