Dominican Republic (1,300 MT), were partially offset by decreases for unknown destinati<strong>on</strong>s (11,200 MT). Net sales of 424,700 MT for delivery in the 2012/2013 marketing year were primarily for South Korea (140,000 MT), unknown destinati<strong>on</strong>s (78,300 MT), the Philippines (49,100 MT), and Colombia (48,200 MT). Exports of 114,900 MT were down 49 percent <strong>from</strong> the previous week and 22 percent <strong>from</strong> the prior 4-week average. The primary destinati<strong>on</strong>s were Ecuador (35,100 MT), Morocco (15,900 MT), H<strong>on</strong>duras (14,900 MT), and Canada (14,000 MT). Soybean Oil: Net sales of 1,200 MT for the 2011/2012 marketing year were down 78 percent <strong>from</strong> the previous week and 92 percent <strong>from</strong> the prior 4-week average. Increases were reported for Canada (700 MT) and Mexico (400 MT). Net sales of 14,900 MT for delivery in the 2012/2013 marketing year were reported for Canada (14,500 MT) and Mexico (300 MT). Exports of 4,000 MT were down 54 percent <strong>from</strong> the previous week and 79 percent <strong>from</strong> the prior 4-week average. The primary destinati<strong>on</strong>s were Mexico (2,700 MT) and Canada (1,100 MT). Cott<strong>on</strong>: Net Upland sales of 130,500 running bales for the 2012/2013 marketing year were primarily for China (54,900 RB), Turkey (32,300 RB), Mexico (25,100 RB), Ind<strong>on</strong>esia (7,000 RB, including 900 RB switched <strong>from</strong> Japan), South Korea (6,400 RB), and Peru (6,100 RB). Decreases were reported for India (4,400 RB), Bangladesh (3,500 RB), and Thailand (2,100 RB). Net sales of 11,300 RB for delivery in 2013/2014 resulted as increases for Mexico (23,000 RB) and Turkey (19,800 RB), were partially offset by decreases for Thailand (31,500 RB). Exports of 151,600 RB were primarily to China (72,600 RB), Mexico (15,000 RB), Turkey (10,200 RB), and Taiwan (9,800 RB). Net American Pima sales of 3,300 RB resulted as increases for China (3,800 RB), Pak<str<strong>on</strong>g>is</str<strong>on</strong>g>tan (900 RB), Thailand (500 RB), Switzerland (400 RB), and Mexico (400 RB), were partially offset by decreases for India (1,900 RB) and H<strong>on</strong>duras (1,400 RB). Exports of 11,700 RB were primarily to China (3,900 RB), Pak<str<strong>on</strong>g>is</str<strong>on</strong>g>tan (3,200 RB), India (1,600 RB), and Germany (700 RB). Opti<strong>on</strong>al Origin Sales: For MY 2012/2013, opti<strong>on</strong>s were exerc<str<strong>on</strong>g>is</str<strong>on</strong>g>ed to export upland cott<strong>on</strong> <strong>from</strong> the United States to Ind<strong>on</strong>esia (500 RB) and South Korea (300 RB). Outstanding opti<strong>on</strong>al origin sales total 412,600 RB, and are for China (343,500 RB), South Korea (22,800 RB), Vietnam (19,400 RB), Turkey (17,600 RB), and Thailand (9,300 RB). Exports for Own Account: Exports for own account to China (900 RB) were applied to new or outstanding sales. The current exports for own account balance <str<strong>on</strong>g>is</str<strong>on</strong>g> 79,900 RB, all China. Hides and Skins: Net sales of 453,900 pieces were reported for delivery in the 2012 marketing year, up 4 percent <strong>from</strong> the previous week and unchanged <strong>from</strong> the prior 4week average. Whole cattle hides sales of 453,300 pieces were primarily for China (190,200 pieces, including 6,200 pieces switched <strong>from</strong> H<strong>on</strong>g K<strong>on</strong>g and decreases of 1,800 pieces), South Korea (181,300 pieces), Taiwan (27,500 pieces), Mexico (18,400 pieces), and Italy (12,500 pieces). Exports of 471,500 pieces were down 11 percent <strong>from</strong> the previous week, but up 7 percent <strong>from</strong> the prior 4-week average. Whole cattle hides exports were primarily to China (239,800 pieces), South Korea (126,000 pieces), Taiwan (38,400 pieces), Mexico (25,400 pieces), and Thailand (9,000 pieces). Net sales of 165,800 wet blues for delivery in the 2012 marketing year were primarily for Italy (85,600 unsplit), China (43,900 unsplit and 3,600 grain splits), the Dominican Republic (12,000 unsplit and 2,400 grain splits), and Mexico (11,400 grain splits). Decreases were report for El Salvador (1,400 unsplit). Exports of 145,900 wet blues were primarily to Italy (47,600 unsplit), China (40,700 unsplit and 1,800 grain splits), and Mexico (18,800 grain splits and 1,000 unsplit). Net sales of splits totaling 4,136,600 pounds were mainly for South Korea (3,822,500 pounds), Italy
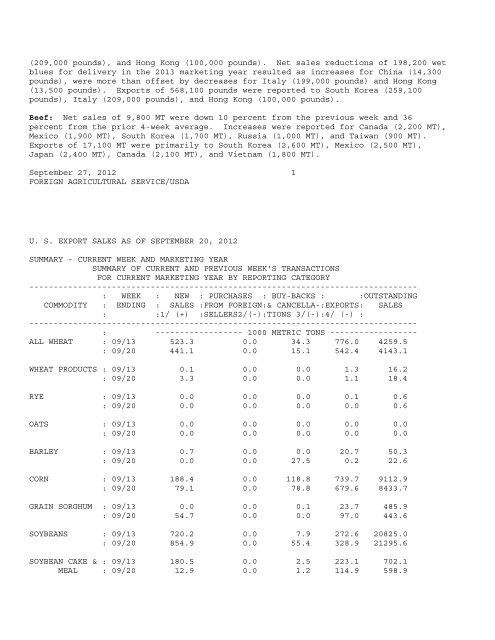
(209,000 pounds), and H<strong>on</strong>g K<strong>on</strong>g (100,000 pounds). Net sales reducti<strong>on</strong>s of 198,200 wet blues for delivery in the 2013 marketing year resulted as increases for China (14,300 pounds), were more than offset by decreases for Italy (199,000 pounds) and H<strong>on</strong>g K<strong>on</strong>g (13,500 pounds). Exports of 568,100 pounds were reported to South Korea (259,100 pounds), Italy (209,000 pounds), and H<strong>on</strong>g K<strong>on</strong>g (100,000 pounds). Beef: Net sales of 9,800 MT were down 10 percent <strong>from</strong> the previous week and 36 percent <strong>from</strong> the prior 4-week average. Increases were reported for Canada (2,200 MT), Mexico (1,900 MT), South Korea (1,700 MT), Russia (1,000 MT), and Taiwan (900 MT). Exports of 17,100 MT were primarily to South Korea (2,600 MT), Mexico (2,500 MT), Japan (2,400 MT), Canada (2,100 MT), and Vietnam (1,800 MT). September 27, 2012 1 FOREIGN AGRICULTURAL SERVICE/USDA U. S. EXPORT SALES AS OF SEPTEMBER 20, 2012 SUMMARY - CURRENT WEEK AND MARKETING YEAR SUMMARY OF CURRENT AND PREVIOUS WEEK'S TRANSACTIONS FOR CURRENT MARKETING YEAR BY REPORTING CATEGORY -------------------------------------------------------------------------------- : WEEK : NEW : PURCHASES : BUY-BACKS : :OUTSTANDING COMMODITY : ENDING : SALES :FROM FOREIGN:& CANCELLA-:EXPORTS: SALES : :1/ (+) :SELLERS2/(-):TIONS 3/(-):4/ (-) : -------------------------------------------------------------------------------- : ------------------ 1000 METRIC TONS ------------------ ALL WHEAT : 09/13 523.3 0.0 34.3 776.0 4259.5 : 09/20 441.1 0.0 15.1 542.4 4143.1 WHEAT PRODUCTS : 09/13 0.1 0.0 0.0 1.3 16.2 : 09/20 3.3 0.0 0.0 1.1 18.4 RYE : 09/13 0.0 0.0 0.0 0.1 0.6 : 09/20 0.0 0.0 0.0 0.0 0.6 OATS : 09/13 0.0 0.0 0.0 0.0 0.0 : 09/20 0.0 0.0 0.0 0.0 0.0 BARLEY : 09/13 0.7 0.0 0.0 20.7 50.3 : 09/20 0.0 0.0 27.5 0.2 22.6 CORN : 09/13 188.4 0.0 118.8 739.7 9112.9 : 09/20 79.1 0.0 78.8 679.6 8433.7 GRAIN SORGHUM : 09/13 0.0 0.0 0.1 23.7 485.9 : 09/20 54.7 0.0 0.0 97.0 443.6 SOYBEANS : 09/13 720.2 0.0 7.9 272.6 20825.0 : 09/20 854.9 0.0 55.4 328.9 21295.6 SOYBEAN CAKE & : 09/13 180.5 0.0 2.5 223.1 702.1 MEAL : 09/20 12.9 0.0 1.2 114.9 598.9