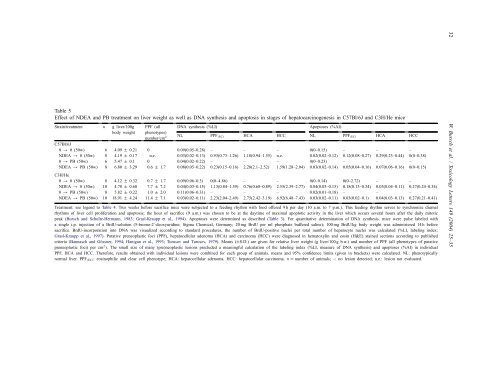
Table 5 Effect <strong>of</strong> NDEA <strong>and</strong> PB treatment on <strong>liver</strong> weight as well as DNA synthesis <strong>and</strong> <strong>apoptosis</strong> in stages <strong>of</strong> hepatocarcinogenesis in C57Bl/6J <strong>and</strong> C3H/He mice Strain/treatment n g <strong>liver</strong>/100g body weight PPF (all phenotypes) number/cm 2 DNA synthesis (%LI) Apoptoses (%AI) NL PPF(EC) HCA HCC NL PPF(EC) HCA HCC C57Bl/6J 0 → 0 (50w) 6 4.09 ± 0.21 0 0.09(0.05–0.28) – – – 0(0–0.15) – – – NDEA → 0 (50w) 8 4.19 ± 0.17 n.e. 0.03(0.02–0.13) 0.93(0.73–1.26) 1.18(0.94–1.55) n.e. 0.02(0.02–0.12) 0.12(0.08–0.27) 0.29(0.23–0.44) 0(0–0.38) 0 → PB (50w) 6 5.47 ± 0.1 0 0.04(0.02–0.22) – – – 0(0–0.23) – – – NDEA → PB (50w) C3H/He 8 6.80 ± 3.29 0.6 ± 1.7 0.08(0.05–0.22) 0.23(0.15–0.16) 2.28(2.1–2.52) 1.59(1.28–2.04) 0.03(0.02–0.14) 0.05(0.04–0.16) 0.07(0.06–0.16) 0(0–0.15) 0 → 0 (50w) 8 4.12 ± 0.32 0.7 ± 1.7 0.09(0.06–0.3) 0(0–4.86) – – 0(0–0.14) 0(0–2.72) – – NDEA → 0 (50w) 10 4.78 ± 0.60 7.7 ± 7.2 0.04(0.03–0.15) 1.13(0.84–1.59) 0.76(0.68–0.89) 2.55(2.39–2.77) 0.04(0.03–0.15) 0.18(0.13–0.34) 0.05(0.04–0.11) 0.27(0.24–0.34) 0 → PB (50w) 8 5.82 ± 0.22 1.0 ± 2.0 0.11(0.06–0.31) – – – 0.02(0.01–0.18) – – – NDEA → PB (50w) 10 18.91 ± 4.24 11.4 ± 7.1 0.03(0.02–0.11) 2.23(2.04–2.49) 2.75(2.42–3.19) 6.92(6.48–7.43) 0.03(0.02–0.11) 0.03(0.02–0.1) 0.04(0.03–0.13) 0.27(0.21–0.41) Treatment: see legend to Table 4. Two weeks be<strong>for</strong>e sacrifice mice were subjected to a feeding rhythm with food <strong>of</strong>fered 9 h per day (10 a.m. to 7 p.m.). This feeding rhythm serves to synchronize diurnal rhythms <strong>of</strong> <strong>liver</strong> cell proliferation <strong>and</strong> <strong>apoptosis</strong>; the hour <strong>of</strong> sacrifice (9 a.m.) was chosen to be at the daytime <strong>of</strong> maximal apoptotic activity in the <strong>liver</strong> which occurs several hours after the daily mitotic peak (Bursch <strong>and</strong> Schulte-Hermann, 1983; Grasl-Kraupp et al., 1994). Apoptoses were determined as described (Table 3). For quantitative determination <strong>of</strong> DNA synthesis. mice were pulse labeled with a single i.p. injection <strong>of</strong> a BrdU-solution (5-bromo-2 ′ -deoxyuridine; Sigma Chemical, Germany; 20 mg BrdU per ml phosphate buffered saline); 100 mg BrdU/kg body weight was administered 14 h be<strong>for</strong>e sacrifice. BrdU-incorporation into DNA was visualized according to st<strong>and</strong>ard procedures, the number <strong>of</strong> BrdU-positive nuclei per total number <strong>of</strong> hepatocyte nuclei was calculated (%LI, labeling index; Grasl-Kraupp et al., 1997). Putative preneoplastic foci (PPF), hepatocellular adenoma (HCA) <strong>and</strong> carcinoma (HCC) were diagnosed in hematoxylin <strong>and</strong> eosin (H&E) stained sections according to published criteria (Bannasch <strong>and</strong> Gössner, 1994; Hanigan et al., 1993; Turusov <strong>and</strong> Turusov, 1979). Means (±S.D.) are given <strong>for</strong> relative <strong>liver</strong> weight (g <strong>liver</strong>/100 g b.w.) <strong>and</strong> number <strong>of</strong> PPF (all phenotypes <strong>of</strong> putative preneoplastic foci) per cm 2 ). The small size <strong>of</strong> many (pre)neoplastic lesions precluded a meaningful calculation <strong>of</strong> the labeling index (%LI, measure <strong>of</strong> DNA synthesis) <strong>and</strong> apoptoses (%AI) in individual PPF, HCA <strong>and</strong> HCC. There<strong>for</strong>e, results obtained with individual lesions were combined <strong>for</strong> each group <strong>of</strong> animals. means <strong>and</strong> 95% confidence limits (given in brackets) were calculated. NL: phenotypically normal <strong>liver</strong>. PPF(EC): eosinophilic <strong>and</strong> clear cell phenotype; HCA: hepatocellular adenoma. HCC: hepatocellular carcinoma. n = number <strong>of</strong> animals; –: no lesion detected; n.e.: lesion not evaluated. 32 W. Bursch et al. / Toxicology Letters 149 (2004) 25–35
W. Bursch et al. / Toxicology Letters 149 (2004) 25–35 33 Table 6 Calculated <strong>and</strong> experimentally found labeling indices (LI, %) <strong>of</strong> PPFs <strong>and</strong> HCAs Strain/treatment n Lesion Calculated LI (%) Found LI (%) C3H/He NDEA → 0 (50w) 5 PPF 0.019 ± 0.003 0.014 ± 0.019 NDEA → PB (50w) 5 PPF 0.02 ± 0.003 0.015 ± 0.018 NDEA → PB (50w) 5 HCA 0.036 ± 0.003 0.026 ± 0.009 Treatment: see legend to Tables 4 <strong>and</strong> 5. n = number <strong>of</strong> animals analysed. Mean ± S.D. are given. (Frey et al., 2000). Likewise, Goldsworthy <strong>and</strong> Fransson-Steen (2002) reported an increase in apoptotic activity in late stages <strong>of</strong> hepatocarcinogenesis, possibly promoting focal cell selection. Finally, the present study also strongly suggests that the promoting action <strong>of</strong> phenobarbital in rats <strong>and</strong> mice is brought about by different mechanisms. In rat <strong>liver</strong>, as shown previously, PB stimulates DNA synthesis only transiently <strong>and</strong> <strong>tumor</strong> promotion is largely determined by inhibition <strong>of</strong> <strong>apoptosis</strong> (Bursch et al., 1984; Schulte-Hermann et al., 1990; Kolaja et al., 1996c). In conclusion, the findings <strong>of</strong> the present study do not support a significant role <strong>of</strong> apoptotic cell suicide during <strong>tumor</strong> promotion in the <strong>mouse</strong> <strong>liver</strong>, at least in early stages. Thus, failure <strong>of</strong> <strong>apoptosis</strong> as a cancer preventive event does not appear to provide an explanation <strong>for</strong> the strain specificities in <strong>liver</strong> cancer susceptibility. Furthermore, our studies revealed pr<strong>of</strong>ound species differences between mice <strong>and</strong> rats in regard to <strong>apoptosis</strong> control. References Alden, C.L., 2000. Safety assessment <strong>for</strong> non-genotoxic rodent carcinogens: curves, low-dose extrapolations, <strong>and</strong> mechanisms in carcinogenesis. Hum. Exp. Toxicol. 19 (10), 557–560. Bannasch, P., Gössner, W., 1994. Pathology <strong>of</strong> neoplasia <strong>and</strong> preneoplasia in rodents, In: Bannasch, P., Gössner, W. (Eds.), Schattauer, Stuttgart, New York. Bursch, W., Lauer, B., Timmermann-Trosiener, I., Barthel, G., Schuppler, J., Schulte-Hermann, R., 1984. Controlled death (<strong>apoptosis</strong>) <strong>of</strong> normal <strong>and</strong> putative preneoplastic cells in rat <strong>liver</strong> following withdrawal <strong>of</strong> <strong>tumor</strong> promoters. Carcinogenesis 5 (4), 453–458. Bursch, W., Fesus, L., Schulte-Hermann, R., 1992. Apoptosis (programmed cell death) <strong>and</strong> its relevance in <strong>liver</strong> injury <strong>and</strong> carcinogenesis, In: Dekant, W., Neumann, H.G. (Eds.), Tissue Specific Toxicology, Academic Press, London, pp. 95–117. Bursch, W., Schulte-Hermann, R., 1983. Synchronization <strong>of</strong> hepatic DNA synthesis by scheduled feeding <strong>and</strong> lighting in mice treated with the chemical inducer <strong>of</strong> <strong>liver</strong> <strong>growth</strong> -hexachlorcyclohexane. Cell Tissue Kinet. 16, 125–134. Carter, J.H., Carter, H.W., Deddens, J.A., Hurst, B.M., George, M.H., DeAngelo, A.B., 2003. A 2-year dose-response study <strong>of</strong> lesion sequences during hepatocellular carcinogenesis in the male B6C3F1 <strong>mouse</strong> given the drinking water chemical dichloroacetic acid. Environ. Health Perspect. 111 (1), 53–64. Carter, J.H., Carter, H.W., DeAngelo, A.B., 1995. Biochemical, pathologic <strong>and</strong> morphometric alterations induced in male B6C3F1 <strong>mouse</strong> <strong>liver</strong> by short-term exposure to dichloroacetic acid. Toxicol. Lett. 81 (1), 55–71. Chabicovsky, M., Wastl, U., Taper, H., Schulte-Hermann, R., Bursch, W., 2003. Induction <strong>of</strong> <strong>apoptosis</strong> in <strong>mouse</strong> <strong>liver</strong> adenoma <strong>and</strong> carcinoma in vivo by trans<strong>for</strong>ming <strong>growth</strong> factor-1, J. Cancer Res. Clin. Oncol. 129 (9), 536–542. Christensen, J.G., Goldsworthy, T.L., Cattley, R.C.M., 1999. Dys<strong>regulation</strong> <strong>of</strong> <strong>apoptosis</strong> by c-myc in transgenic hepatocytes <strong>and</strong> effects <strong>of</strong> <strong>growth</strong> factors <strong>and</strong> nongenotoxic carcinogens. Mol. Carcinog. 25 (4), 273–284. Diwan, B.A., Nims, R.W., Lubet, R.A., Rice, J.M., 1987. Liver <strong>tumor</strong> promoting activity <strong>of</strong> phenobarbital is associated with its ability to induce phenobarbital-inducible cytochrome(s) P-450 (P-450PB-B), aminopyrine-N-demethylase activity <strong>and</strong> <strong>liver</strong> hypertrophy. Toxicologist 7, 106. Fausto, N., 1999. Mouse <strong>liver</strong> umorigenesis: odels mechanisms <strong>and</strong> relevance to human disease. Sem. Liver Dis. 19 (3), 243–252, G. Thieme Verlag, Stutlgart, New York. Frey, S., Buchmann, A., Bursch, W., Schulte Hermann, R., Schwarz, M., 2000. Suppression <strong>of</strong> <strong>apoptosis</strong> in C3H <strong>mouse</strong> <strong>liver</strong> <strong>tumor</strong>s by activated Ha-ras oncogene. Carcinogenesis 21, 161–166. Gold, L.S., Manley, N.B., Slone, T.H., Ward, J.M., 2001. Compendium <strong>of</strong> chemical carcinogens by target organ: results <strong>of</strong> chronic bioassays in rats, mice, hamsters, dogs, <strong>and</strong> monkeys. Toxicol. Pathol. 29 (6), 639–652. Goldsworthy, T.L., Fransson-Steen, R., 2002. Quantification <strong>of</strong> the cancer process in C57Bl/6J, B6C3F1 <strong>and</strong> C3H/HeJ mice. Toxicol. Pathol. 30 (1), 97–105. Grasl-Kraupp, B., Bursch, W., Ruttkay-Nedecky, B., Wagner, A., Lauer, B., Schulte-Hermann, R., 1994. Food restriction eliminates preneoplastic cells through <strong>apoptosis</strong> <strong>and</strong> antagonizes carcinogenesis in rat <strong>liver</strong>. Proc. Natl. Acad. Sci. U.S.A. 91, 9995–9999. Grasl-Kraupp, B., Ruttkay-Nedecky, B., Müllauer, L., Taper, H., Huber, W., Bursch, W., Schulte-Hermann, R., 1997.