Role of apoptosis for mouse liver growth regulation and tumor ...
Role of apoptosis for mouse liver growth regulation and tumor ...
Role of apoptosis for mouse liver growth regulation and tumor ...

You also want an ePaper? Increase the reach of your titles
YUMPU automatically turns print PDFs into web optimized ePapers that Google loves.
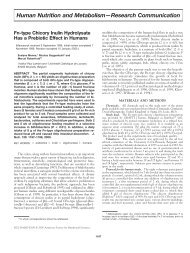
Toxicology Letters 149 (2004) 25–35<br />
<strong>Role</strong> <strong>of</strong> <strong>apoptosis</strong> <strong>for</strong> <strong>mouse</strong> <strong>liver</strong> <strong>growth</strong> <strong>regulation</strong> <strong>and</strong> <strong>tumor</strong><br />
promotion: comparative analysis <strong>of</strong> mice with high (C3H/He)<br />
<strong>and</strong> low (C57Bl/6J) cancer susceptibility<br />
Abstract<br />
W. Bursch a,∗ , B. Grasl-Kraupp a , U. Wastl a , K. Hufnagl a , M. Chabicovsky b ,<br />
H. Taper c , R. Schulte-Hermann a<br />
a Institute <strong>of</strong> Cancer Research, Medical University <strong>of</strong> Vienna, Borschkegasse 8a, A-1090 Vienna, Austria<br />
b Igeneon Immunotherapy <strong>of</strong> Cancer AG, Brunner Strasse 69, A-1230 Vienna, Austria<br />
c Unité de Biochemie Toxicologique et Cancérologique, Université Catholique Louvain,<br />
UCL 7369, B-1200 Bruxelles, Austria<br />
Apoptosis constitutes one <strong>of</strong> the organisms defense lines against cancer. We investigated whether failure <strong>of</strong> <strong>apoptosis</strong> may be<br />
concurrently causative <strong>for</strong> the high cancer susceptibility in C3H/He as compared to C57BL/6J mice (low cancer susceptibility).<br />
First, in short-term in vivo experiments (7–21 days), <strong>mouse</strong> <strong>liver</strong> <strong>growth</strong> (C3H/He, C57BL/6J) was induced by administration <strong>of</strong><br />
phenobarbital (PB; 2 days 500 ppm + 5 days 750 ppm via the food) or nafenopin (NAF; 7 days 500 ppm via the food), cessation <strong>of</strong><br />
PB or NAF treatment served to initiate <strong>liver</strong> involution. Liver weight, DNA content, hepatocyte ploidy <strong>and</strong> apoptotic activity were<br />
studied as endpoints. Secondly, in a long-term study <strong>liver</strong> carcinogenesis was initiated by a single dose <strong>of</strong> N-nitrosodiethylamine<br />
(NDEA, 90 mg/kg b.w.) to 5-weeks-old C57Bl/6J <strong>and</strong> C3H/He mice. After 2 weeks, mice received either st<strong>and</strong>ard diet or a diet<br />
containing phenobarbital (PB, 90 mg/kg b.w.) <strong>for</strong> up to 90 weeks. Cell proliferation <strong>and</strong> <strong>apoptosis</strong> in normal <strong>liver</strong> tissue <strong>and</strong><br />
(pre)neoplastic tissue was quantitatively analysed by histological means. The short term studies revealed that PB <strong>and</strong> NAF-induced<br />
<strong>mouse</strong> <strong>liver</strong> <strong>growth</strong> is essentially due to cell enlargement (hypertrophy). A moderate increase <strong>of</strong> <strong>liver</strong> DNA content was brought<br />
about by hepatocellular polyploidization; C3H/He mice exhibited the most pronounced ploidy shift, corresponding to their high<br />
cancer susceptibility. Upon cessation <strong>of</strong> PB or NAF treatment, regression <strong>of</strong> <strong>liver</strong> mass was neither associated with a loss <strong>of</strong><br />
DNA nor an increase in apoptoses in the <strong>liver</strong> <strong>of</strong> C3H/He <strong>and</strong> C57Bl/6J mice; food restriction did not en<strong>for</strong>ce the occurrence <strong>of</strong><br />
<strong>apoptosis</strong>. Thus, the <strong>mouse</strong> strains did not differ with respect to the occurrence <strong>of</strong> <strong>apoptosis</strong>. In the long-term study, PB promoted<br />
<strong>liver</strong> <strong>tumor</strong> <strong>for</strong>mation in all strains, exhibiting quantitative differences in <strong>growth</strong> kinetics <strong>of</strong> preneoplasia rather than a specific<br />
biological quality. Quantitative analysis <strong>of</strong> <strong>apoptosis</strong> in normal <strong>and</strong> (pre)neoplastic <strong>liver</strong> tissue <strong>of</strong> C3H/He <strong>and</strong> C57BL/6J mice<br />
revealed no clue to explain their different cancer susceptibility. Rather, cell proliferation seems to be the prevailing determinant<br />
<strong>of</strong> <strong>tumor</strong> promotion in the <strong>liver</strong> <strong>of</strong> both <strong>mouse</strong> strains.<br />
© 2004 Elsevier Irel<strong>and</strong> Ltd. All rights reserved.<br />
Keywords: C3H/He; C57BL/6J; Heptocarcinogenesis; Tumor susceptibility; Apoptosis; Cell proliferation<br />
∗ Corresponding author. Tel.: +43-1-4277-65139; fax: +43-1-4277-9651.<br />
E-mail address: wilfried.bursch@univie.ac.at (W. Bursch).<br />
0378-4274/$ – see front matter © 2004 Elsevier Irel<strong>and</strong> Ltd. All rights reserved.<br />
doi:10.1016/j.toxlet.2003.12.018
26 W. Bursch et al. / Toxicology Letters 149 (2004) 25–35<br />
1. Introduction<br />
Rodent species routinely used <strong>for</strong> life-time cancer<br />
studies on chemicals include <strong>mouse</strong> strains exhibiting<br />
a high (B6C3F1, C3H/He), but also a low (C57Bl/6J)<br />
susceptibility to spontaneous <strong>and</strong> chemically induced<br />
hepatocarcinogenesis (<strong>for</strong> review: Fausto, 1999, Gold<br />
et al., 2001). Elucidation the underlying causes is<br />
<strong>of</strong> great importance <strong>for</strong> risk assessment, but inspite<br />
<strong>of</strong> intense research ef<strong>for</strong>ts these still are a matter <strong>of</strong><br />
debate (Maronpot <strong>and</strong> Boorman, 1996; Alden, 2000;<br />
van Ravenzwaay <strong>and</strong> Tennekes, 2002). At the cellular<br />
level, cell replication <strong>and</strong> <strong>apoptosis</strong> are processes<br />
integrating all the genetic <strong>and</strong> molecular features <strong>of</strong><br />
the organism <strong>and</strong>, there<strong>for</strong>e may provide a clue to<br />
better underst<strong>and</strong> specificities in cancer susceptibility.<br />
Apoptosis constitutes an innate tissue defense against<br />
carcinogens by preventing survival <strong>of</strong> genetically<br />
damaged cells; the balance between cell proliferation<br />
<strong>and</strong> cell death determines the net <strong>growth</strong> <strong>of</strong> preneoplastic<br />
<strong>and</strong> <strong>tumor</strong> cell populations (Bursch et al., 1984;<br />
Schulte-Hermann et al., 1990; Grasl-Kraupp et al.,<br />
1997; Luebeck et al., 1995, 2000; Pitot et al., 2000;<br />
Lee, 2000). Consequently, block <strong>of</strong> <strong>apoptosis</strong> has been<br />
elucidated as prevailing mechanism <strong>of</strong> <strong>liver</strong> <strong>tumor</strong> promotion<br />
in many rodent studies, mostly using rat <strong>liver</strong><br />
models (Schulte-Hermann et al., 1990; Luebeck et al.,<br />
1995, 2000; Kolaja et al., 1996c; Schwarz et al., 2000;<br />
Pitot et al., 2000; O<strong>liver</strong> <strong>and</strong> Roberts, 2002; Tharappel<br />
et al., 2002). Relatively little is known about the role<br />
<strong>of</strong> <strong>apoptosis</strong> in determining cancer susceptibility in<br />
different <strong>mouse</strong> strains. Rather, based upon different<br />
experimental models somewhat conflicting data<br />
on <strong>apoptosis</strong> in <strong>mouse</strong> <strong>liver</strong> <strong>tumor</strong> promotion have<br />
been reported. For instance, <strong>growth</strong> <strong>of</strong> preneoplastic<br />
lesions, at least in early stages, has been attributed<br />
to predominantly depend on the proliferative activity<br />
while other studies described <strong>apoptosis</strong>-inhibition by<br />
<strong>tumor</strong> promoting agents (phenobarbital, peroxisome<br />
proliferators) as important determinant <strong>for</strong> <strong>tumor</strong> development<br />
in <strong>mouse</strong> <strong>liver</strong> (Pereira, 1993;Kolaja et al.,<br />
1996b,c; James et al., 1998; James <strong>and</strong> Roberts, 1996;<br />
Stevenson et al., 1999; S<strong>and</strong>ers <strong>and</strong> Thorgeirsson,<br />
2000; Goldsworthy <strong>and</strong> Fransson-Steen, 2002). There<strong>for</strong>e,<br />
we initiated a series <strong>of</strong> comparative short-term<br />
in vivo studies on <strong>liver</strong> <strong>growth</strong> (cell proliferation) <strong>and</strong><br />
involution (<strong>apoptosis</strong>) in C3H, C57Bl/6J <strong>and</strong> B6C3F1<br />
mice using the “classical” <strong>tumor</strong> promoter Phenobar-<br />
bital (PB) <strong>and</strong> the peroxisome proliferator nafenopin<br />
(NAF) as model compounds. The short-term experiments<br />
were complemented by a long-term carcinogenesis<br />
study with C3H/He, C57Bl/6J <strong>and</strong> B6C3F1 mice.<br />
Hepatocarcinogenesis was initiated by a single dose<br />
<strong>of</strong> N-nitrosodiethylamine (NDEA). Subsequently, we<br />
closely followed the <strong>growth</strong> <strong>of</strong> phenotypically distinct<br />
preneoplastic <strong>and</strong> neoplastic lesions as well as<br />
their DNA synthesis <strong>and</strong> apoptotic activitiy, without<br />
or with phenobarbital promotion. The experimental<br />
design was focussed to answer the question whether<br />
a high <strong>liver</strong> cancer susceptibility correlates with a<br />
failure <strong>of</strong> <strong>apoptosis</strong>. The present communication<br />
provides an excerpt <strong>of</strong> these studies to exemplarily<br />
highlight prominent species specificities <strong>of</strong> C3H/He<br />
<strong>and</strong> C57Bl/6J mice (parental strains <strong>of</strong> B6C3F1),<br />
C57Bl/6J both constituting the extremes in high <strong>and</strong><br />
low <strong>tumor</strong> susceptibility.<br />
2. Cell birth <strong>and</strong> cell death in normal <strong>mouse</strong> <strong>liver</strong><br />
(short-term studies)<br />
2.1. Liver <strong>growth</strong><br />
In male C57Bl/6J <strong>and</strong> C3H/He mice, PB treatment<br />
with doses <strong>of</strong> 500 ppm <strong>for</strong> 2 days followed by 750 ppm<br />
per day <strong>for</strong> 5 days via the diet caused an increase in<br />
<strong>liver</strong> weight by 40%–50% (Table 1). NAF treatment<br />
<strong>for</strong> 7 days, at the dose level chosen (500 ppm), caused<br />
a much more pronounced <strong>liver</strong> enlargement than PB<br />
in both strains <strong>of</strong> mice (85%–113% above controls,<br />
Table 1). Biochemical analysis revealed only a moderate<br />
increase in <strong>liver</strong> DNA (PB: about 8%–14%; NAF:<br />
8%–28%, Table 1). Thus, <strong>mouse</strong> <strong>liver</strong> enlargement in<br />
response to PB <strong>and</strong> NAF is largely due to hypertrophy,<br />
the extent <strong>of</strong> which -at least <strong>for</strong> PB-tended to be<br />
somewhat more pronounced in the highly susceptible<br />
C3H/He-mice (49% above control) as compared to<br />
C57Bl/6J mice (36% above control). In the <strong>liver</strong> <strong>of</strong><br />
PB-treated animals we also analysed the nuclear <strong>and</strong><br />
cellular ploidy pattern by histological-morphometrical<br />
means. As summarized in Table 2, 66%–75% <strong>of</strong> the<br />
hepatocytes contained two nuclei <strong>and</strong> binuclearity did<br />
not change significantly upon PB-treatment. As to<br />
nuclear <strong>and</strong> cellular ploidy, C57Bl/6J mice exhibited<br />
a slight but not significant shift in favor <strong>of</strong> 2 × 8n,<br />
1×16n <strong>and</strong> 2×16n hepatocytes, whereas in the <strong>liver</strong> <strong>of</strong>
Table 1<br />
Relative <strong>liver</strong> weight <strong>and</strong> DNA content in male C57Bl/6J <strong>and</strong> C3H/He mice<br />
W. Bursch et al. / Toxicology Letters 149 (2004) 25–35 27<br />
Strain Treatment Relative <strong>liver</strong> weight<br />
(g <strong>liver</strong>/100 g b.w.)<br />
DNA content<br />
(mg DNA/100 g b.w.)<br />
C57Bl/6J Co (7 days) 4.41 ± 0.14 4.53 ± 0.42<br />
PB (7 days) 6.01 ± 0.25 (+36%) ∗∗ 5.14 ± 0.46 (+14%) ∗<br />
NAF (7 days) 9.39 ± 0.13 (+113%) ∗∗ 5.80 ± 0.43 (+28%) ∗∗<br />
Co (21 days) 4.19 ± 0.17 4.66 ± 0.39<br />
PB (7 days) → 0 (14 days) 4.44 ± 0.19 (+6%) 5.21 ± 0.50 (+12%)<br />
NAF (7 days) → 0 (14 days) 4.47 ± 0.25 (+7%) 5.47 ± 0.45 (+17%) ∗∗<br />
C3H/He Co (7 days) 4.60 ± 0.30 4.82 ± 0.43<br />
PB (7 days) 6.84 ± 0.11 (+49%) ∗∗ 5.19 ± 0.41 (+8%)<br />
NAF (7 days) 8.53 ± 0.48 (+85%) ∗∗ 5.18 ± 0.53 (+8%)<br />
Co (21 days) 4.64 ± 0.35 4.57 ± 0.32<br />
PB (7 days) → 0 (14 days) 4.60 ± 0.15 (−1%) 4.74 ± 0.47 (+4%)<br />
NAF (7 days) → 0 (14 days) 4.34 ± 0.15 (−7%) 4.94 ± 0.09 (+8%)<br />
Seven to eight week-old-male C57Bl/6J <strong>and</strong> C3H/He mice (obtained from Zentralinstitut für Versuchstierzucht, Hannover, Germany) were<br />
housed individually <strong>and</strong> adapted <strong>for</strong> 4–6 weeks to a reversed light–dark-rhythm (lights on 10 p.m. to 10 a.m., lights <strong>of</strong>f from 10 a.m. to 10<br />
p.m.) with food (st<strong>and</strong>ard maintenance diet Altromin 1321N, (Altromin, Lage, Germany) <strong>and</strong> tap water ad libitum. The substances were<br />
administered via the diet, PB: 2 days 500 ppm, followed by 5 days 750 ppm; NAF: day 1–7 500 ppm. PB or NAF (7d): animals killed<br />
after 7 days treatment, Co (d7): control <strong>for</strong> day 7 <strong>of</strong> the experiment. PB or NAF (7d) → 0 (14d): animals treated with PB or NAF <strong>for</strong> 7<br />
days, followed by PB- or NAF-withdrawal <strong>for</strong> 14 days; Co (d21): controls at termination <strong>of</strong> the experiment (7 + 14 = 21 days). Animals<br />
were anaesthetized with is<strong>of</strong>luorane, decapitated <strong>and</strong> exsanguinated. The <strong>liver</strong> weight was taken upon removal <strong>of</strong> the gall bladder. For the<br />
biochemical determination <strong>of</strong> hepatic DNA content, <strong>liver</strong> specimens were processed as described in detail elsewhere (Schulte-Hermann<br />
et al., 1988). All animal experiments were per<strong>for</strong>med according to the Austrian guidelines <strong>for</strong> animal care <strong>and</strong> treatment. Means (±S.D.)<br />
<strong>of</strong> 5–8 animals per group are given, ∗ P
Table 2<br />
Binuclearity, nuclear <strong>and</strong> cellular ploidy in the <strong>liver</strong> <strong>of</strong> C57Bl/6J <strong>and</strong> C3H/He mice after PB treatment<br />
Strain n Treatment Binuclearity<br />
(%)<br />
Ploidy<br />
2n 4n 8n 16n 32n<br />
1 × 2n 2 × 2n 1 × 4n 2 × 4n 1 × 8n 2 × 8n 1 × 16n 2 × 16n 1 × 32n 2 × 32n<br />
C57Bl/6J 3 Co (7 days) 66.8 ± 5.3 1.1 ± 0.5 20.5 ± 3.4 13.0 ± 4.8 26.6 ± 6.8 13.6 ± 3.9 16.6 ± 5.0 4.7 ± 3.2 2.5 ± 1.4 0.8 ± 0.8 0.6 ± 0.5<br />
4 PB (7 days) 67.4 ± 3.6 0.8 ± 0.7 19.1 ± 6.0 11.2 ± 4.3 25.3 ± 4.0 13.3 ± 2.7 19.1 ± 3.4 6.2 ± 2.6 3.7 ± 1.1 1.0 ± 1.3 0.2 ± 0.4<br />
C3H/He 3 Co (7 days) 75.3 ± 1.3 1.6 ± 0.0 27.6 ± 2.7 13.1 ± 3.5 37.5 ± 3.8 7.4 ± 2.3 10.0 ± 6.7 2.2 ± 0.9 0.3 ± 0.5 0.3 ± 0.5 0.0 ± 0.0<br />
4 PB (7 days) 70.3 ± 3.6 1.4 ± 1.0 16.5 ± 5.3∗ 13.2 ± 4.8 29.3 ± 6.4 10.3 ± 5.6 21.7 ± 5.1∗ 4.1 ± 1.2 2.9 ± 2.6 0.6 ± 0.8 0.0 ± 0.0<br />
Treatment: see legend to Table 1. Hepatocytes were isolated by in situ collagenase <strong>liver</strong> perfusion as described in detail elsewhere (Parzefall et al., 2002) <strong>and</strong> a smear <strong>of</strong><br />
the cells was stained with H&E. Number <strong>of</strong> nuclei per cell <strong>and</strong> nuclear ploidy (nuclear diameter) <strong>of</strong> hepatocytes were determined by histological-morphometrical means by<br />
counting at least 1000 cells per animal. n = number <strong>of</strong> <strong>liver</strong>s analysed, means ± S.D. are given; ∗ P
Table 3<br />
Hepatocellular apoptoses in C3H/He <strong>and</strong> C57Bl/6J mice<br />
Strain Day Control (%) PB treatment<br />
(7 days) (%)<br />
W. Bursch et al. / Toxicology Letters 149 (2004) 25–35 29<br />
PB withdrawal<br />
(7 days → 0 <strong>for</strong><br />
2–14 days) (%)<br />
NAF treatment<br />
(7 days) (%)<br />
NAF withdrawal<br />
(7 days → 0 <strong>for</strong><br />
2–7 days) (%)<br />
C57Bl/6J 7 0 (0–0.17) 0 (0–0.17) 0.2 (0.13–0.41)<br />
9 0 (0–0.17) 0 (0–0.17)<br />
11 0.02 (0–0.17)<br />
14 0 (0–0.17) 0 (0–0.17)<br />
21 0 (0–0.17) 0.12 (0.06–0.29) 0 (0.06–0.29)<br />
9–21 FR 0.04 (0–0.14)<br />
C3H/He 7 0.02 (0–0.17) 0.03 (0–0.17) 0.08 (0–0.17)<br />
9 0.02 (0–0.17) 0.08 (0–0.17)<br />
11 0.02 (0–0.17)<br />
14 0 (0–0.17)<br />
21 0 (0–0.17) 0 (0–0.17)<br />
9–21 FR 0.05 (0–0.14)<br />
Treatment: see legend to Table 1. Liver specimens were cut into 4–5 mm thick slices <strong>and</strong> fixed with Carnoy’s solution <strong>and</strong> processed <strong>for</strong><br />
histological analysis as described in detail elsewhere (Grasl-Kraupp et al., 1994). Apoptoses were counted in hematoxylin <strong>and</strong> eosin (H&E)<br />
stained sections: hepatocytes with chromatin condensation typical <strong>of</strong> early stages <strong>of</strong> <strong>apoptosis</strong> as well as intra- <strong>and</strong> extracellular apoptotic<br />
bodies, with or without visible chromatin were recorded; their total number was expressed as percentage <strong>of</strong> the total number <strong>of</strong> hepatocytes<br />
scored in the respective cell population. The reliability <strong>and</strong> sensitivity <strong>of</strong> this procedure <strong>for</strong> quantitative determination <strong>of</strong> apoptoses has been<br />
verified (Chabicovsky et al., 2003). Data <strong>of</strong> two experiments are combined. means <strong>and</strong> 95% confidence limits (in brackets) are given. PB<br />
or NAF (7 days): animals sacrificed 1 day (day 7) after last treatment; PB or NAF (7 days) → 0: animals sacrificed two (day 9), four (day<br />
11), seven (day 14) or fourteen (day 21) days after PB- or NAF-withdrawal; means <strong>of</strong> 5–6 animals are given. FR: food restriction along<br />
with PB-withdrawal. Data <strong>of</strong> day 9–14. i.e. 2,4,7 days after PB withdrawal <strong>and</strong> food restricton are summarized, in total data <strong>of</strong> 26 animals.<br />
the occurrence <strong>of</strong> apoptoses, PB-pretreated mice were<br />
subjected to a 40% food restriction (FR) along with<br />
PB-withdrawal; FR has been previously shown to induce<br />
apoptoses in normal, hyperplastic as well as preneoplastic<br />
cell populations <strong>of</strong> rat <strong>liver</strong> (Grasl-Kraupp<br />
et al., 1994; Kolaja et al., 1996a; Hikita et al., 1998;<br />
Tomasi et al., 1999). Likewise, in C57Bl/6J×C3H F1<br />
mice subjected to food restriction an increase in apoptotic<br />
activity was reported (James <strong>and</strong> Muskhelishvili,<br />
1994; Kolaja et al., 1996a). In our study, body weight<br />
<strong>of</strong> FR-animals decreased steadily within the first week<br />
<strong>of</strong> food restriction, reaching the lowest levels (approx.<br />
70% <strong>of</strong> the initial body weight) within 7–9 days. Liver<br />
weight decreased by approx. 55%–60% within 1 week<br />
<strong>of</strong> FR. Surprisingly, the hepatic DNA content was not<br />
affected by FR—even food restriction <strong>for</strong> 14 days did<br />
not result in a significant lower <strong>liver</strong> DNA content as<br />
compared to feeding animals ad libitum (not shown).<br />
Accordingly, histological analysis revealed no significant<br />
increase in apoptotic activity at all time points<br />
investigated (2, 4, 7, 14 days FR; Table 3). In summary,<br />
<strong>mouse</strong> <strong>liver</strong> hypertrophy induced by PB or NAF<br />
is completely reversible within a few days after cessa-<br />
tion <strong>of</strong> treatment, similar to previous observations (<strong>for</strong><br />
review—Schulte-Hermann, 1974; Bursch et al., 1992;<br />
Huber et al., 1996). In contrast to hypertrophy, the enhanced<br />
DNA content <strong>and</strong> ploidy persisted <strong>for</strong> at least<br />
14 days after PB or NAF withdrawal <strong>and</strong> no increase<br />
<strong>of</strong> apoptoses occurred. Furthermore, food restriction<br />
did not facilitate the occurrence <strong>of</strong> <strong>apoptosis</strong> in <strong>mouse</strong><br />
<strong>liver</strong>. Thus, the present findings <strong>of</strong> the short-term<br />
experiments strongly suggest that <strong>mouse</strong> hepatocytes<br />
do not enter <strong>apoptosis</strong> as readily as rat hepatocytes<br />
under these conditions. It should be emphasized that<br />
this conclusion applies to both compounds studied,<br />
namely PB <strong>and</strong> NAF, which exert their action on hepatocytes<br />
through different receptor-signal transduction<br />
pathways (O<strong>liver</strong> <strong>and</strong> Roberts, 2002). Moreover,<br />
other in vivo as well as cell culture studies revealed<br />
that <strong>mouse</strong> hepatocytes are much less sensitive to the<br />
pro-apoptotic action <strong>of</strong> TGF-1 as compared to rat<br />
hepatocytes (Parzefall et al., 2002; Chabicovsky et al.,<br />
2003). In conclusion, the present short-term studies<br />
reveal no difference with respect to the occurrence <strong>of</strong><br />
<strong>apoptosis</strong> during <strong>liver</strong> regression among the <strong>mouse</strong><br />
strains under study, but add support to observations
30 W. Bursch et al. / Toxicology Letters 149 (2004) 25–35<br />
suggesting pr<strong>of</strong>ound differences in <strong>apoptosis</strong> control<br />
in <strong>mouse</strong> as opposed to rat <strong>liver</strong>.<br />
3. Cell birth <strong>and</strong> cell death in putative<br />
preneoplastic lesions, adenoma <strong>and</strong> carcinoma <strong>of</strong><br />
<strong>mouse</strong> <strong>liver</strong> (long-term study)<br />
3.1. Formation <strong>of</strong> <strong>liver</strong> <strong>tumor</strong>s<br />
Twenty weeks after a single dose <strong>of</strong> N-nitrosodiethylamine<br />
(NDEA), with or without subsequent<br />
PB-treatment, neither C57Bl/6J nor C3H/He developed<br />
macroscopically visible lesions (not shown). At<br />
40 weeks <strong>of</strong> the experimental period, a low <strong>tumor</strong> incidence<br />
was found in “NDEA → PB (38w)” treated<br />
C57Bl/6J animals, followed by gradual increase until<br />
74 weeks <strong>of</strong> PB treatment (Table 4). In contrast, at<br />
40 weeks <strong>of</strong> the experiment “NDEA → PB (38w)”<br />
treated C3H/He mice exhibited already a high number<br />
<strong>of</strong> <strong>tumor</strong>s (Table 4); C3H/He mice treated with<br />
either NDEA or PB alone developed <strong>liver</strong> <strong>tumor</strong>s as<br />
well, but more slowly <strong>and</strong> to a lesser extent (Table 4).<br />
Furthermore, at 40 <strong>and</strong> 76 weeks <strong>of</strong> the experiment<br />
C3H/He mice in general exhibited a significantly<br />
higher <strong>liver</strong> <strong>tumor</strong> incidence than C57Bl/6J animals.<br />
In fact, because <strong>of</strong> the high <strong>liver</strong> <strong>tumor</strong> incidence<br />
“NDEA → PB” treated C3H/He mice could not be<br />
assigned <strong>for</strong> later time points <strong>of</strong> the study. These results<br />
confirmed the known interstrain differences between<br />
C3H/He <strong>and</strong> C57Bl/6J mice (<strong>for</strong> review: Gold<br />
et al., 2001; Fausto, 1999). Furthermore, according to<br />
histopathological criteria the macroscopically visible<br />
lesions were classified as either hepatocellular adenoma<br />
(HCA) or carcinoma (HCC)—(1) the majority<br />
revealed to be HCA (C57Bl/6J: 89%, C3H/He: 64%),<br />
(2) these data also indicate that progression from HCA<br />
to HCC occurs more readily in C3H/He (36% HCC)<br />
than in C57Bl/6J-mice (11% HCC). Likewise, the<br />
conversion rate <strong>of</strong> foci into <strong>tumor</strong>s has been found to<br />
correlate with <strong>mouse</strong> strain susceptibility to hepatocarcinogenesis<br />
(Goldsworthy <strong>and</strong> Fransson-Steen, 2002).<br />
3.2. Cell birth <strong>and</strong> cell death in PPF, HCA <strong>and</strong> HCC<br />
Putative preneoplastic lesions (PPF) were diagnosed<br />
in HE-stained <strong>liver</strong> sections according to published<br />
criteria (Bannasch <strong>and</strong> Gössner, 1994; Hanigan et al.,<br />
Table 4<br />
Mouse <strong>liver</strong> <strong>tumor</strong> incidence in C57Bl/6J <strong>and</strong> C3H/He mice<br />
Strain/treatment n Number <strong>of</strong> <strong>tumor</strong>s/animal<br />
C57Bl/6J<br />
0 → 0<br />
(50w) 6 0.2 ± 0.4<br />
(74w)<br />
NDEA → 0<br />
4 0.3 ± 0.5<br />
(38w) 7 0.3 ± 0.8<br />
(50w) 8 1.6 ± 1.2<br />
(74w)<br />
0 → PB<br />
12 1.7 ± 1.7<br />
(50w) 6 0<br />
(74w)<br />
NDEA → PB<br />
4 0<br />
(38w) 5 0.1 ± 0.4<br />
(50w) 8 2.5 ± 3.6<br />
(74w) 12 5.2 ± 3.8a C3H/He<br />
0 → 0<br />
(50w) 6 0.7 ± 0.8<br />
(74w)<br />
NDEA → 0<br />
6 0.6 ± 0.6<br />
(38w) 6 2.6 ± 1.9<br />
(50w) 8 6.0 ± 2.0<br />
(74w) 12 7.6 ± 2.8bb 0 → PB<br />
(50w) 6 0.5 ± 1.2<br />
(74w)<br />
NDEA → PB<br />
4 2.7 ± 1.9<br />
(38w) 7 9.3 ± 2.5c (50w) 11 9.1 ± 2.2d Male C57Bl/6J <strong>and</strong> C3H/He (specific pathogen free; purchased from<br />
the Institut für Labortierkunde und –genetik (Himberg, Austria) were<br />
housed individually in Macrolon cages on st<strong>and</strong>ard s<strong>of</strong>twood bedding<br />
(Altromin, Lage, Germany) under st<strong>and</strong>ardized environmental conditions<br />
<strong>and</strong> an inverted 12 h light–dark rhythm with light from 10 p.m. to 10<br />
a.m. <strong>and</strong> dark from 10 a.m. to 10 p.m. Food (Altromin 1321 N) <strong>and</strong><br />
tap water were provided ad libitum. Body weight <strong>and</strong> food consumption<br />
were recorded weekly. 5-weeks-old mice received a single intraperitoneal<br />
injection <strong>of</strong> N-nitrosodiethylamine (NDEA). 90 mg/kg <strong>of</strong> body weight<br />
(NDEA obtained from Sigma-Aldrich, Wien, Austria), freshly dissolved in<br />
sterile 0.9% saline (20 ml/kg <strong>of</strong> b.w.). After 2 weeks <strong>of</strong> recovery, mice were<br />
fed either st<strong>and</strong>ard diet (“NDEA → 0”) or a diet containing phenobarbital<br />
(5-ethyl-5-phenyl-barbituric acid, (PB; Fluka Chemie, Buchs, Switzerl<strong>and</strong>)<br />
<strong>for</strong> up to 90 weeks (“NDEA → PB”). Other groups <strong>of</strong> animals received<br />
PB alone (“0 → PB”) or no treatment at all (control “0 → 0”). The PB<br />
concentration in the diet was adjusted in the range <strong>of</strong> 0.05%–0.07% to<br />
provide a constant daily intake <strong>of</strong> 90 mg PB/kg b.w. Mean number <strong>of</strong><br />
macroscopically visible <strong>tumor</strong>s per animal (±S.D.) are given. number <strong>of</strong><br />
animals are given at the bottom. For statistical comparisons the two-tailed<br />
Mann–Whitney-test (non-parametric statistic test procedure) was used.<br />
a P
1993). In NDEA → PB-treated mice, eosinophilic<br />
<strong>and</strong> clear cell foci were found to constitute the vast<br />
majority <strong>of</strong> the preneoplastic cell population, similarly<br />
to previous observations (Lee, 1997, 2000; Wastl<br />
et al., 1998; Christensen et al., 1999; Goldsworthy<br />
<strong>and</strong> Fransson-Steen, 2002). In the present overview,<br />
the differences in the <strong>growth</strong> parameters <strong>of</strong> C3H/He<br />
<strong>and</strong> C57Bl/6J mice are described in principle <strong>for</strong> one<br />
interim time point <strong>of</strong> our long-term study, namely at<br />
52 weeks <strong>of</strong> the experiment (Table 4). At this stage,<br />
in the <strong>liver</strong> <strong>of</strong> C57Bl/6J mice a few PPF (sum <strong>of</strong><br />
all phenotypes, namely eosinophilic, clear cell, amphophilic,<br />
tigroid, basophilic, vacuolated cell foci)<br />
were detectable only in animals subjected to the initiating<br />
treatment with NDEA (Table 5). In contrast, in<br />
C3H/He mice PPF appeared more frequent <strong>and</strong> were<br />
found even in control animals (“0–0”; Table 5). This<br />
snapshot at 52 weeks <strong>of</strong> the experiment reflects a coherently<br />
different <strong>growth</strong> kinetics <strong>of</strong> PPF in C3H/He<br />
<strong>and</strong> C57Bl/6J mice over time with respect to foci<br />
number <strong>and</strong> size (not shown) <strong>and</strong> the development <strong>of</strong><br />
HCA <strong>and</strong> HCC.<br />
PPF, HCA <strong>and</strong> HCC were surveyed <strong>for</strong> cell birth (labeling<br />
index = LI) <strong>and</strong> cell death (<strong>apoptosis</strong>-index =<br />
AI), the results are summarized in Table 5 (note:<br />
<strong>for</strong> PPF, only data <strong>of</strong> eosinophilic <strong>and</strong> clear cell foci<br />
(=PPF(EC)) are shown)—(1) in both strains, the cell<br />
birth rate was lowest in phenotypically normal <strong>liver</strong><br />
(NL) <strong>and</strong> in general, gradually increased from NL to<br />
PPF(EC) to HCAs <strong>and</strong> finally, to HCCs, very much<br />
like our previous observations on hepatocarcinogenesis<br />
in rat <strong>and</strong> human <strong>liver</strong> (Grasl-Kraupp et al., 1997);<br />
(2) notably, C3H/He mice treated with PB exhibited<br />
a significantly higher rate <strong>of</strong> DNA synthesis in PPF,<br />
HCA <strong>and</strong> HCC cells as compared to the corresponding<br />
C57Bl/6J mice (2.2%–6.9% versus 0.23%–2.3%);<br />
(3) in NL <strong>of</strong> both <strong>mouse</strong> strains, apoptoses were undetectable<br />
or very few (C3H/He 0%–0.04%; C57Bl/6J<br />
0%–0.03%); (4) PPF(EC), HCA <strong>and</strong> HCC exhibited a<br />
slightly increased apoptotic activity; the highest apoptotic<br />
activity tended to occur in HCC <strong>of</strong> C3H/He mice;<br />
(5) PB-treatment did not result in a consistent manifestation<br />
<strong>of</strong> an anti-apoptotic effect; (6) overall, histological<br />
analysis did not refer to a significant difference<br />
<strong>of</strong> apoptotic activity in the <strong>liver</strong>s <strong>of</strong> C3H/He <strong>and</strong><br />
C57Bl/6J mice. However, apoptotic activity in phenotypically<br />
normal as well as in (pre)neoplastic <strong>liver</strong><br />
tissue was much lower as compared to previous obser-<br />
W. Bursch et al. / Toxicology Letters 149 (2004) 25–35 31<br />
vations on rat <strong>liver</strong> carcinogenesis (Schulte-Hermann<br />
et al., 1990; Grasl-Kraupp et al., 1997).<br />
In a further approach to elucidate the role <strong>of</strong> cell<br />
proliferation versus <strong>apoptosis</strong> <strong>for</strong> <strong>growth</strong> <strong>of</strong> PPF<br />
we calculated the daily <strong>growth</strong> rates <strong>of</strong> the PPFs<br />
<strong>and</strong> HCAs from histologically determined labeling<br />
indices <strong>of</strong> the individual lesions. These values<br />
were compared with the daily <strong>growth</strong> rate estimated<br />
from the increase in cell number <strong>of</strong> lesions as described<br />
by Schulte-Hermann et al. (1990). Briefly,<br />
the <strong>growth</strong> rate was calculated using the following<br />
<strong>for</strong>mula—N = No • e k• t , with N0 = number <strong>of</strong> cells<br />
per lesion at start (i.e. at initiation with NDEA, N0<br />
was set 1; t = 0), k = daily proliferation rate, <strong>and</strong><br />
N = number <strong>of</strong> cells per lesion after experimental<br />
period t (in days). N was obtained from the average<br />
size <strong>of</strong> PPFs, or HCAs, respectively, (not shown); the<br />
number <strong>of</strong> cells per cross section was trans<strong>for</strong>med<br />
into number <strong>of</strong> cells per volume, assuming spherical<br />
shapes. As an estimate <strong>of</strong> k it was assumed that the<br />
LI obtained reflected the number <strong>of</strong> cells replicating<br />
per day. Furthermore, an exponential <strong>growth</strong> <strong>of</strong> hepatocellular<br />
lesions was assumed. As shown in Table 6,<br />
the experimentally found <strong>and</strong> calculated daily <strong>growth</strong><br />
rates were almost identical; it should be emphasized<br />
that this calculation does not account <strong>for</strong> <strong>apoptosis</strong>.<br />
Thus, these findings suggest that foci <strong>growth</strong> occurs<br />
without significant elimination <strong>of</strong> initiated cells. The<br />
molecular basis <strong>for</strong> the low rate <strong>of</strong> <strong>apoptosis</strong> in cancer<br />
prestages <strong>of</strong> <strong>mouse</strong> <strong>liver</strong> as observed by us <strong>and</strong> others<br />
is not yet clear. Interestingly, typical lesions resulting<br />
from the NDEA → PB-protocol, namely eosinophilic<br />
PPF <strong>and</strong> <strong>tumor</strong>s, do not overexpress bcl-2 (Lee,<br />
1997). Based upon results on chronic PB-treatment <strong>of</strong><br />
B6C3F1 mice without initiation by a genotoxic agent<br />
Christensen et al. (1999) reported expression <strong>of</strong> BclXL<br />
in the majority <strong>of</strong> acidophilic foci <strong>and</strong> adenomas,<br />
but only a small fraction <strong>of</strong> these lesions to express<br />
bcl-2.<br />
Consequently to the lack <strong>of</strong> apoptoses, the <strong>growth</strong><br />
<strong>of</strong> PPF in <strong>mouse</strong> <strong>liver</strong> predominantly is affected<br />
by the rate <strong>of</strong> cell proliferation; cancer susceptible<br />
C3H/He mice exhibit a higher proliferative activitiy<br />
than C57Bl/6J-mice. Furthermore, the progression<br />
<strong>of</strong> cancer prestages to HCC may be associated with<br />
an increased sensitivity to pro-apoptotic signals, as<br />
indicated by the present data as well as by a previous<br />
independent analysis <strong>of</strong> HCCs <strong>of</strong> C3H/He mice
Table 5<br />
Effect <strong>of</strong> NDEA <strong>and</strong> PB treatment on <strong>liver</strong> weight as well as DNA synthesis <strong>and</strong> <strong>apoptosis</strong> in stages <strong>of</strong> hepatocarcinogenesis in C57Bl/6J <strong>and</strong> C3H/He mice<br />
Strain/treatment n g <strong>liver</strong>/100g<br />
body weight<br />
PPF (all<br />
phenotypes)<br />
number/cm 2<br />
DNA synthesis (%LI) Apoptoses (%AI)<br />
NL PPF(EC) HCA HCC NL PPF(EC) HCA HCC<br />
C57Bl/6J<br />
0 → 0 (50w) 6 4.09 ± 0.21 0 0.09(0.05–0.28) – – – 0(0–0.15) – – –<br />
NDEA → 0 (50w) 8 4.19 ± 0.17 n.e. 0.03(0.02–0.13) 0.93(0.73–1.26) 1.18(0.94–1.55) n.e. 0.02(0.02–0.12) 0.12(0.08–0.27) 0.29(0.23–0.44) 0(0–0.38)<br />
0 → PB (50w) 6 5.47 ± 0.1 0 0.04(0.02–0.22) – – – 0(0–0.23) – – –<br />
NDEA → PB (50w)<br />
C3H/He<br />
8 6.80 ± 3.29 0.6 ± 1.7 0.08(0.05–0.22) 0.23(0.15–0.16) 2.28(2.1–2.52) 1.59(1.28–2.04) 0.03(0.02–0.14) 0.05(0.04–0.16) 0.07(0.06–0.16) 0(0–0.15)<br />
0 → 0 (50w) 8 4.12 ± 0.32 0.7 ± 1.7 0.09(0.06–0.3) 0(0–4.86) – – 0(0–0.14) 0(0–2.72) – –<br />
NDEA → 0 (50w) 10 4.78 ± 0.60 7.7 ± 7.2 0.04(0.03–0.15) 1.13(0.84–1.59) 0.76(0.68–0.89) 2.55(2.39–2.77) 0.04(0.03–0.15) 0.18(0.13–0.34) 0.05(0.04–0.11) 0.27(0.24–0.34)<br />
0 → PB (50w) 8 5.82 ± 0.22 1.0 ± 2.0 0.11(0.06–0.31) – – – 0.02(0.01–0.18) – – –<br />
NDEA → PB (50w) 10 18.91 ± 4.24 11.4 ± 7.1 0.03(0.02–0.11) 2.23(2.04–2.49) 2.75(2.42–3.19) 6.92(6.48–7.43) 0.03(0.02–0.11) 0.03(0.02–0.1) 0.04(0.03–0.13) 0.27(0.21–0.41)<br />
Treatment: see legend to Table 4. Two weeks be<strong>for</strong>e sacrifice mice were subjected to a feeding rhythm with food <strong>of</strong>fered 9 h per day (10 a.m. to 7 p.m.). This feeding rhythm serves to synchronize diurnal<br />
rhythms <strong>of</strong> <strong>liver</strong> cell proliferation <strong>and</strong> <strong>apoptosis</strong>; the hour <strong>of</strong> sacrifice (9 a.m.) was chosen to be at the daytime <strong>of</strong> maximal apoptotic activity in the <strong>liver</strong> which occurs several hours after the daily mitotic<br />
peak (Bursch <strong>and</strong> Schulte-Hermann, 1983; Grasl-Kraupp et al., 1994). Apoptoses were determined as described (Table 3). For quantitative determination <strong>of</strong> DNA synthesis. mice were pulse labeled with<br />
a single i.p. injection <strong>of</strong> a BrdU-solution (5-bromo-2 ′ -deoxyuridine; Sigma Chemical, Germany; 20 mg BrdU per ml phosphate buffered saline); 100 mg BrdU/kg body weight was administered 14 h be<strong>for</strong>e<br />
sacrifice. BrdU-incorporation into DNA was visualized according to st<strong>and</strong>ard procedures, the number <strong>of</strong> BrdU-positive nuclei per total number <strong>of</strong> hepatocyte nuclei was calculated (%LI, labeling index;<br />
Grasl-Kraupp et al., 1997). Putative preneoplastic foci (PPF), hepatocellular adenoma (HCA) <strong>and</strong> carcinoma (HCC) were diagnosed in hematoxylin <strong>and</strong> eosin (H&E) stained sections according to published<br />
criteria (Bannasch <strong>and</strong> Gössner, 1994; Hanigan et al., 1993; Turusov <strong>and</strong> Turusov, 1979). Means (±S.D.) are given <strong>for</strong> relative <strong>liver</strong> weight (g <strong>liver</strong>/100 g b.w.) <strong>and</strong> number <strong>of</strong> PPF (all phenotypes <strong>of</strong> putative<br />
preneoplastic foci) per cm 2 ). The small size <strong>of</strong> many (pre)neoplastic lesions precluded a meaningful calculation <strong>of</strong> the labeling index (%LI, measure <strong>of</strong> DNA synthesis) <strong>and</strong> apoptoses (%AI) in individual<br />
PPF, HCA <strong>and</strong> HCC. There<strong>for</strong>e, results obtained with individual lesions were combined <strong>for</strong> each group <strong>of</strong> animals. means <strong>and</strong> 95% confidence limits (given in brackets) were calculated. NL: phenotypically<br />
normal <strong>liver</strong>. PPF(EC): eosinophilic <strong>and</strong> clear cell phenotype; HCA: hepatocellular adenoma. HCC: hepatocellular carcinoma. n = number <strong>of</strong> animals; –: no lesion detected; n.e.: lesion not evaluated.<br />
32 W. Bursch et al. / Toxicology Letters 149 (2004) 25–35
W. Bursch et al. / Toxicology Letters 149 (2004) 25–35 33<br />
Table 6<br />
Calculated <strong>and</strong> experimentally found labeling indices (LI, %) <strong>of</strong> PPFs <strong>and</strong> HCAs<br />
Strain/treatment n Lesion Calculated LI (%) Found LI (%)<br />
C3H/He<br />
NDEA → 0 (50w) 5 PPF 0.019 ± 0.003 0.014 ± 0.019<br />
NDEA → PB (50w) 5 PPF 0.02 ± 0.003 0.015 ± 0.018<br />
NDEA → PB (50w) 5 HCA 0.036 ± 0.003 0.026 ± 0.009<br />
Treatment: see legend to Tables 4 <strong>and</strong> 5. n = number <strong>of</strong> animals analysed. Mean ± S.D. are given.<br />
(Frey et al., 2000). Likewise, Goldsworthy <strong>and</strong><br />
Fransson-Steen (2002) reported an increase in apoptotic<br />
activity in late stages <strong>of</strong> hepatocarcinogenesis,<br />
possibly promoting focal cell selection. Finally, the<br />
present study also strongly suggests that the promoting<br />
action <strong>of</strong> phenobarbital in rats <strong>and</strong> mice is<br />
brought about by different mechanisms. In rat <strong>liver</strong>,<br />
as shown previously, PB stimulates DNA synthesis<br />
only transiently <strong>and</strong> <strong>tumor</strong> promotion is largely determined<br />
by inhibition <strong>of</strong> <strong>apoptosis</strong> (Bursch et al., 1984;<br />
Schulte-Hermann et al., 1990; Kolaja et al., 1996c).<br />
In conclusion, the findings <strong>of</strong> the present study do<br />
not support a significant role <strong>of</strong> apoptotic cell suicide<br />
during <strong>tumor</strong> promotion in the <strong>mouse</strong> <strong>liver</strong>, at least<br />
in early stages. Thus, failure <strong>of</strong> <strong>apoptosis</strong> as a cancer<br />
preventive event does not appear to provide an explanation<br />
<strong>for</strong> the strain specificities in <strong>liver</strong> cancer susceptibility.<br />
Furthermore, our studies revealed pr<strong>of</strong>ound<br />
species differences between mice <strong>and</strong> rats in regard to<br />
<strong>apoptosis</strong> control.<br />
References<br />
Alden, C.L., 2000. Safety assessment <strong>for</strong> non-genotoxic rodent<br />
carcinogens: curves, low-dose extrapolations, <strong>and</strong> mechanisms<br />
in carcinogenesis. Hum. Exp. Toxicol. 19 (10), 557–560.<br />
Bannasch, P., Gössner, W., 1994. Pathology <strong>of</strong> neoplasia <strong>and</strong><br />
preneoplasia in rodents, In: Bannasch, P., Gössner, W. (Eds.),<br />
Schattauer, Stuttgart, New York.<br />
Bursch, W., Lauer, B., Timmermann-Trosiener, I., Barthel, G.,<br />
Schuppler, J., Schulte-Hermann, R., 1984. Controlled death<br />
(<strong>apoptosis</strong>) <strong>of</strong> normal <strong>and</strong> putative preneoplastic cells in rat<br />
<strong>liver</strong> following withdrawal <strong>of</strong> <strong>tumor</strong> promoters. Carcinogenesis<br />
5 (4), 453–458.<br />
Bursch, W., Fesus, L., Schulte-Hermann, R., 1992. Apoptosis<br />
(programmed cell death) <strong>and</strong> its relevance in <strong>liver</strong> injury <strong>and</strong><br />
carcinogenesis, In: Dekant, W., Neumann, H.G. (Eds.), Tissue<br />
Specific Toxicology, Academic Press, London, pp. 95–117.<br />
Bursch, W., Schulte-Hermann, R., 1983. Synchronization <strong>of</strong><br />
hepatic DNA synthesis by scheduled feeding <strong>and</strong> lighting<br />
in mice treated with the chemical inducer <strong>of</strong> <strong>liver</strong> <strong>growth</strong><br />
-hexachlorcyclohexane. Cell Tissue Kinet. 16, 125–134.<br />
Carter, J.H., Carter, H.W., Deddens, J.A., Hurst, B.M., George,<br />
M.H., DeAngelo, A.B., 2003. A 2-year dose-response study<br />
<strong>of</strong> lesion sequences during hepatocellular carcinogenesis in<br />
the male B6C3F1 <strong>mouse</strong> given the drinking water chemical<br />
dichloroacetic acid. Environ. Health Perspect. 111 (1), 53–64.<br />
Carter, J.H., Carter, H.W., DeAngelo, A.B., 1995. Biochemical,<br />
pathologic <strong>and</strong> morphometric alterations induced in male<br />
B6C3F1 <strong>mouse</strong> <strong>liver</strong> by short-term exposure to dichloroacetic<br />
acid. Toxicol. Lett. 81 (1), 55–71.<br />
Chabicovsky, M., Wastl, U., Taper, H., Schulte-Hermann, R.,<br />
Bursch, W., 2003. Induction <strong>of</strong> <strong>apoptosis</strong> in <strong>mouse</strong> <strong>liver</strong><br />
adenoma <strong>and</strong> carcinoma in vivo by trans<strong>for</strong>ming <strong>growth</strong><br />
factor-1, J. Cancer Res. Clin. Oncol. 129 (9), 536–542.<br />
Christensen, J.G., Goldsworthy, T.L., Cattley, R.C.M., 1999.<br />
Dys<strong>regulation</strong> <strong>of</strong> <strong>apoptosis</strong> by c-myc in transgenic hepatocytes<br />
<strong>and</strong> effects <strong>of</strong> <strong>growth</strong> factors <strong>and</strong> nongenotoxic carcinogens.<br />
Mol. Carcinog. 25 (4), 273–284.<br />
Diwan, B.A., Nims, R.W., Lubet, R.A., Rice, J.M., 1987. Liver<br />
<strong>tumor</strong> promoting activity <strong>of</strong> phenobarbital is associated with its<br />
ability to induce phenobarbital-inducible cytochrome(s) P-450<br />
(P-450PB-B), aminopyrine-N-demethylase activity <strong>and</strong> <strong>liver</strong><br />
hypertrophy. Toxicologist 7, 106.<br />
Fausto, N., 1999. Mouse <strong>liver</strong> umorigenesis: odels mechanisms <strong>and</strong><br />
relevance to human disease. Sem. Liver Dis. 19 (3), 243–252,<br />
G. Thieme Verlag, Stutlgart, New York.<br />
Frey, S., Buchmann, A., Bursch, W., Schulte Hermann, R.,<br />
Schwarz, M., 2000. Suppression <strong>of</strong> <strong>apoptosis</strong> in C3H <strong>mouse</strong><br />
<strong>liver</strong> <strong>tumor</strong>s by activated Ha-ras oncogene. Carcinogenesis 21,<br />
161–166.<br />
Gold, L.S., Manley, N.B., Slone, T.H., Ward, J.M., 2001.<br />
Compendium <strong>of</strong> chemical carcinogens by target organ: results<br />
<strong>of</strong> chronic bioassays in rats, mice, hamsters, dogs, <strong>and</strong><br />
monkeys. Toxicol. Pathol. 29 (6), 639–652.<br />
Goldsworthy, T.L., Fransson-Steen, R., 2002. Quantification <strong>of</strong><br />
the cancer process in C57Bl/6J, B6C3F1 <strong>and</strong> C3H/HeJ mice.<br />
Toxicol. Pathol. 30 (1), 97–105.<br />
Grasl-Kraupp, B., Bursch, W., Ruttkay-Nedecky, B., Wagner,<br />
A., Lauer, B., Schulte-Hermann, R., 1994. Food restriction<br />
eliminates preneoplastic cells through <strong>apoptosis</strong> <strong>and</strong><br />
antagonizes carcinogenesis in rat <strong>liver</strong>. Proc. Natl. Acad. Sci.<br />
U.S.A. 91, 9995–9999.<br />
Grasl-Kraupp, B., Ruttkay-Nedecky, B., Müllauer, L., Taper,<br />
H., Huber, W., Bursch, W., Schulte-Hermann, R., 1997.
34 W. Bursch et al. / Toxicology Letters 149 (2004) 25–35<br />
Inherent increase <strong>of</strong> <strong>apoptosis</strong> in <strong>liver</strong> <strong>tumor</strong>s: implications <strong>for</strong><br />
carcinogenesis <strong>and</strong> <strong>tumor</strong> regression. Hepatology 25 (4), 906–<br />
912.<br />
Hanigan, M.H., Winkler, M.L., Drinkwater, N.R., 1993. Induction<br />
<strong>of</strong> three histochemically distinct populations <strong>of</strong> hepatic foci in<br />
C57BL/6J mice. Carcinogenesis 14 (5), 1035–1040.<br />
Hasmall, S.C., Roberts, R.A., 1997. Hepatic ploidy, nuclearity,<br />
<strong>and</strong> distribution <strong>of</strong> DNA synthesis: a comparison <strong>of</strong><br />
nongenotoxic hepatocarcinogens with noncarcinogenic <strong>liver</strong><br />
mitogens. Toxicol. Appl. Pharmacol. 144 (2), 287–293.<br />
Hikita, H., Nuwaysir, E.F., Vaughan, J., Babcock, K., Haas, M.J.,<br />
Dragan, Y.P., Pitot, H.C., 1998. The effect <strong>of</strong> short-term fasting,<br />
phenobarbital <strong>and</strong> refeeding on apoptotic loss, cell replication<br />
<strong>and</strong> gene expression in rat <strong>liver</strong> during the promotion stage.<br />
Carcinogenesis 19 (8), 1417–1425.<br />
Huber, W.W., Grasl-Kraupp, B., Schulte-Hermann, R., 1996.<br />
Hepatocarcinogenic potential <strong>of</strong> di(2-ethylhexyl)phthalate in<br />
rodents <strong>and</strong> its implications on human risk. Crit. Rev. Toxicol.<br />
26 (4), 365–481.<br />
James, S.J., Muskhelishvili, L., 1994. Rates <strong>of</strong> <strong>apoptosis</strong> <strong>and</strong><br />
proliferation vary with caloric intake <strong>and</strong> may influence<br />
incidence <strong>of</strong> spontaneous hepatoma in C57BL/6J × C3H F1<br />
mice. Cancer Res. 54, 5508–5510.<br />
James, N.H., Roberts, R.A., 1996. Species differences in response<br />
to peroxisome proliferators correlate in vitro with induction<br />
<strong>of</strong> DNA synthesis rather than suppression <strong>of</strong> <strong>apoptosis</strong>.<br />
Carcinogenesis 17 (8), 1623–1632.<br />
James, N.H., Soames, A.R., Roberts, R.A., 1998. Suppression <strong>of</strong><br />
hepatocyte <strong>apoptosis</strong> <strong>and</strong> induction <strong>of</strong> DNA synthesis by the<br />
rat <strong>and</strong> <strong>mouse</strong> hepatocarcinogen diethylhexylphlathate (DEHP)<br />
<strong>and</strong> the <strong>mouse</strong> hepatocarcinogen 1,4-dichlorobenzene (DCB).<br />
Arch. Toxicol. 72 (12), 784–790.<br />
Kamendulis, L.M., Kolaja, K.L., Stevenson, D.E., Walborg Jr.,<br />
E.F., Klaunig, J.E., 2001. Comparative effects <strong>of</strong> dieldrin on<br />
hepatic ploidy, cell proliferation, <strong>and</strong> <strong>apoptosis</strong> in rodent <strong>liver</strong>.<br />
J. Toxicol. Environ. Health A 62 (2), 127–141.<br />
Kolaja, K.L., Bunting, K.A., Klaunig, J.E., 1996a. Inhibition<br />
<strong>of</strong> <strong>tumor</strong> promotion <strong>and</strong> hepatocellular <strong>growth</strong> by dietary<br />
restriction in mice. Carcinogenesis 17 (8), 1657–1664.<br />
Kolaja, K.L., Stevenson, D.E., Walborg Jr., E.F., Klaunig, J.E.,<br />
1996b. Selective dieldrin promotion <strong>of</strong> heptic focal lesions in<br />
mice. Carcinogenesis 17, 1243–1250.<br />
Kolaja, K.L., Stevenson, D.E., Walborg Jr., E.F., Klaunig,<br />
J.E., 1996c. Dose dependence <strong>of</strong> phenobarbital promotion <strong>of</strong><br />
preneoplastic hepatic lesions in F344 rats <strong>and</strong> B6C3F1 mice:<br />
effects on DNA synthesis <strong>and</strong> <strong>apoptosis</strong>. Carcinogenesis 17 (5),<br />
947–954.<br />
Kolaja, K.L., Stevenson, D.E., Johnson, J.T., Walborg Jr., E.F.,<br />
Klaunig, J.E., 1996d. Subchronic effects <strong>of</strong> dieldrin <strong>and</strong><br />
phenobarbital on hepatic DNA synthesis in mice <strong>and</strong> rats.<br />
Fundam. Appl. Toxicol. 29 (2), 219–228.<br />
Lee, G.H., 1997. Correlation between Bcl-2 expression<br />
<strong>and</strong> histopathology in diethyl-nitrosamine-induced <strong>mouse</strong><br />
hepatocellular <strong>tumor</strong>s. Am. J. Pathol. 151 (4), 957–961.<br />
Lee, G.H., 2000. Paradoxical effects <strong>of</strong> phenobarbital on <strong>mouse</strong><br />
hepatocarcinogenesis. Toxicol. Pathol. 28 (2), 215–225.<br />
Luebeck, G.E., Grasl-Kraupp, B., Timmermann-Trosiener, I.,<br />
Bursch, W., Schulte-Hermann, R., Moolgavkar, S.H., 1995.<br />
Growth kinetics <strong>of</strong> enzyme altered <strong>liver</strong> foci in rats treated<br />
with phenobarbital or -hexachlorocylohexane. Toxicol. Appl.<br />
Pharmacol. 130, 304–315.<br />
Luebeck, G.E., Buchmann, A., Stinchcombe, S., Moolgavkar, S.H.,<br />
Schwarz, M., 2000. Effects <strong>of</strong> 2,3,7,8-tetrachlorodibenzo-pdioxin<br />
on initiation <strong>and</strong> promotion <strong>of</strong> GST-P-positive foci in<br />
rat <strong>liver</strong>: a quantitative analysis <strong>of</strong> experimental data using a<br />
stochastic model. Toxicol. Appl. Pharmacol. 167 (1), 63–73.<br />
Maronpot, R.R., Boorman, G.A., 1996. The contribution <strong>of</strong> the<br />
<strong>mouse</strong> in hazard identification studies. Toxicol. Pathol. 24,<br />
726–731.<br />
Nims, R.W., Devor, D.E., Henneman, J.R., Lubet, R.A., 1987.<br />
Induction <strong>of</strong> alkoxyresorufin o-dealkylases, epoxide hydrolase,<br />
<strong>and</strong> <strong>liver</strong> weight gain: correlation with <strong>liver</strong> <strong>tumor</strong>-promoting<br />
potential in a series <strong>of</strong> barbiturates. Carcinogenesis 8 (1), 67–<br />
71.<br />
O<strong>liver</strong>, J.D., Roberts, R.A., 2002. Receptor-mediated hepatocarcinogenesis:<br />
role <strong>of</strong> hepatocyte proliferation <strong>and</strong> <strong>apoptosis</strong>.<br />
Pharmacol. Toxicol. 91 (1), 1–7.<br />
Parzefall, W., Kainzbauer, E., Hong-Min, Q., Chabicovsky, M.,<br />
Schulte-Hermann, R., 2002. Response <strong>of</strong> isolated hepatocytes<br />
from carcinogen sensitive (C3H) <strong>and</strong> insensitive mice to signals<br />
inducing replication or <strong>apoptosis</strong>. Arch. Toxicol. 76, 699–706.<br />
Pereira, M.A., 1993. Comparison in C3H <strong>and</strong> C3B6F1<br />
mice <strong>of</strong> the sensitivity to diethylnitrosamine-initiation <strong>and</strong><br />
phenobarbital-promotion to the extent <strong>of</strong> cell proliferation.<br />
Carcinogenesis 14 (2), 299–302.<br />
Pitot, H.C., Hikita, H., Dragan, Y., Sargent, L., Haas, M., 2000.<br />
Review article: the stages <strong>of</strong> gastrointestinal carcinogenesis—<br />
application <strong>of</strong> rodent models to human disease. Aliment.<br />
Pharmacol. Ther. 14 (Suppl 1), 153–160.<br />
S<strong>and</strong>ers, S., Thorgeirsson, S.S., 2000. Promotion <strong>of</strong> hepatocarcinogenesis<br />
by phenobarbital in c-myc/TGF-alpha transgenic<br />
mice. Mol. Carcinog. 28 (3), 168–173.<br />
Schulte-Hermann, R., 1974. Induction <strong>of</strong> <strong>liver</strong> <strong>growth</strong> by xenobiotic<br />
compounds <strong>and</strong> other stimuli. Crit. Rev. Toxicol. 3, 97–158.<br />
Schulte-Hermann, R., Ochs, H., Bursch, W., Parzefall, W., 1988.<br />
Quantitative structure-activity studies on effects <strong>of</strong> 16 different<br />
steroids on <strong>growth</strong> <strong>and</strong> monooxygenases <strong>of</strong> rat <strong>liver</strong>. Cancer<br />
Res. 48, 2462–2468.<br />
Schulte-Hermann, R., Timmermann-Trosiener, I., Barthel, G.,<br />
Bursch, W., 1990. DNA synthesis, <strong>apoptosis</strong>, <strong>and</strong> phenotypic<br />
expression as determinants <strong>of</strong> <strong>growth</strong> <strong>of</strong> altered foci in rat <strong>liver</strong><br />
during phenobarbital promotion. Cancer Res. 50, 5127–5135.<br />
Schwarz, M., Buchmann, A., Stinchcombe, S., Kalkuhl, A., Bock,<br />
K., 2000. Ah receptor lig<strong>and</strong>s <strong>and</strong> <strong>tumor</strong> promotion: survival<br />
<strong>of</strong> neoplastic cells. Toxicol. Lett. 112-113, 69–77.<br />
Stevenson, D.E., Walborg Jr., E.F., North, D.W., Sielken Jr., R.L,<br />
Ross, C.E., Wright, A.S., Xu, Y., Kamendulis, L.M., Klaunig,<br />
J.E., 1999. Monograph: reassessment <strong>of</strong> human cancer risk <strong>of</strong><br />
aldrin/dieldrin. Toxicol. Lett. 109 (3), 123–186.<br />
Tharappel, J.C., Lee, E.Y., Robertson, L.W., Spear, B.T., Glauert,<br />
H.P., 2002. Regulation <strong>of</strong> cell proliferation, <strong>apoptosis</strong>, <strong>and</strong><br />
transcription factor activities during the promotion <strong>of</strong> <strong>liver</strong><br />
carcinogenesis by polychlorinated biphenyls. Toxicol. Appl.<br />
Pharmacol. 179 (3), 172–184.
Tomasi, C., Laconi, E., Laconi, S., Greco, M., Sarma, D.S., Pani, P.,<br />
1999. Effect <strong>of</strong> fasting/refeeding on the incidence <strong>of</strong> chemically<br />
induced hepatocellular carcinoma in the rat. Carcinogenesis<br />
20 (10), 1979–1983.<br />
Turusov, V.S., Turusov, T.S., 1979. Tumors <strong>of</strong> the <strong>liver</strong>, In: Turusov,<br />
V.S. (Ed.), Pathology <strong>of</strong> Tumors in Laboratory Animals. IARC<br />
(International Agency <strong>for</strong> Research on Cancer), Lyon, pp.<br />
193–234.<br />
van Ravenzwaay, B., Tennekes, H., 2002. A Wistar rat strain<br />
prone to spontaneous <strong>liver</strong> <strong>tumor</strong> development: implications<br />
W. Bursch et al. / Toxicology Letters 149 (2004) 25–35 35<br />
<strong>for</strong> carcinogenic risk assessment. Regul. Toxicol. Pharmacol.<br />
36 (1), 86–95.<br />
Wastl, U., Rossmanith, W., Lang, M.A., Camus-R<strong>and</strong>on, A-M.,<br />
Grasl-Kraupp, B., Bursch, W., Schulte-Hermann, R., 1998. Expression<br />
<strong>of</strong> cytochrome P450 2A5 in preneoplastic <strong>and</strong> neoplastic<br />
<strong>mouse</strong> <strong>liver</strong> lesions. Mol. Carcinogenesis 22, 229–234.<br />
Whysner, J., Ross, P.M., Williams, G.M., 1996. Phenobarbital<br />
mechanistic data <strong>and</strong> risk assessment: enzyme induction,<br />
enhanced cell proliferation, <strong>and</strong> <strong>tumor</strong> promotion. Pharmacol.<br />
Ther. 71 (1-2), 153–191.