

Residual Strength and Fatigue Lifetime of ... - Solid Mechanics
Residual Strength and Fatigue Lifetime of ... - Solid Mechanics
Residual Strength and Fatigue Lifetime of ... - Solid Mechanics

Create successful ePaper yourself
Turn your PDF publications into a flip-book with our unique Google optimized e-Paper software.
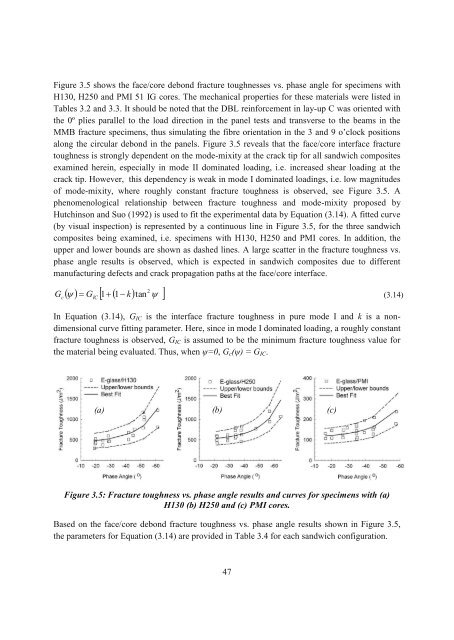
Figure 3.5 shows the face/core debond fracture toughnesses vs. phase angle for specimens with<br />
H130, H250 <strong>and</strong> PMI 51 IG cores. The mechanical properties for these materials were listed in<br />
Tables 3.2 <strong>and</strong> 3.3. It should be noted that the DBL reinforcement in lay-up C was oriented with<br />
the 0º plies parallel to the load direction in the panel tests <strong>and</strong> transverse to the beams in the<br />
MMB fracture specimens, thus simulating the fibre orientation in the 3 <strong>and</strong> 9 o’clock positions<br />
along the circular debond in the panels. Figure 3.5 reveals that the face/core interface fracture<br />
toughness is strongly dependent on the mode-mixity at the crack tip for all s<strong>and</strong>wich composites<br />
examined herein, especially in mode II dominated loading, i.e. increased shear loading at the<br />
crack tip. However, this dependency is weak in mode I dominated loadings, i.e. low magnitudes<br />
<strong>of</strong> mode-mixity, where roughly constant fracture toughness is observed, see Figure 3.5. A<br />
phenomenological relationship between fracture toughness <strong>and</strong> mode-mixity proposed by<br />
Hutchinson <strong>and</strong> Suo (1992) is used to fit the experimental data by Equation (3.14). A fitted curve<br />
(by visual inspection) is represented by a continuous line in Figure 3.5, for the three s<strong>and</strong>wich<br />
composites being examined, i.e. specimens with H130, H250 <strong>and</strong> PMI cores. In addition, the<br />
upper <strong>and</strong> lower bounds are shown as dashed lines. A large scatter in the fracture toughness vs.<br />
phase angle results is observed, which is expected in s<strong>and</strong>wich composites due to different<br />
manufacturing defects <strong>and</strong> crack propagation paths at the face/core interface.<br />
2<br />
tan <br />
G 1 1k Gc IC<br />
(3.14)<br />
In Equation (3.14), GIC is the interface fracture toughness in pure mode I <strong>and</strong> k is a nondimensional<br />
curve fitting parameter. Here, since in mode I dominated loading, a roughly constant<br />
fracture toughness is observed, GIC is assumed to be the minimum fracture toughness value for<br />
the material being evaluated. Thus, when =0, Gc() = GIC.<br />
(a) (b) (c)<br />
Figure 3.5: Fracture toughness vs. phase angle results <strong>and</strong> curves for specimens with (a)<br />
H130 (b) H250 <strong>and</strong> (c) PMI cores.<br />
Based on the face/core debond fracture toughness vs. phase angle results shown in Figure 3.5,<br />
the parameters for Equation (3.14) are provided in Table 3.4 for each s<strong>and</strong>wich configuration.<br />
47


