Residual Strength and Fatigue Lifetime of ... - Solid Mechanics
Residual Strength and Fatigue Lifetime of ... - Solid Mechanics
Residual Strength and Fatigue Lifetime of ... - Solid Mechanics
You also want an ePaper? Increase the reach of your titles
YUMPU automatically turns print PDFs into web optimized ePapers that Google loves.
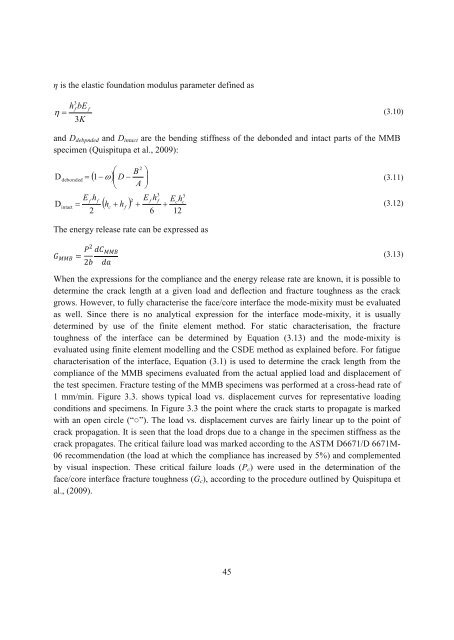
is the elastic foundation modulus parameter defined as<br />
<br />
3<br />
hf bE f<br />
3K<br />
<strong>and</strong> Ddebpnded <strong>and</strong> Dintact are the bending stiffness <strong>of</strong> the debonded <strong>and</strong> intact parts <strong>of</strong> the MMB<br />
specimen (Quispitupa et al., 2009):<br />
45<br />
(3.10)<br />
<br />
2 B <br />
D <br />
<br />
debonded 1 D <br />
A <br />
(3.11)<br />
3 3<br />
E f hf<br />
2 E f hf<br />
Echc<br />
Dintact<br />
hchf <br />
2<br />
6 12<br />
(3.12)<br />
The energy release rate can be expressed as<br />
(3.13)<br />
<br />
When the expressions for the compliance <strong>and</strong> the energy release rate are known, it is possible to<br />
determine the crack length at a given load <strong>and</strong> deflection <strong>and</strong> fracture toughness as the crack<br />
grows. However, to fully characterise the face/core interface the mode-mixity must be evaluated<br />
as well. Since there is no analytical expression for the interface mode-mixity, it is usually<br />
determined by use <strong>of</strong> the finite element method. For static characterisation, the fracture<br />
toughness <strong>of</strong> the interface can be determined by Equation (3.13) <strong>and</strong> the mode-mixity is<br />
evaluated using finite element modelling <strong>and</strong> the CSDE method as explained before. For fatigue<br />
characterisation <strong>of</strong> the interface, Equation (3.1) is used to determine the crack length from the<br />
compliance <strong>of</strong> the MMB specimens evaluated from the actual applied load <strong>and</strong> displacement <strong>of</strong><br />
the test specimen. Fracture testing <strong>of</strong> the MMB specimens was performed at a cross-head rate <strong>of</strong><br />
1 mm/min. Figure 3.3. shows typical load vs. displacement curves for representative loading<br />
conditions <strong>and</strong> specimens. In Figure 3.3 the point where the crack starts to propagate is marked<br />
with an open circle (“”). The load vs. displacement curves are fairly linear up to the point <strong>of</strong><br />
crack propagation. It is seen that the load drops due to a change in the specimen stiffness as the<br />
crack propagates. The critical failure load was marked according to the ASTM D6671/D 6671M-<br />
06 recommendation (the load at which the compliance has increased by 5%) <strong>and</strong> complemented<br />
by visual inspection. These critical failure loads (Pc) were used in the determination <strong>of</strong> the<br />
face/core interface fracture toughness (Gc), according to the procedure outlined by Quispitupa et<br />
al., (2009).


