Residual Strength and Fatigue Lifetime of ... - Solid Mechanics
Residual Strength and Fatigue Lifetime of ... - Solid Mechanics Residual Strength and Fatigue Lifetime of ... - Solid Mechanics
75), which illustrates possible inaccuracies in the measurement of the debond growth at these points due to the negligence of GIII in the debond growth FE routine. 120 135 105 G(J/m 2 ) (a) 165 180 195 150 600 450 300 150 0 90 75 60 45 30 15 0 345 210 330 225 315 240 255 270 300 285 a/b=1.7 a/b=1.4 a/b=1.1 Figure 4.14: Distribution of (a) GI+II and (b) related phase angle in the debond front. 165 180 195 150 120 135 105 60 40 20 0 90 To evaluate the accuracy of the implemented cycle jump method, the fatigue debond propagation simulation was conducted for 500 cycles. To study the effect of the control parameter on the accuracy and computational efficiency of the simulation, simulations with different control parameters, qy, were conducted. A reference simulation, simulating all individual cycles was performed to verify the accuracy of the simulations based on the cycle jump method. The debond growth at different points along the debond front vs. cycles is shown in Figure 4.16 (a) from the reference simulation. Because of a larger strain energy release rate, the debond front in the 0degree position (short radius of the ellipse) grows more than at the other points. The crack 80 () 165 180 195 75 60 150 120 135 105 -5 -6 -7 -8 -9 -10 90 75 60 45 30 15 0 345 210 330 225 315 240 255 270 285 300 a/b=1.7 a/b=1.4 a/b=1.1 45 30 210 330 225 315 240 255 270 300 285 a/b=1.7 a/b=1.4 Figure 4.15: Distribution of mode III strain energy release rate in the debond front. (b) 15 0 345
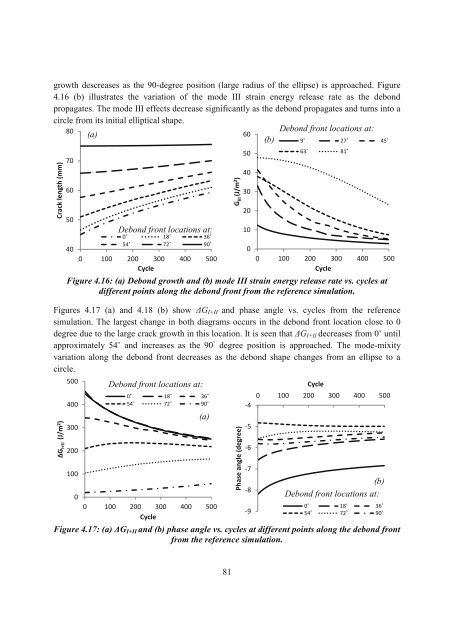
growth descreases as the 90-degree position (large radius of the ellipse) is approached. Figure 4.16 (b) illustrates the variation of the mode III strain energy release rate as the debond propagates. The mode III effects decrease significantly as the debond propagates and turns into a circle from its initial elliptical shape. 80 Debond front locations at: (a) 60 (b) 9 27 45 Crack length (mm) 70 60 50 40 0 18 36 54 72 90 0 100 200 300 400 500 0 100 200 300 400 500 Cycle Cycle Figure 4.16: (a) Debond growth and (b) mode III strain energy release rate vs. cycles at different points along the debond front from the reference simulation. Figures 4.17 (a) and 4.18 (b) show GI+II and phase angle vs. cycles from the reference simulation. The largest change in both diagrams occurs in the debond front location close to 0 degree due to the large crack growth in this location. It is seen that GI+II decreases from 0 until approximately 54 and increases as the 90 degree position is approached. The mode-mixity variation along the debond front decreases as the debond shape changes from an ellipse to a circle. G I+II (J/m 2 ) 500 400 300 200 100 0 Debond front locations at: Debond front locations at: 0 18 36 54 72 90 (a) 0 100 200 300 400 500 Cycle Figure 4.17: (a) GI+II and (b) phase angle vs. cycles at different points along the debond front from the reference simulation. 81 G III (J/m 2 ) Phase angle (degree) 50 40 30 20 10 0 -4 -5 -6 -7 -8 -9 63 81 Cycle 0 100 200 300 400 500 (b) Debond front locations at: 0 18 36 54 72 90
- Page 52 and 53: of contact elements (CONTACT173 and
- Page 54 and 55: the debond opening initially increa
- Page 56 and 57: Table 2.4: Instability loads determ
- Page 58 and 59: G (J/m2) 600 400 200 0 H100 IMP=0.1
- Page 60 and 61: This page is intentionally left bla
- Page 62 and 63: Hayman (2007) has described a damag
- Page 64 and 65: Table 3.1: Panel test specimens. La
- Page 66 and 67: sheet and the core thickness, respe
- Page 68 and 69: Load (N) 250 200 150 100 50 0 H130
- Page 70 and 71: Table 3.4: Parameters in the face/c
- Page 72 and 73: was used to monitor 3D surface disp
- Page 74 and 75: arising due to the junction between
- Page 76 and 77: (a) Debonded face sheet Figure 3.16
- Page 78 and 79: Figure 3.19 shows the determined en
- Page 80 and 81: H130 MMB H130 Panel H250 MMB Interf
- Page 82 and 83: 3.6 Conclusion In this chapter the
- Page 84 and 85: This page is intentionally left bla
- Page 86 and 87: composite laminates under thermal c
- Page 88 and 89: S S y( t ) y( t ) ( t ) 2 1 12 2
- Page 90 and 91: listed in Table 4.1. The length and
- Page 92 and 93: The strain energy release rate, G,
- Page 94 and 95: high growth rate of G (see Figure 4
- Page 96 and 97: 4.4 Face/Core Fatigue Crack Growth
- Page 98 and 99: Debond 310 mm Symmetry B. C. a Figu
- Page 100 and 101: B 2 1/ 2 ( S44 S55 S45) (4.17) wh
- Page 104 and 105: Figure 4.18 (a) presents the deflec
- Page 106 and 107: Debond radius (mm) 100 90 80 70 60
- Page 108 and 109: using the cycle jump method, more t
- Page 110 and 111: Chapter 5 Face/Core Interface Fatig
- Page 112 and 113: of this chapter, sandwich panels wi
- Page 114 and 115: H250 Specimen H100 Specimen H45 Spe
- Page 116 and 117: Figure 5.5: Test setup. Initially,
- Page 118 and 119: H100 Specimen Fibre bridging Figure
- Page 120 and 121: propagation, the crack continues to
- Page 122 and 123: Figure 5.14: Kinking of the crack i
- Page 124 and 125: Crack length [mm] Crack length [mm]
- Page 126 and 127: mode-mixity phase angle was chosen
- Page 128 and 129: should be taken into account for a
- Page 130 and 131: Figure 5.25: Kinking of the crack i
- Page 132 and 133: log (da/dN) (mm/cycle) 10 log G (J/
- Page 134 and 135: erroneous extrapolations in the tra
- Page 136 and 137: compared to the 65% efficiency obta
- Page 138 and 139: the case of uneven debond growth, t
- Page 140 and 141: Load (kN) 2 1.5 1 0.5 0 Panel 1 Pan
- Page 142 and 143: Figure 5.42: Zero and ninety degree
- Page 144 and 145: G(J/m 2 ) 180 150 210 120 150 100 5
- Page 146 and 147: 110 q=qG=0.4 Test #1 100 Test #2 Te
- Page 148 and 149: panels were determined for differen
- Page 150 and 151: Chapter 6 Conclusion and Future Wor
growth descreases as the 90-degree position (large radius <strong>of</strong> the ellipse) is approached. Figure<br />
4.16 (b) illustrates the variation <strong>of</strong> the mode III strain energy release rate as the debond<br />
propagates. The mode III effects decrease significantly as the debond propagates <strong>and</strong> turns into a<br />
circle from its initial elliptical shape.<br />
80<br />
Debond front locations at:<br />
(a)<br />
60<br />
(b) 9 27 45<br />
Crack length (mm)<br />
70<br />
60<br />
50<br />
40<br />
0 18 36<br />
54 72 90<br />
0 100 200 300 400 500<br />
0 100 200 300 400 500<br />
Cycle<br />
Cycle<br />
Figure 4.16: (a) Debond growth <strong>and</strong> (b) mode III strain energy release rate vs. cycles at<br />
different points along the debond front from the reference simulation.<br />
Figures 4.17 (a) <strong>and</strong> 4.18 (b) show GI+II <strong>and</strong> phase angle vs. cycles from the reference<br />
simulation. The largest change in both diagrams occurs in the debond front location close to 0<br />
degree due to the large crack growth in this location. It is seen that GI+II decreases from 0 until<br />
approximately 54 <strong>and</strong> increases as the 90 degree position is approached. The mode-mixity<br />
variation along the debond front decreases as the debond shape changes from an ellipse to a<br />
circle.<br />
G I+II (J/m 2 )<br />
500<br />
400<br />
300<br />
200<br />
100<br />
0<br />
Debond front locations at:<br />
Debond front locations at:<br />
0 18 36<br />
54 72 90<br />
(a)<br />
0 100 200 300 400 500<br />
Cycle<br />
Figure 4.17: (a) GI+II <strong>and</strong> (b) phase angle vs. cycles at different points along the debond front<br />
from the reference simulation.<br />
81<br />
G III (J/m 2 )<br />
Phase angle (degree)<br />
50<br />
40<br />
30<br />
20<br />
10<br />
0<br />
-4<br />
-5<br />
-6<br />
-7<br />
-8<br />
-9<br />
63 81<br />
Cycle<br />
0 100 200 300 400 500<br />
(b)<br />
Debond front locations at:<br />
0 18 36<br />
54 72 90


