

Maria Bayard Dühring - Solid Mechanics
Maria Bayard Dühring - Solid Mechanics
Maria Bayard Dühring - Solid Mechanics

Create successful ePaper yourself
Turn your PDF publications into a flip-book with our unique Google optimized e-Paper software.
y [m]<br />
8<br />
6<br />
4<br />
2<br />
ARTICLE IN PRESS<br />
M.B. <strong>Dühring</strong> et al. / Journal of Sound and Vibration 317 (2008) 557–575 563<br />
Sound pressure amplitude<br />
for initial guess [dB]<br />
0<br />
0 2 4 6 8 10 12 14 16 18<br />
x [m]<br />
110<br />
100<br />
90<br />
80<br />
70<br />
60<br />
60<br />
24 26 28 30 32 34 36 38 40<br />
frequency, f [Hz]<br />
design domain and the natural frequency is now at a lower value than originally. The same tendency is<br />
observed for the example in Fig. 2 where the material is distributed at the nodal lines and the natural<br />
frequency is moved to a lower value. The response at the two target frequencies f ¼ 9:39 and f ¼ 9:71 Hz for<br />
both designs, are given in Table 1 and it is noticed that the objective function is minimized most for both<br />
frequencies in the case where the solid material is placed at the nodal plane. So for the target frequency which<br />
is smaller than the natural frequency the optimization converges to a solution that is not as good as when the<br />
other target frequency is used. The explanation is that a natural frequency, which is originally at one side of<br />
the driving frequency, can only be moved to a value on the same side during the optimization, else the<br />
objective function would have to be increased during a part of the optimization. It is from this example and<br />
the example from Fig. 2 concluded, that when optimizing for a driving frequency close to a natural frequency<br />
there is a tendency for the material to be distributed at the nodal planes for the initial design when the natural<br />
frequency is moved to a lower value. If the natural frequency is moved to a higher value the material is<br />
objective function, Φ [dB]<br />
y [m]<br />
130<br />
120<br />
110<br />
100<br />
8<br />
6<br />
4<br />
2<br />
90<br />
80<br />
70<br />
Sound pressure amplitude<br />
for optimized design [dB]<br />
initial design<br />
optimized design<br />
target frequency<br />
0<br />
0 2 4 6 8 10 12 14 16 18<br />
x [m]<br />
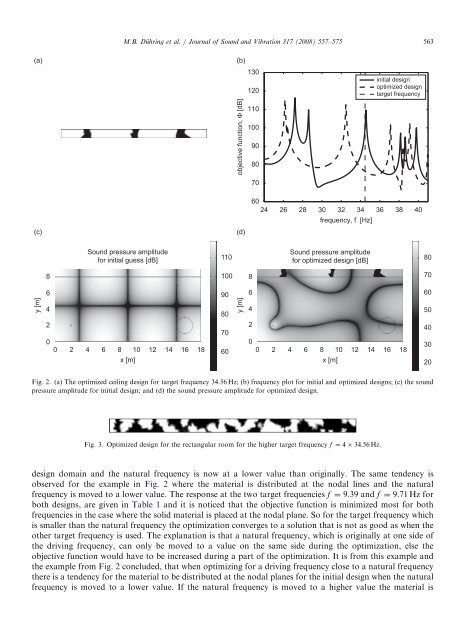
Fig. 2. (a) The optimized ceiling design for target frequency 34.56 Hz; (b) frequency plot for initial and optimized designs; (c) the sound<br />
pressure amplitude for initial design; and (d) the sound pressure amplitude for optimized design.<br />
Fig. 3. Optimized design for the rectangular room for the higher target frequency f ¼ 4 34:56 Hz.<br />
80<br />
70<br />
60<br />
50<br />
40<br />
30<br />
20


