

Maria Bayard Dühring - Solid Mechanics
Maria Bayard Dühring - Solid Mechanics
Maria Bayard Dühring - Solid Mechanics

You also want an ePaper? Increase the reach of your titles
YUMPU automatically turns print PDFs into web optimized ePapers that Google loves.
4.2 Results 23<br />
To obtain better numerical scaling in the optimization process the logarithm is<br />
taken to the objective function, and the sensitivities hence have to be adjusted by<br />
dividing them with Φ. The volume constraint imposes a limit on the amount of<br />
material distributed in Ωd given by the volume fraction β in order to save material.<br />
The initial guess for the optimization is a uniform distribution of solid material in Ωd<br />
with the volume fraction β. A small amount of mass-proportional damping is added<br />
to the problem and the morphology-based filter described in section 3.5 is applied.<br />
Second order Lagrange elements are used for the complex pressure amplitude and<br />
the design variables are discretized by first order Lagrange elements.<br />
4.2 Results<br />
In the first example, the sound barrier is optimized for the octave band center frequency<br />
f = 125 Hz (where f = ω/2π) and the volume fraction β = 0.9. The<br />
performance of the optimized design obtained from the topology optimization is<br />
compared to the performance of a straight and a T-shaped barrier. The two conventional<br />
barriers are centered in the design domain and they both have the same<br />
height as Ωd and the T-shaped barrier has the same width. The increase of the<br />
objective function ∆Φ for the T-shaped barrier and the optimized design is given<br />
in table 4.1 compared to Φ for the straight barrier. It is observed that the Tshaped<br />
barrier reduces the noise slightly more than the straight barrier, which is in<br />
agreement with the literature. The table shows that the objective function for the<br />
optimized design is reduced with more than 9 dB compared to the straight barrier.<br />
The optimized barrier is indicated in figure 4.2(a) and is close to a 0-1 design. The<br />
distribution of the sound pressure amplitude for the optimized design is seen in figure<br />
4.2(b). The sound pressure amplitude is high in the cavity connected to the<br />
right surface, which is acting as a kind of a Helmholtz resonator.<br />
It is also possible to design the sound barrier for a frequency interval using Padé<br />
approximations as described in section 3.3. The next example is thus optimized<br />
for the interval between the two center band frequencies [63;125] Hz with 7 target<br />
frequencies. The volume factor is again β = 0.9 and the objective function Ψ is<br />
reduced from 71.4 dB for the initial guess to 64.4 dB for the optimized design. The<br />
barrier is seen in figure 4.3(a) and it has a cavity on both vertical edges that can act<br />
as Helmholtz resonators. In figure 4.3(b), the value of Φ is plotted as a function of<br />
the frequency f for the optimized design as well as for the straight and the T-shaped<br />
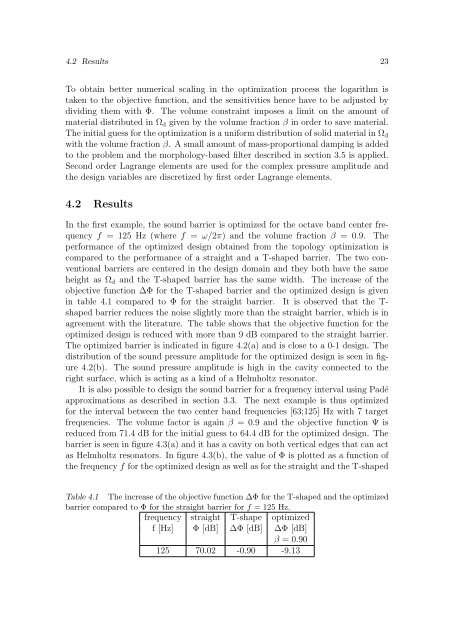
Table 4.1 The increase of the objective function ∆Φ for the T-shaped and the optimized<br />
barrier compared to Φ for the straight barrier for f = 125 Hz.<br />
frequency straight T-shape optimized<br />
f [Hz] Φ [dB] ∆Φ [dB] ∆Φ [dB]<br />
β = 0.90<br />
125 70.02 -0.90 -9.13


