

Maria Bayard Dühring - Solid Mechanics
Maria Bayard Dühring - Solid Mechanics
Maria Bayard Dühring - Solid Mechanics

You also want an ePaper? Increase the reach of your titles
YUMPU automatically turns print PDFs into web optimized ePapers that Google loves.
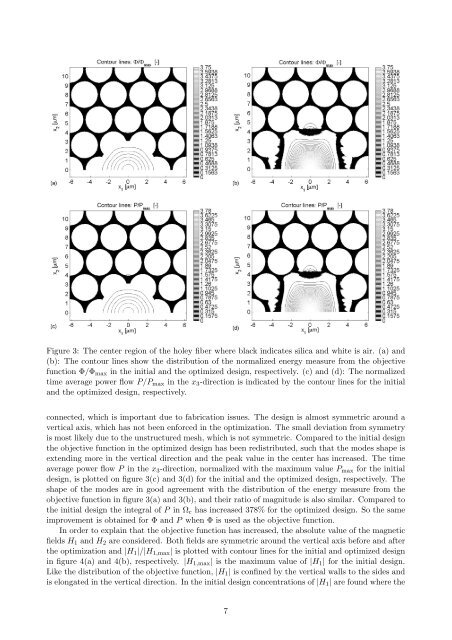
Figure 3: The center region of the holey fiber where black indicates silica and white is air. (a) and<br />
(b): The contour lines show the distribution of the normalized energy measure from the objective<br />
function Φ/Φmax in the initial and the optimized design, respectively. (c) and (d): The normalized<br />
time average power flow P/Pmax in the x3-direction is indicated by the contour lines for the initial<br />
and the optimized design, respectively.<br />
connected, which is important due to fabrication issues. The design is almost symmetric around a<br />
vertical axis, which has not been enforced in the optimization. The small deviation from symmetry<br />
is most likely due to the unstructured mesh, which is not symmetric. Compared to the initial design<br />
the objective function in the optimized design has been redistributed, such that the modes shape is<br />
extending more in the vertical direction and the peak value in the center has increased. The time<br />
average power flow P in the x3-direction, normalized with the maximum value Pmax for the initial<br />
design, is plotted on figure 3(c) and 3(d) for the initial and the optimized design, respectively. The<br />
shape of the modes are in good agreement with the distribution of the energy measure from the<br />
objective function in figure 3(a) and 3(b), and their ratio of magnitude is also similar. Compared to<br />
the initial design the integral of P in Ωc has increased 378% for the optimized design. So the same<br />
improvement is obtained for Φ and P when Φ is used as the objective function.<br />
In order to explain that the objective function has increased, the absolute value of the magnetic<br />
fields H1 and H2 are considered. Both fields are symmetric around the vertical axis before and after<br />
the optimization and |H1|/|H1,max| is plotted with contour lines for the initial and optimized design<br />
in figure 4(a) and 4(b), respectively. |H1,max| is the maximum value of |H1| for the initial design.<br />
Like the distribution of the objective function, |H1| is confined by the vertical walls to the sides and<br />
is elongated in the vertical direction. In the initial design concentrations of |H1| are found where the<br />
7


