

Evaluation of Plastic Waste Management in Thailand Using Material ...
Evaluation of Plastic Waste Management in Thailand Using Material ...
Evaluation of Plastic Waste Management in Thailand Using Material ...

Create successful ePaper yourself
Turn your PDF publications into a flip-book with our unique Google optimized e-Paper software.
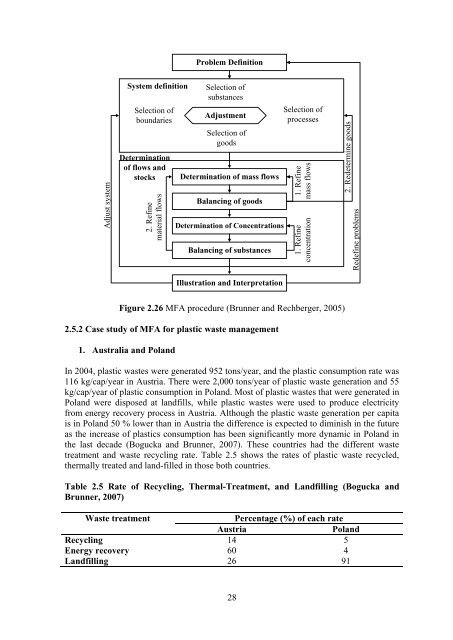
Adjust system<br />
Problem Def<strong>in</strong>ition<br />
System def<strong>in</strong>ition Selection <strong>of</strong><br />
substances<br />
Selection <strong>of</strong><br />
boundaries<br />
Determ<strong>in</strong>ation<br />
<strong>of</strong> flows and<br />
stocks<br />
2. Ref<strong>in</strong>e<br />
material flows<br />
Adjustment<br />
Selection <strong>of</strong><br />
goods<br />
Determ<strong>in</strong>ation <strong>of</strong> mass flows<br />
Balanc<strong>in</strong>g <strong>of</strong> goods<br />
Determ<strong>in</strong>ation <strong>of</strong> Concentrations<br />
Balanc<strong>in</strong>g <strong>of</strong> substances<br />
Illustration and Interpretation<br />
28<br />
Selection <strong>of</strong><br />
processes<br />
1. Ref<strong>in</strong>e<br />
mass flows<br />
1. Ref<strong>in</strong>e<br />
concentration<br />
Figure 2.26 MFA procedure (Brunner and Rechberger, 2005)<br />
2.5.2 Case study <strong>of</strong> MFA for plastic waste management<br />
1. Australia and Poland<br />
In 2004, plastic wastes were generated 952 tons/year, and the plastic consumption rate was<br />
116 kg/cap/year <strong>in</strong> Austria. There were 2,000 tons/year <strong>of</strong> plastic waste generation and 55<br />
kg/cap/year <strong>of</strong> plastic consumption <strong>in</strong> Poland. Most <strong>of</strong> plastic wastes that were generated <strong>in</strong><br />
Poland were disposed at landfills, while plastic wastes were used to produce electricity<br />
from energy recovery process <strong>in</strong> Austria. Although the plastic waste generation per capita<br />
is <strong>in</strong> Poland 50 % lower than <strong>in</strong> Austria the difference is expected to dim<strong>in</strong>ish <strong>in</strong> the future<br />
as the <strong>in</strong>crease <strong>of</strong> plastics consumption has been significantly more dynamic <strong>in</strong> Poland <strong>in</strong><br />
the last decade (Bogucka and Brunner, 2007). These countries had the different waste<br />
treatment and waste recycl<strong>in</strong>g rate. Table 2.5 shows the rates <strong>of</strong> plastic waste recycled,<br />
thermally treated and land-filled <strong>in</strong> those both countries.<br />
Table 2.5 Rate <strong>of</strong> Recycl<strong>in</strong>g, Thermal-Treatment, and Landfill<strong>in</strong>g (Bogucka and<br />
Brunner, 2007)<br />
<strong>Waste</strong> treatment Percentage (%) <strong>of</strong> each rate<br />
Austria Poland<br />
Recycl<strong>in</strong>g 14 5<br />
Energy recovery 60 4<br />
Landfill<strong>in</strong>g 26 91<br />
2. Redeterm<strong>in</strong>e goods<br />
Redef<strong>in</strong>e problems


