Extracting SAR Rules from Compound Data
Extracting SAR Rules from Compound Data
Extracting SAR Rules from Compound Data

Create successful ePaper yourself
Turn your PDF publications into a flip-book with our unique Google optimized e-Paper software.
Extraction of <strong>SAR</strong> <strong>Rules</strong> <strong>from</strong><br />
<strong>Compound</strong> <strong>Data</strong><br />
Jürgen Bajorath<br />
Department of Life Science Informatics<br />
LIMES Program Chemical Biology and Medicinal Chemistry<br />
University of Bonn<br />
How to extract <strong>SAR</strong> information <strong>from</strong><br />
compound data sets?<br />
Systematically<br />
With the aid of graphical representations
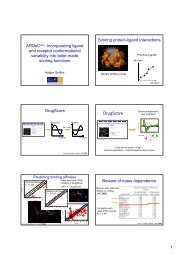
Basic <strong>SAR</strong> Concepts<br />
6 nM 6 nM<br />
<strong>SAR</strong> continuity<br />
distinct structures with<br />
similar potency<br />
<strong>SAR</strong> discontinuity<br />
similar structures with<br />
highly different potency<br />
(“activity cliff”)<br />
continuity<br />
discontinuity<br />
2.3 µM<br />
Concept of Activity Landscapes<br />
“Activity landscapes”: biological activity hypersurfaces<br />
within chemical space;<br />
visualized as a 2D projection of chemical space with<br />
compound potency as the third dimension
Idealized Activity Landscapes and <strong>SAR</strong>s<br />
Continuous <strong>SAR</strong> Discontinuous <strong>SAR</strong><br />
gradual changes in<br />
structure result in moderate<br />
changes in activity<br />
“rolling hills”<br />
Basic <strong>SAR</strong> Concepts<br />
small changes in<br />
structure have dramatic<br />
effects on activity<br />
“activity cliffs”<br />
6 nM 6 nM<br />
Coexistence of<br />
continuous and<br />
discontinuous <strong>SAR</strong><br />
components:<br />
<strong>SAR</strong> heterogeneity<br />
corresponding to<br />
variable activity landscapes<br />
continuity<br />
discontinuity<br />
2.3 µM
y<br />
Variable Activity Landscapes<br />
Cathepsin S inhibitors<br />
potency<br />
- not idealized, but calculated -<br />
“Coordinate-free” chemical<br />
space (MACCS Tanimoto<br />
coefficient distances)<br />
2D projection through multidimensional<br />
scaling<br />
xy-plane: MACCS<br />
Tanimoto similarity-based<br />
projection<br />
z-axis: interpolation of<br />
potency values<br />
color code: surface<br />
elevation<br />
Activity Landscapes and <strong>SAR</strong>s<br />
Cathepsin S inhibitors<br />
x<br />
2D projection of an activity<br />
landscape<br />
points represent molecules<br />
color: potency<br />
(red: high, green: low)<br />
area shaded according to<br />
interpolated potency
Activity Landscapes and <strong>SAR</strong>s<br />
Cathepsin S inhibitors<br />
Cathepsin S inhibitors<br />
2D vs. 3D landscape<br />
representation<br />
Activity Landscapes and <strong>SAR</strong>s<br />
0.1 nM<br />
Activity cliff formed by highly<br />
and weakly potent molecules<br />
10 μM
Systematic <strong>SAR</strong> Analysis<br />
What do we like to learn ?<br />
Activity cliffs<br />
<strong>SAR</strong> microenvironments<br />
subsets of compounds<br />
representing different local <strong>SAR</strong>s<br />
Graph Representations<br />
Discontinuous <strong>SAR</strong><br />
components<br />
lead optimization<br />
Continuous <strong>SAR</strong><br />
components<br />
Q<strong>SAR</strong>, lead hopping<br />
Basic data<br />
A list of compounds<br />
with potency values<br />
pairwise comparison
Graph Representations<br />
⎛ 1 ⎞<br />
cont = weighted mean ⎜ ⎟<br />
{ i , j i > j } ⎝ 1 + sim (i,j) ⎠<br />
P i ⋅ P j<br />
weight ij =<br />
1 + P − P<br />
i<br />
j<br />
disc =<br />
1<br />
<strong>SAR</strong>I −<br />
2<br />
= ( cont − ( 1 disc ) )<br />
Common features<br />
edges determined by<br />
2D structural similarity<br />
potency used as<br />
node annotation<br />
<strong>SAR</strong> Index Scoring - Annotation<br />
Numerical function to characterize <strong>SAR</strong> features<br />
continuity score<br />
emphasizes structurally<br />
diverse compounds having<br />
similar potency<br />
balances<br />
two parts<br />
GLOBAL SCORE<br />
all possible compound pairs<br />
mean P i j<br />
⎪⎧<br />
⎪⎧<br />
i > j , P Pi<br />
Pj<br />
1,<br />
⎪⎫<br />
i − −Pj<br />
> 1,<br />
⎪⎫<br />
⎨ i , j<br />
⎬<br />
⎪⎩ ⎪⎩ sim( i , j ) > 0 . 65 65⎪⎭<br />
⎪⎭<br />
( − P ⋅ sim( i , j ) )<br />
(P, potency; sim,<br />
pairwise 2D similarity)<br />
discontinuity score<br />
emphasizes similar<br />
compounds with large<br />
potency differences
<strong>SAR</strong> Index Scoring<br />
Numerical function to characterize <strong>SAR</strong> features<br />
node size scaling<br />
high compound score<br />
low compound score<br />
reflects the potency<br />
deviation of a compound<br />
<strong>from</strong> its structurally<br />
similar neighbors<br />
LOCAL SCORE<br />
pairs formed by a given compound<br />
disc<br />
( )<br />
i j<br />
= mean P i − P<br />
{ j sim( i , j ) > t , i ≠ j }<br />
( ⋅ sim ( i , j ) )<br />
discontinuity score<br />
emphasizes similar<br />
compounds with large<br />
potency differences<br />
Network-like Similarity Graph (NSG)<br />
Exemplary graphical<br />
<strong>SAR</strong> analysis method
Network-like Similarity Graph<br />
Network-like Similarity Graph<br />
NSG for a set of<br />
squalene synthese<br />
inhibitors<br />
Annotated graph<br />
representation of<br />
similarity relationships<br />
in compound data sets<br />
Nodes: represent all<br />
compounds in the data set<br />
Edges: connect nodes with<br />
high pairwise similarity<br />
Clusters: Ward’s hierachical<br />
clustering (gray background)<br />
Layout: Fruchterman-Reingold<br />
Annotated graph<br />
representation of<br />
similarity relationships<br />
in compound data sets<br />
Annotations:<br />
node size<br />
cluster scores<br />
global scores
NSG – Score Annotations<br />
node size compound compound compound compound<br />
discontinuity discontinuity discontinuity discontinuity score score score score<br />
cluster scores <strong>SAR</strong> <strong>SAR</strong> <strong>SAR</strong> <strong>SAR</strong> Index Index Index Index for for for for<br />
compound compound compound compound clusters clusters clusters clusters<br />
global scores <strong>SAR</strong> <strong>SAR</strong> <strong>SAR</strong> <strong>SAR</strong> Index Index Index Index for for for for the the the the entire entire entire entire<br />
compound compound compound compound set set set set<br />
highlights compounds that<br />
introduce <strong>SAR</strong> discontinuity/<br />
activity cliffs in a data set<br />
indicates the level of<br />
continuity/discontinuity in a<br />
group of similar compounds<br />
indicates the level of<br />
continuity/discontinuity in the<br />
data set<br />
NSG Interpretation - Local <strong>SAR</strong> Features
Activity Cliff Index<br />
NSGs provide interactive<br />
graphical access to prominent<br />
activity cliffs<br />
Cliff Index (CI) enables<br />
systematic mining and ranking<br />
of activity cliffs<br />
CI prioritizes pairs of similar<br />
compounds having large<br />
potency differences:<br />
( ) i j P P j i ⋅<br />
+<br />
2<br />
1 sim( , )<br />
j i −<br />
= CI( , )<br />
CI = 15.2<br />
<strong>SAR</strong> Pathways <strong>from</strong> NSGs<br />
Pathways are annotated with compound<br />
discontinuity scores to emphasize compounds<br />
forming activtiy cliffs<br />
7 μM<br />
CI = 13.4<br />
activity cliff marker<br />
1 μM<br />
0.015 nM<br />
A sequence of pairwise<br />
similar compounds with<br />
balanced chemical and<br />
activity similarity<br />
potency<br />
increases <strong>from</strong> start to end<br />
node<br />
potency gradient<br />
smooth gradients are preferred
<strong>SAR</strong> Pathways<br />
Cytochrome P450<br />
2C19 PubChem<br />
screening data set<br />
Preferred pathways with:<br />
pairwise similar compounds<br />
scaffold hop<br />
Pathway <strong>SAR</strong> Model<br />
small increase in potency per compound<br />
large potency difference between start- and endpoint<br />
smooth potency gradient<br />
many compounds<br />
deviation deviation <strong>from</strong> a linear<br />
potency increase<br />
number number number of of compounds compounds in<br />
the pathway<br />
Pathways are based on<br />
a predefined <strong>SAR</strong> model<br />
potency potency<br />
potency<br />
difference<br />
difference<br />
between<br />
start- and<br />
endpoint
<strong>SAR</strong> Trees<br />
Cytochrome P450<br />
2C19 PubChem<br />
screening data set<br />
<strong>SAR</strong> Trees<br />
<strong>SAR</strong> Trees provide a<br />
structural context for<br />
individual pathways<br />
Activity cliff pathways<br />
can be monitored<br />
A set of pathways<br />
organized in a tree<br />
root<br />
all pathways begin (or lead to)<br />
the same compound<br />
branches<br />
identical pathway sections are<br />
fused into one branch<br />
leaves<br />
endpoints of potency gradients<br />
(highest/lowest potent<br />
compounds)<br />
activity cliff
Advanced Application: Studying<br />
Multi-target <strong>SAR</strong>s Using NSGs<br />
NSGs can also be utilized<br />
to compare <strong>SAR</strong> behavior<br />
for multiple targets<br />
Node color reflects<br />
compound selectivity<br />
instead of potency<br />
From Activity Cliffs to Selectivity Cliffs<br />
Multi-target <strong>SAR</strong>s<br />
Target-pair selectivity:<br />
difference between<br />
logarithmic potency<br />
SA / B(<br />
i)<br />
= −SB<br />
/ A = PA(<br />
i)<br />
− PB<br />
( i)<br />
Structure-selectivity<br />
relationships (SSRs)<br />
cathepsin L<br />
cathepsin B<br />
pIC50 = 9 pIC50 = 7<br />
S L/B = 2
<strong>SAR</strong> and SSR Network Analysis<br />
cathepsin L<br />
0.48<br />
0.05<br />
Potency-based NSG<br />
Potency:<br />
10.4 3.0<br />
<strong>Compound</strong> discontinuity score:<br />
1<br />
0<br />
activity cliff markers<br />
Cluster discontinuity score<br />
<strong>SAR</strong> and SSR Network Analysis<br />
cathepsin L<br />
0.48<br />
0.05<br />
cathepsin B<br />
1<br />
0<br />
“rough” <strong>SAR</strong><br />
“smooth” <strong>SAR</strong><br />
0.10<br />
0.27
<strong>SAR</strong> and SSR Network Analysis<br />
cathepsin L /<br />
cathepsin B<br />
0.73<br />
0.72 1<br />
Local SSR Environments<br />
cathepsin L /<br />
cathepsin B<br />
0.73<br />
0.72<br />
Selectivity-based NSG<br />
Selectivity:<br />
3.2 (L) – 3.2 (B)<br />
<strong>Compound</strong> discontinuity score:<br />
1<br />
0<br />
selectivity cliff markers<br />
Cluster discontinuity score<br />
0<br />
“rough” SSR<br />
“smooth” SSR<br />
discontinuous SSR
Activity Cliffs vs. Selectivity Cliffs<br />
L B L/B<br />
discontinuous <strong>SAR</strong> continuous <strong>SAR</strong><br />
L: 15 nM<br />
B: 3.5 μM<br />
L/B: 1.4<br />
discontinuous SSR<br />
activity cliff markers selectivity cliff markers<br />
Local SSR Environments<br />
cathepsin L /<br />
cathepsin B<br />
0.73<br />
0.72<br />
L: 10 μM<br />
B: 170 nM<br />
L/B: -1.8<br />
discontinuous SSR
Activity Cliffs vs. Selectivity Cliffs<br />
L B L/B<br />
continuous <strong>SAR</strong> continuous <strong>SAR</strong><br />
L: 3.6 μM<br />
B: 102 μM<br />
L/B: 1.5<br />
Selectivity Determinants<br />
L/B<br />
discontinuous SSR<br />
selectivity cliff markers<br />
L: 26 μM<br />
B: 5.3 μM<br />
L/B: -0.7<br />
Molecules with different selectivity are found in the neighborhood of<br />
selectivity cliff markers<br />
Selectivity rules can be formulated<br />
sel: -0.7<br />
sel: 0.1<br />
halogens with increasing<br />
bulkiness and decreasing<br />
electronegativity shift<br />
selectivity toward cat L<br />
sel: 1.5<br />
sel: 2.0
Selectivity Determinants<br />
sel: 2.3<br />
Conclusions<br />
K/L<br />
bulkier substituents shift<br />
selectivity towards cat L<br />
sel: -0.6<br />
sel: -0.8<br />
sel: -0.8<br />
Numerical and graphical analysis tools are developed for<br />
mining of <strong>SAR</strong> information in compound data sets<br />
Annotated similarity-based compound networks play an<br />
important role for graphical <strong>SAR</strong> analysis<br />
NSGs enable a systematic comparison of global and local<br />
<strong>SAR</strong> features in compound data sets and the identification<br />
of activity cliffs<br />
<strong>SAR</strong> Trees are based on pre-defined <strong>SAR</strong> model<br />
NSG enable a comparative analysis of multi-target <strong>SAR</strong>s