OMEGA Release 2.5.1.4 OpenEye Scientific Software, Inc.
OMEGA Release 2.5.1.4 OpenEye Scientific Software, Inc.
OMEGA Release 2.5.1.4 OpenEye Scientific Software, Inc.

Create successful ePaper yourself
Turn your PDF publications into a flip-book with our unique Google optimized e-Paper software.
<strong>OMEGA</strong>, <strong>Release</strong> <strong>2.5.1.4</strong><br />
the test for the foo virus. Further, we may want to eliminate people who acknowledge that they will refuse treatment<br />
for the foo virus even if we determine that they do have it. By these admittedly simple screens, we apply the test for<br />
the foo virus to a much smaller group with a decidedly higher prevalence of the virus. For instance, after the filtering,<br />
we may be left with a group of only 1,000 people who have a 1 in 200 chance of having the syndrome. Now, we still<br />
have the same 5 people who actually have the disease, but we only expect 1 false positive test. Suddenly, there are 6<br />
total positive tests, and 83% of them actually have the syndrome! This is reflected in a much more reasonable (83%)<br />
positive predictive value.<br />
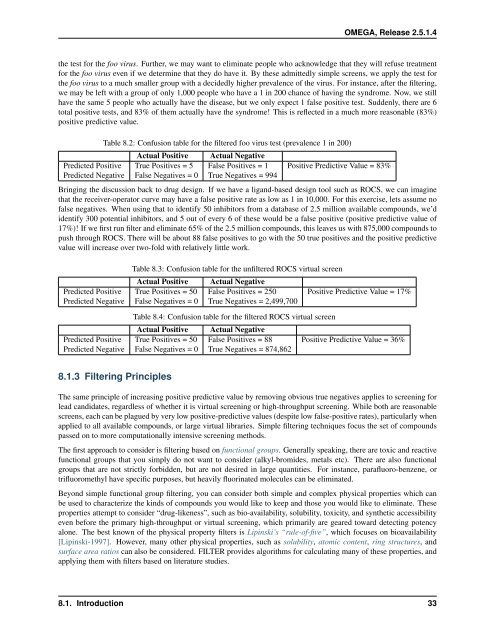
Table 8.2: Confusion table for the filtered foo virus test (prevalence 1 in 200)<br />
Actual Positive Actual Negative<br />
Predicted Positive True Positives = 5 False Positives = 1 Positive Predictive Value = 83%<br />
Predicted Negative False Negatives = 0 True Negatives = 994<br />
Bringing the discussion back to drug design. If we have a ligand-based design tool such as ROCS, we can imagine<br />
that the receiver-operator curve may have a false positive rate as low as 1 in 10,000. For this exercise, lets assume no<br />
false negatives. When using that to identify 50 inhibitors from a database of 2.5 million available compounds, we’d<br />
identify 300 potential inhibitors, and 5 out of every 6 of these would be a false positive (positive predictive value of<br />
17%)! If we first run filter and eliminate 65% of the 2.5 million compounds, this leaves us with 875,000 compounds to<br />
push through ROCS. There will be about 88 false positives to go with the 50 true positives and the positive predictive<br />
value will increase over two-fold with relatively little work.<br />
Table 8.3: Confusion table for the unfiltered ROCS virtual screen<br />
Actual Positive Actual Negative<br />
Predicted Positive True Positives = 50 False Positives = 250 Positive Predictive Value = 17%<br />
Predicted Negative False Negatives = 0 True Negatives = 2,499,700<br />
Table 8.4: Confusion table for the filtered ROCS virtual screen<br />
Actual Positive Actual Negative<br />
Predicted Positive True Positives = 50 False Positives = 88 Positive Predictive Value = 36%<br />
Predicted Negative False Negatives = 0 True Negatives = 874,862<br />
8.1.3 Filtering Principles<br />
The same principle of increasing positive predictive value by removing obvious true negatives applies to screening for<br />
lead candidates, regardless of whether it is virtual screening or high-throughput screening. While both are reasonable<br />
screens, each can be plagued by very low positive-predictive values (despite low false-positive rates), particularly when<br />
applied to all available compounds, or large virtual libraries. Simple filtering techniques focus the set of compounds<br />
passed on to more computationally intensive screening methods.<br />
The first approach to consider is filtering based on functional groups. Generally speaking, there are toxic and reactive<br />
functional groups that you simply do not want to consider (alkyl-bromides, metals etc). There are also functional<br />
groups that are not strictly forbidden, but are not desired in large quantities. For instance, parafluoro-benzene, or<br />
trifluoromethyl have specific purposes, but heavily fluorinated molecules can be eliminated.<br />
Beyond simple functional group filtering, you can consider both simple and complex physical properties which can<br />
be used to characterize the kinds of compounds you would like to keep and those you would like to eliminate. These<br />
properties attempt to consider “drug-likeness”, such as bio-availability, solubility, toxicity, and synthetic accessibility<br />
even before the primary high-throughput or virtual screening, which primarily are geared toward detecting potency<br />
alone. The best known of the physical property filters is Lipinski’s “rule-of-five”, which focuses on bioavailability<br />
[Lipinski-1997]. However, many other physical properties, such as solubility, atomic content, ring structures, and<br />
surface area ratios can also be considered. FILTER provides algorithms for calculating many of these properties, and<br />
applying them with filters based on literature studies.<br />
8.1. Introduction 33