A comparison of Lea Symbol vs ETDRS letter distance visual acuity ...
A comparison of Lea Symbol vs ETDRS letter distance visual acuity ...
A comparison of Lea Symbol vs ETDRS letter distance visual acuity ...

Create successful ePaper yourself
Turn your PDF publications into a flip-book with our unique Google optimized e-Paper software.
A <strong>comparison</strong> <strong>of</strong> <strong>Lea</strong> <strong>Symbol</strong> <strong>vs</strong> <strong>ETDRS</strong> <strong>letter</strong><br />
<strong>distance</strong> <strong>visual</strong> <strong>acuity</strong> in a population <strong>of</strong> young<br />
children with a high prevalence <strong>of</strong> astigmatism<br />
Velma Dobson, PhD, Candice E. Clifford-Donaldson, MPH, Joseph M. Miller, MD, MPH,<br />
Katherine A. Garvey, OD, and Erin M. Harvey, PhD<br />
PURPOSE To compare <strong>visual</strong> <strong>acuity</strong> results obtained by use <strong>of</strong> the <strong>Lea</strong> <strong>Symbol</strong>s chart with results obtained<br />
with Early Treatment Diabetic Retinopathy Study (<strong>ETDRS</strong>) charts in young children<br />
who are members <strong>of</strong> a population with a high prevalence <strong>of</strong> astigmatism.<br />
METHODS Subjects were 438 children ages 5 through 7 years who were enrolled in kindergarten or<br />
first grade on the Tohono O’odham Reservation: 241 (55%) had astigmatism$1.00 D<br />
in one or both eyes (range, 0.00-6.75 D). While wearing best correction, each child had<br />
right eye <strong>visual</strong> <strong>acuity</strong> tested with the 62 cm by 65 cm <strong>Lea</strong> <strong>Symbol</strong>s chart at 3 m and<br />
with the 62 cm by 65 cm <strong>ETDRS</strong> chart at 4 m. Visual <strong>acuity</strong> was scored as the smallest optotype<br />
size at which the child correctly identified 3 <strong>of</strong> a maximum <strong>of</strong> 5 optotypes. <strong>ETDRS</strong><br />
<strong>visual</strong> <strong>acuity</strong> also was scored based on the total number <strong>of</strong> <strong>letter</strong>s that the child correctly<br />
identified.<br />
RESULTS Correlation between <strong>Lea</strong> <strong>Symbol</strong>s <strong>visual</strong> <strong>acuity</strong> and <strong>ETDRS</strong> <strong>visual</strong> <strong>acuity</strong> was 0.78 (p\<br />
0.001). Mean <strong>Lea</strong> <strong>Symbol</strong>s <strong>visual</strong> <strong>acuity</strong> was one-half line (0.04-0.06 logMAR) better<br />
than mean <strong>ETDRS</strong> <strong>visual</strong> <strong>acuity</strong> (p\0.001). The difference between <strong>Lea</strong> <strong>Symbol</strong>s and<br />
<strong>ETDRS</strong> <strong>visual</strong> <strong>acuity</strong> was not correlated with the mean <strong>of</strong> the <strong>Lea</strong> <strong>Symbol</strong>s and <strong>ETDRS</strong><br />
<strong>visual</strong> <strong>acuity</strong> scores, which ranged from 0.3 logMAR (20/10) to 0.74 logMAR (20/110).<br />
CONCLUSIONS In this population <strong>of</strong> young children, in whom the primary source <strong>of</strong> reduced <strong>visual</strong> <strong>acuity</strong><br />
is astigmatism-related amblyopia, the <strong>Lea</strong> <strong>Symbol</strong>s chart produced <strong>visual</strong> <strong>acuity</strong> scores that<br />
were about 0.5 line better than <strong>visual</strong> <strong>acuity</strong> scores obtained with <strong>ETDRS</strong> charts.<br />
( J AAPOS 2009;13:253-257)<br />
The Early Treatment Diabetic Retinopathy Study<br />
(<strong>ETDRS</strong>) charts 1 are considered to be a gold<br />
standard for assessment <strong>of</strong> <strong>visual</strong> <strong>acuity</strong> because<br />
the charts meet the Committee on Vision standards for assessment<br />
<strong>of</strong> <strong>visual</strong> <strong>acuity</strong> 2 through the use <strong>of</strong> optotypes<br />
(Sloan <strong>letter</strong>s) equivalent in difficulty to the Landolt ring,<br />
through a spacing <strong>of</strong> 0.1 log unit in optotype size between<br />
lines, and through proportional spacing between optotypes<br />
on each line. However, <strong>ETDRS</strong> charts may not be usable<br />
Author affiliations: Department <strong>of</strong> Ophthalmology and Vision Science, the University <strong>of</strong><br />
Arizona, Tucson, Arizona<br />
Supported by grant U10 EY13153 (EMH) from the National Eye Institute <strong>of</strong> the<br />
National Institutes <strong>of</strong> Health, Department <strong>of</strong> Health and Human Services; by unrestricted<br />
funds to the Department <strong>of</strong> Ophthalmology and Vision Science from Research to Prevent<br />
Blindness (JMM); and by a Career Development Award from Research to Prevent<br />
Blindness (EMH).<br />
Presented in part at the 2007 Annual Meeting <strong>of</strong> the Association for Research in Vision<br />
and Ophthalmology, Fort Lauderdale, Florida, May 6-10.<br />
Study conducted at the University <strong>of</strong> Arizona.<br />
Submitted September 16, 2008.<br />
Revision accepted January 23, 2009.<br />
Published online April 16, 2009.<br />
Reprint requests: Velma Dobson, PhD, Department <strong>of</strong> Ophthalmology and Vision Science,<br />
University <strong>of</strong> Arizona 655 N. Alvernon Way, Ste. 108, Tucson, AZ 85711 (email:<br />
vdobson@eyes.arizona.edu).<br />
CopyrightÓ2009 by the American Association for Pediatric Ophthalmology and<br />
Strabismus.<br />
1091-8531/2009/$36.00 1 0<br />
doi:10.1016/j.jaapos.2009.01.007<br />
with preschool-aged children because <strong>of</strong> the difficulty<br />
young children have in identifying the 10 <strong>letter</strong>s on the<br />
chart. The <strong>Lea</strong> <strong>Symbol</strong>s chart 3 was developed to provide<br />
a chart that conforms to the Committee on Vision standards<br />
2 and that can be used with children too young to<br />
be tested with Sloan <strong>letter</strong>s or Landolt rings. It uses optotypes<br />
(square, circle, house, heart) that are sized to provide<br />
<strong>acuity</strong> scores equivalent to scores based on an adult eye<br />
chart, 3 lines that progress in 0.1 log unit steps, and optotypes<br />
that are spaced proportionally.<br />
Previous studies have found that in older children and<br />
adults <strong>Lea</strong> <strong>Symbol</strong>s <strong>visual</strong> <strong>acuity</strong> is 0.5 to 2 lines better<br />
than <strong>visual</strong> <strong>acuity</strong> measured with non-logMAR Landolt C<br />
charts 4 or with Bailey-Lovie logMAR <strong>letter</strong> charts 5 and<br />
that the difference is greater for poorer <strong>acuity</strong> scores than<br />
for better scores. 4,5 In addition, preliminary results from<br />
first-grade children found <strong>Lea</strong> <strong>Symbol</strong>s <strong>visual</strong> <strong>acuity</strong> to<br />
be approximately 0.5 line better than <strong>ETDRS</strong> <strong>visual</strong> <strong>acuity</strong>.<br />
6 However, there have been no large-scale <strong>comparison</strong>s<br />
<strong>of</strong> <strong>visual</strong> <strong>acuity</strong> results obtained with <strong>Lea</strong> <strong>Symbol</strong>s and<br />
<strong>ETDRS</strong> charts in the same individuals.<br />
The present report aims to compare best-corrected <strong>visual</strong><br />
<strong>acuity</strong> results obtained by use <strong>of</strong> the <strong>Lea</strong> <strong>Symbol</strong>s chart<br />
with results obtained with an <strong>ETDRS</strong> chart in a large sample<br />
<strong>of</strong> young children. These children are members <strong>of</strong><br />
Journal <strong>of</strong> AAPOS 253
254 Dobson et al Volume 13 Number 3 / June 2009<br />
a Native American tribe (Tohono O’odham) that is known<br />
to have a high prevalence <strong>of</strong> astigmatism and astigmatismrelated<br />
amblyopia. 7-9<br />
Methods<br />
Subjects<br />
Subjects were 482 children who were enrolled in kindergarten or<br />
first grade in a school on the Tohono O’odham Reservation in<br />
southern Arizona during the 2005/2006, 2006/2007, or 2007/<br />
2008 academic years. All were participants in a longitudinal study<br />
<strong>of</strong> the development and treatment <strong>of</strong> astigmatism-related amblyopia,<br />
in children age 6 months through first grade. All study<br />
participants who are at least 3 years <strong>of</strong> age undergo an eye<br />
examination with cycloplegic refraction, followed by assessment<br />
<strong>of</strong> <strong>visual</strong> <strong>acuity</strong> and other aspects <strong>of</strong> <strong>visual</strong> function while wearing<br />
spectacles containing best correction. Although some children<br />
completed exams during more than one academic year, only<br />
data from the first eye examination were used in the analyses.<br />
The study was approved by the Tohono O’odham Nation and<br />
by the Institutional Review Board <strong>of</strong> the University <strong>of</strong> Arizona<br />
and conformed to the requirements <strong>of</strong> the United States Health<br />
Insurance Portability and Accountability Act. Parents provided<br />
written informed consent before the child’s participation.<br />
Procedures<br />
Each subject was scheduled to participate in 2 testing sessions.<br />
The first session, which was conducted by a pediatric ophthalmologist<br />
(JMM) or optometrist (KG), included cycloplegic refraction<br />
40 to 60 minutes after instillation <strong>of</strong> 1 drop <strong>of</strong> proparacaine<br />
(0.5%) followed by 2 drops <strong>of</strong> cyclopentolate (1%) 5 minutes<br />
apart. Children were prescribed spectacles if they had astigmatism<br />
$2.00 D in either eye or if they had uncorrected <strong>letter</strong> <strong>visual</strong> <strong>acuity</strong><br />
(measured during the first session) worse than 20/20 in either<br />
eye and met one or more <strong>of</strong> the following criteria in either eye:<br />
myopia$0.75 D in either meridian, hyperopia$4.00 D in either<br />
meridian, astigmatism $1.00 D, or anisometropia .1.50 D<br />
spherical equivalent. 10 Correction <strong>of</strong> hyperopic refractive error<br />
was reduced by one-third or by 1.00 D, whichever was greater. 11<br />
The second session, conducted several weeks after the eye examination,<br />
included assessment <strong>of</strong> best-corrected <strong>visual</strong> <strong>acuity</strong><br />
<strong>of</strong> the right eye with <strong>Lea</strong> <strong>Symbol</strong>s charts (Precision Vision, Inc.,<br />
La Salle, IL) 3 and assessment <strong>of</strong> best-corrected logMAR <strong>letter</strong> <strong>visual</strong><br />
<strong>acuity</strong> <strong>of</strong> both the right eye and left eye with the <strong>ETDRS</strong><br />
charts. 1 During <strong>visual</strong> <strong>acuity</strong> testing, all subjects wore spectacles<br />
containing best correction to minimize variability <strong>of</strong> accommodative<br />
demand across subjects and to mask testers to which children<br />
had refractive error high enough that they were prescribed spectacles.<br />
Children who did not meet the prescribing criteria for<br />
spectacles wore a pair <strong>of</strong> ‘‘stock’’ spectacles that contained right<br />
and left lenses with no more than 0.50 vector dioptric difference<br />
12-14 from the child’s cycloplegic refraction with reduction<br />
<strong>of</strong> hyperopia correction, as noted above. Children for whom spectacles<br />
had been prescribed wore their new spectacles for the first<br />
time during vision testing; these spectacles were dispensed to the<br />
children at the end <strong>of</strong> the vision testing session.<br />
After fitting <strong>of</strong> the spectacles to be worn during vision testing,<br />
the child’s left eye was occluded with 5 cm wide adhesive paper<br />
tape (3M Micropore, Minneapolis, MN), and the spectacles<br />
were placed on the child’s face. Then, a study-trained vision tester<br />
measured the <strong>Lea</strong> <strong>Symbol</strong>s <strong>visual</strong> <strong>acuity</strong> <strong>of</strong> the right eye <strong>of</strong> each<br />
child at a <strong>distance</strong> <strong>of</strong> 3 m by using a 62 cm by 65 cm logMAR chart<br />
with 5 symbols per line, mounted in an illuminator cabinet (Precision<br />
Vision, Inc., LaSalle, IL). Immediately thereafter, the<br />
trained vision tester measured the <strong>ETDRS</strong> <strong>visual</strong> <strong>acuity</strong> <strong>of</strong> the<br />
right eye and the left eye at a <strong>distance</strong> <strong>of</strong> 4 m by using a 62 cm<br />
by 65 cm logMAR chart (Precision Vision Inc., LaSalle, IL; Chart<br />
1 for the right eye, Chart 2 for the left eye) with five <strong>letter</strong>s per<br />
line, mounted in the illuminator cabinet. The protocol <strong>of</strong> the longitudinal<br />
study in which the children were enrolled required testing<br />
<strong>of</strong> <strong>Lea</strong> <strong>Symbol</strong>s <strong>acuity</strong> prior to testing <strong>of</strong> <strong>ETDRS</strong> <strong>acuity</strong>.<br />
Vision testing began with the top line on the chart (20/200).<br />
The child was asked to name, or to match to symbols on a lap<br />
card, the symbols on each line on the <strong>Lea</strong> <strong>Symbol</strong>s chart. As<br />
soon as the child correctly identified 3 <strong>of</strong> the 5 symbols on<br />
a line, the tester was permitted to ask the child to begin identifying<br />
symbols on the next smaller line. Acuity was scored as the smallest<br />
symbol size on which the child identified at least 3 <strong>of</strong> the 5 symbols<br />
on the line.<br />
For the <strong>ETDRS</strong> charts, the child was asked to name, or to<br />
match to <strong>letter</strong>s on a lap card, all 5 <strong>of</strong> the symbols on each line<br />
on the chart. Acuity was scored as the smallest <strong>letter</strong> size on which<br />
the child identified at least 3 <strong>letter</strong>s correctly, a line-by-line scoring<br />
method that is identical to that used for the <strong>Lea</strong> <strong>Symbol</strong>s chart<br />
and has been used in studies <strong>of</strong> children. 15,16 <strong>ETDRS</strong> <strong>acuity</strong> also<br />
was scored based on the total number <strong>of</strong> <strong>letter</strong>s identified correctly,<br />
ie, a <strong>letter</strong>-by-<strong>letter</strong> scoring method that is traditionally<br />
used with the <strong>ETDRS</strong> charts and that provides better reliability<br />
<strong>of</strong> scores than do other methods <strong>of</strong> scoring. 17<br />
Data Analysis<br />
Acuity scores were transformed to log values for data analysis. For<br />
scoring <strong>of</strong> <strong>ETDRS</strong> results based on the child’s reading <strong>of</strong> all <strong>letter</strong>s,<br />
the following formula, which assigns a value <strong>of</strong> 0.02 log unit<br />
to each <strong>letter</strong> identified, was used to transform scores to logMAR<br />
values:<br />
logMAR <strong>acuity</strong> score51:10 0:02Tc;<br />
where T c 5 the total number <strong>of</strong> <strong>letter</strong>s identified correctly.<br />
Results<br />
Study Sample<br />
A total <strong>of</strong> 482 kindergarten and first-grade children were<br />
enrolled in the study and completed the eye examination<br />
between September 2005 and August 2008. Data were excluded<br />
from 3 children who refused cycloplegic drops at<br />
the eye examination, 16 children who were older than 8<br />
years <strong>of</strong> age at the vision testing session, and 25 children<br />
who did not complete the vision testing session. The<br />
mean age <strong>of</strong> the final sample <strong>of</strong> 438 children was 6.2 years<br />
(SD 0.6; range, 5.2-7.8 years) at the exam, and 6.4 years<br />
(SD 0.6; range, 5.3-7.9 years) on the day <strong>of</strong> vision testing.<br />
Journal <strong>of</strong> AAPOS
Volume 13 Number 3 / June 2009 Dobson et al 255<br />
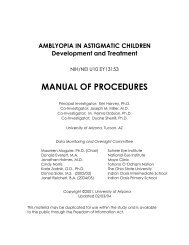
FIG 1. <strong>Lea</strong> <strong>Symbol</strong>s versus Early Treatment Diabetic Retinopathy<br />
Study (<strong>ETDRS</strong>) <strong>visual</strong> <strong>acuity</strong> results for the 5- to 7-year-old study participants<br />
(n 5 438), with <strong>ETDRS</strong> <strong>visual</strong> <strong>acuity</strong> determined using lineby-line<br />
(A) and <strong>letter</strong>-by-<strong>letter</strong> (B) scoring. Correlation between <strong>Lea</strong><br />
<strong>Symbol</strong>s and <strong>ETDRS</strong> <strong>visual</strong> <strong>acuity</strong> was 0.78 (p\0.001). The dashed<br />
line represents perfect agreement between <strong>Lea</strong> <strong>Symbol</strong>s and <strong>ETDRS</strong><br />
<strong>visual</strong> <strong>acuity</strong>; solid lines represent regression line and 95% confidence<br />
interval.<br />
All 438 children completed both <strong>Lea</strong> <strong>Symbol</strong>s and <strong>ETDRS</strong><br />
<strong>acuity</strong> testing.<br />
On the basis <strong>of</strong> the results <strong>of</strong> the eye examination, conducted<br />
5 to 235 days (mean 43.0 days, SD 31.3) before assessment<br />
<strong>of</strong> <strong>visual</strong> <strong>acuity</strong>, 248 children (56.6%) met 1 or<br />
Journal <strong>of</strong> AAPOS<br />
more refractive error criteria for eyeglass prescription:<br />
241 (55.0%) had astigmatism $1.00 D in one or both<br />
eyes (range, 0.00 to 6.75 D), 97 (22.1%) had myopia<br />
$0.75 D in either meridian, 61 (13.9%) had hyperopia<br />
$4.00 D in either meridian, and 9 (2.1%) had anisometropia<br />
.1.50 D spherical equivalent.<br />
Visual Acuity Results: Comparison <strong>of</strong> <strong>Lea</strong> <strong>Symbol</strong>s<br />
and <strong>ETDRS</strong> Scores<br />
Best-corrected logMAR <strong>acuity</strong> ranged from 0.30 to 0.70<br />
(20/10 to 20/100) for both the <strong>Lea</strong> <strong>Symbol</strong>s and the<br />
<strong>ETDRS</strong> charts when the line-by-line scoring method was<br />
used, and from 0.18 to 0.74 (20/13 to 20/110) for <strong>letter</strong>-by-<strong>letter</strong><br />
scoring <strong>of</strong> <strong>ETDRS</strong> data.<br />
Figure 1 provides <strong>comparison</strong>s <strong>of</strong> (A) <strong>Lea</strong> <strong>Symbol</strong>s and<br />
(B) <strong>ETDRS</strong> <strong>visual</strong> <strong>acuity</strong> results for the 438 study participants.<br />
Correlation between <strong>Lea</strong> <strong>Symbol</strong>s and <strong>ETDRS</strong><br />
line-by-line <strong>visual</strong> <strong>acuity</strong> and between <strong>Lea</strong> <strong>Symbol</strong>s and<br />
<strong>ETDRS</strong> <strong>letter</strong>-by-<strong>letter</strong> <strong>visual</strong> <strong>acuity</strong> was 0.78 (p \<br />
0.001). The correlation between <strong>ETDRS</strong> line-by-line<br />
and <strong>letter</strong>-by-<strong>letter</strong> <strong>visual</strong> <strong>acuity</strong> was 0.96 (p\0.001).<br />
Overall, mean <strong>Lea</strong> <strong>Symbol</strong>s <strong>visual</strong> <strong>acuity</strong> (0.15 logMAR<br />
[20/28], SD 0.17) was approximately one-half line (2 to 3<br />
<strong>letter</strong>s) better than mean <strong>ETDRS</strong> line-by-line <strong>visual</strong> <strong>acuity</strong><br />
(0.19 logMAR [20/31], SD 0.17, t437 5 7.41, p\0.001) and<br />
<strong>ETDRS</strong> <strong>letter</strong>-by-<strong>letter</strong> <strong>visual</strong> <strong>acuity</strong> (0.21 logMAR [20/<br />
32], SD 0.17, t437 5 11.22, p\0.001). The difference between<br />
<strong>Lea</strong> <strong>Symbol</strong>s and <strong>ETDRS</strong> <strong>visual</strong> <strong>acuity</strong> (for both<br />
line-by-line and <strong>letter</strong>-by-<strong>letter</strong> scoring) did not differ significantly<br />
across age groups (5- <strong>vs</strong> 6- <strong>vs</strong> 7-year-old subjects).<br />
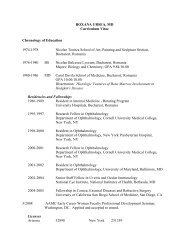
Figure 2 presents Bland-Altmann 18 plots that demonstrate<br />
the difference between <strong>Lea</strong> <strong>Symbol</strong>s and <strong>ETDRS</strong> <strong>visual</strong><br />
<strong>acuity</strong> versus the mean <strong>of</strong> the <strong>visual</strong> <strong>acuity</strong> scores<br />
obtained with the <strong>Lea</strong> <strong>Symbol</strong>s and <strong>ETDRS</strong> charts. There<br />
were no significant correlations between the difference between<br />
<strong>Lea</strong> <strong>Symbol</strong>s and <strong>ETDRS</strong> <strong>acuity</strong> scores (for both<br />
line-by-line and <strong>letter</strong>-by-<strong>letter</strong> scoring) and the mean <strong>visual</strong><br />
<strong>acuity</strong>.<br />
Discussion<br />
The present study provides the first large-scale <strong>comparison</strong><br />
<strong>of</strong> <strong>Lea</strong> <strong>Symbol</strong>s and <strong>ETDRS</strong> <strong>visual</strong> <strong>acuity</strong> in young children.<br />
The results indicate that although <strong>visual</strong> <strong>acuity</strong><br />
results obtained with the <strong>Lea</strong> <strong>Symbol</strong>s chart are significantly<br />
correlated with <strong>visual</strong> <strong>acuity</strong> results obtained with<br />
<strong>ETDRS</strong> charts, <strong>Lea</strong> <strong>Symbol</strong>s <strong>visual</strong> <strong>acuity</strong> scores are, on<br />
average, 0.5 line (0.04 to 0.06 log unit) better than <strong>visual</strong><br />
<strong>acuity</strong> scores obtained with <strong>ETDRS</strong> charts. There was no<br />
significant relation between the difference in scores on<br />
the 2 charts and <strong>acuity</strong> level (Figure 2). The finding that<br />
children show better <strong>visual</strong> <strong>acuity</strong> when tested with <strong>Lea</strong><br />
<strong>Symbol</strong>s than with <strong>ETDRS</strong> charts is in agreement with<br />
preliminary data from a similar population. 6 In addition,<br />
the results are in agreement with previous studies that<br />
have found better <strong>visual</strong> <strong>acuity</strong> when patients were tested
256 Dobson et al Volume 13 Number 3 / June 2009<br />
FIG 2. Difference between <strong>Lea</strong> <strong>Symbol</strong>s and Early Treatment Diabetic<br />
Retinopathy Study (<strong>ETDRS</strong>) <strong>visual</strong> <strong>acuity</strong> plotted as a function <strong>of</strong> the<br />
mean <strong>of</strong> the <strong>visual</strong> <strong>acuity</strong> scores obtained with the <strong>Lea</strong> <strong>Symbol</strong>s and<br />
<strong>ETDRS</strong> charts, with <strong>ETDRS</strong> <strong>visual</strong> <strong>acuity</strong> determined using line-byline<br />
(A) and <strong>letter</strong>-by-<strong>letter</strong> (B) scoring. There was no significant correlation<br />
between the difference between <strong>Lea</strong> <strong>Symbol</strong>s and <strong>ETDRS</strong> <strong>visual</strong><br />
<strong>acuity</strong> scores and the mean <strong>of</strong> the scores. The dashed line represents<br />
perfect agreement between <strong>Lea</strong> <strong>Symbol</strong>s and <strong>ETDRS</strong> <strong>visual</strong> <strong>acuity</strong>;<br />
solid lines represent regression line and 95% confidence interval.<br />
with <strong>Lea</strong> <strong>Symbol</strong>s than when they were tested with either<br />
a non-logMAR Landolt C test 4 or with the logMAR Bailey-Lovie<br />
chart. 5 In contrast to the present results, however,<br />
both previous studies showed that the difference<br />
between <strong>Lea</strong> <strong>Symbol</strong>s <strong>visual</strong> <strong>acuity</strong> and <strong>visual</strong> <strong>acuity</strong> obtained<br />
with standard adult logMAR <strong>acuity</strong> tests is greater<br />
at low <strong>acuity</strong> levels than for <strong>acuity</strong> scores within the normal<br />
range. 4,5 The failure to find a relation between <strong>visual</strong> <strong>acuity</strong><br />
level and the difference between <strong>Lea</strong> <strong>Symbol</strong>s and <strong>ETDRS</strong><br />
<strong>visual</strong> <strong>acuity</strong> in the present study may be related to the relatively<br />
narrow range <strong>of</strong> <strong>visual</strong> <strong>acuity</strong> scores (worst <strong>acuity</strong><br />
was 0.74 logMAR [20/110]), compared with the much<br />
greater range <strong>of</strong> <strong>visual</strong> <strong>acuity</strong> scores <strong>of</strong> subjects in the two<br />
previous studies. 4,5 That is, the finding <strong>of</strong> a relatively large<br />
difference between <strong>Lea</strong> <strong>Symbol</strong>s and <strong>ETDRS</strong> <strong>visual</strong> <strong>acuity</strong><br />
may be evident only at lower <strong>acuity</strong> levels than were obtained<br />
in the present study.<br />
A possible explanation for the better <strong>acuity</strong> scores obtained<br />
with the <strong>Lea</strong> <strong>Symbol</strong>s chart than with the <strong>ETDRS</strong><br />
and Bailey-Lovie charts is that the <strong>Lea</strong> <strong>Symbol</strong>s test includes<br />
only 4 optotypes, whereas 10 optotypes are used<br />
in the <strong>ETDRS</strong> and Bailey-Lovie charts. This means that<br />
as <strong>acuity</strong> threshold is approached, the individual has<br />
a 25% chance <strong>of</strong> guessing the correct symbol in the <strong>Lea</strong><br />
<strong>Symbol</strong>s chart but only a 10% chance <strong>of</strong> guessing the correct<br />
<strong>letter</strong> in the Bailey-Lovie and <strong>ETDRS</strong> charts, which<br />
could result in a better <strong>acuity</strong> score because <strong>of</strong> correct<br />
guessing with the <strong>Lea</strong> <strong>Symbol</strong>s chart.<br />
Another factor that may contribute to differences in <strong>visual</strong><br />
<strong>acuity</strong> obtained with <strong>Lea</strong> <strong>Symbol</strong>s versus <strong>ETDRS</strong>,<br />
Landolt C, and Bailey-Lovie charts is the difference in optotypes<br />
used in the different tests (symbols <strong>vs</strong> <strong>letter</strong>s). Although<br />
the designer <strong>of</strong> the <strong>Lea</strong> <strong>Symbol</strong>s chart empirically<br />
determined that in normal adults tested with optotypes<br />
presented at various <strong>distance</strong>s, the <strong>Lea</strong> <strong>Symbol</strong>s optotype<br />
sizes produced <strong>visual</strong> <strong>acuity</strong> scores that were equivalent<br />
to those produced by optotypes <strong>of</strong> the same <strong>acuity</strong> level<br />
on the Snellen E chart 3 and to optotypes <strong>of</strong> the same <strong>acuity</strong><br />
level on the Landolt C chart (L. Hyvärinen, personal communication,<br />
1999), it is possible that in children, and in patients<br />
with ocular abnormalities, the <strong>visual</strong> <strong>acuity</strong> results<br />
from the 2 types <strong>of</strong> optotypes are not equivalent. In addition,<br />
it is possible that the young children’s interest in<br />
the testing was better maintained by a chart containing<br />
familiar shapes than by a chart composed <strong>of</strong> less familiar<br />
<strong>letter</strong>s.<br />
The present study has both strengths and limitations. An<br />
important strength is the large sample size: data were obtained<br />
from 438 children who were tested with both the<br />
<strong>Lea</strong> <strong>Symbol</strong>s and <strong>ETDRS</strong> charts in the same session. In addition,<br />
<strong>ETDRS</strong> <strong>acuity</strong> was scored by the use <strong>of</strong> a method<br />
identical to the method used for LEA <strong>acuity</strong> scoring (ie,<br />
the line-by-line method) as well as the scoring method traditionally<br />
used for the <strong>ETDRS</strong> charts (ie, the <strong>letter</strong>-by-<strong>letter</strong><br />
method). The fact that the pattern <strong>of</strong> results was the<br />
same with both scoring methods suggests that the difference<br />
between <strong>ETDRS</strong> and LEA <strong>acuity</strong> was not related to<br />
the scoring method used to determine <strong>visual</strong> <strong>acuity</strong>.<br />
A limitation is the possibility that the poorer scores obtained<br />
with <strong>ETDRS</strong> charts vis-à-vis the <strong>Lea</strong> <strong>Symbol</strong>s chart<br />
may have been related to fatigue or boredom. The<br />
Journal <strong>of</strong> AAPOS
Volume 13 Number 3 / June 2009 Dobson et al 257<br />
following may have been causes <strong>of</strong> fatigue or boredom: (1)<br />
protocol requirements <strong>of</strong> the larger study in which these<br />
children were participants—<strong>Lea</strong> <strong>Symbol</strong>s <strong>acuity</strong> was always<br />
tested before <strong>ETDRS</strong> <strong>acuity</strong>; (2) the <strong>ETDRS</strong> task,<br />
which requires the child to identify 10 <strong>letter</strong> optotypes, is<br />
more difficult than the <strong>Lea</strong> <strong>Symbol</strong>s task, which requires<br />
the child to identify 4 symbol optotypes; (3) for <strong>ETDRS</strong><br />
testing, children were required to identify all <strong>letter</strong>s on<br />
each line, whereas in the <strong>Lea</strong> <strong>Symbol</strong>s chart, children<br />
were permitted to skip the last 2 symbols on a line if they<br />
identified the first 3 correctly. However, in at least one <strong>of</strong><br />
the previous studies that reported better <strong>visual</strong> <strong>acuity</strong><br />
with <strong>Lea</strong> <strong>Symbol</strong>s than with an adult <strong>visual</strong> <strong>acuity</strong> chart, 5<br />
order <strong>of</strong> testing was varied, suggesting that the unvaried order<br />
<strong>of</strong> testing may not have been an important factor in the<br />
present study.<br />
Another limitation <strong>of</strong> the present study is the relatively<br />
restricted range <strong>of</strong> <strong>acuity</strong> scores that were generated by<br />
the subjects. The worst <strong>Lea</strong> <strong>Symbol</strong>s <strong>visual</strong> <strong>acuity</strong> obtained<br />
was 20/100, and the worst <strong>ETDRS</strong> <strong>visual</strong> <strong>acuity</strong> was 20/<br />
110. Thus, the results do not provide information about<br />
agreement between <strong>Lea</strong> <strong>Symbol</strong>s and <strong>ETDRS</strong> <strong>visual</strong> <strong>acuity</strong><br />
at <strong>acuity</strong> levels worse than about 20/100.<br />
In conclusion, the results <strong>of</strong> the present study suggest<br />
that although there is a significant correlation between <strong>visual</strong><br />
<strong>acuity</strong> scores obtained with <strong>Lea</strong> <strong>Symbol</strong>s and <strong>ETDRS</strong><br />
charts, the <strong>Lea</strong> <strong>Symbol</strong>s chart may overestimate the <strong>acuity</strong><br />
score measured by the <strong>ETDRS</strong> <strong>letter</strong> chart in young children.<br />
Alternatively, it could be argued that <strong>ETDRS</strong> charts<br />
underestimate <strong>visual</strong> <strong>acuity</strong> in the young child, as a result <strong>of</strong><br />
the difficulty <strong>of</strong> the task involved and the unfamiliarity <strong>of</strong><br />
<strong>letter</strong> optotypes to young children.<br />
Acknowledgments<br />
The authors thank the Tohono O’odham Nation, the Indian Oasis/Baboquivari<br />
School District, the Bureau <strong>of</strong> Indian Affairs Office <strong>of</strong> Indian<br />
Education Programs (BIA OIEP, Papago/Pima Agency), the San Xavier<br />
Mission School, and our NIH/NEI Data Monitoring and Oversight<br />
Committee (Maureen Maguire, PhD [former chair], Robert Hardy,<br />
PhD [current chair], Morgan Ashley, Donald Everett, MA, Jonathan<br />
Holmes, MD, Cynthia Norris, and Karla Zadnik, OD, PhD).<br />
References<br />
1. Ferris FL, Kass<strong>of</strong>f A, Bresnick GH, Bailey I. New <strong>visual</strong> <strong>acuity</strong> charts<br />
for clinical research. Am J Ophthalmol 1982;94:91-6.<br />
Journal <strong>of</strong> AAPOS<br />
2. Committee on Vision. Recommended standard procedures for the<br />
clinical measurement and specification <strong>of</strong> <strong>visual</strong> <strong>acuity</strong>. Adv Ophthalmol<br />
1980;41:103-48.<br />
3. Hyvärinen L, Näsänen R, Laurinen P. New <strong>visual</strong> <strong>acuity</strong> test for preschool<br />
children. Acta Ophthalmol (Copenh) 1980;58:507-11.<br />
4. Gräf MH, Becker R, Kaufmann H. <strong>Lea</strong> <strong>Symbol</strong>s: <strong>visual</strong> <strong>acuity</strong> assessment<br />
and detection <strong>of</strong> amblyopia. Graefe’s Arch Clin Exp Ophthalmol<br />
2000;238:53-8.<br />
5. Vision In Preschoolers (VIP) Study Group. Visual <strong>acuity</strong> results in<br />
school-aged children and adults: <strong>Lea</strong> <strong>Symbol</strong>s chart versus Bailey-Lovie<br />
Chart. Optom Vis Sci 2003;80:650-54.<br />
6. Harvey EM, Miller JM, Dobson V, Lopez CA, Lopez FM. A <strong>comparison</strong><br />
<strong>of</strong> <strong>ETDRS</strong> (<strong>letter</strong>) <strong>acuity</strong> and <strong>Lea</strong> (symbol) <strong>acuity</strong> in a first grade<br />
population with a high prevalence <strong>of</strong> astigmatism. Invest Ophthalmol<br />
Vis Sci 1998;39:S947.<br />
7. Dobson V, Miller JM, Harvey EM. Corneal and refractive astigmatism<br />
in a sample <strong>of</strong> 3- to 5-year-olds with a high prevalence <strong>of</strong> astigmatism.<br />
Optom Vis Sci 1999;76:855-60.<br />
8. Dobson V, Miller JM, Harvey EM, Sherrill DL. Prevalence <strong>of</strong> astigmatism,<br />
astigmatic anisometropia, and glasses wearing among preschool-<br />
and school-age Native American children. In: Vision<br />
Science and Its Applications: February 19–22, 1999. Santa Fe, New<br />
Mexico. Washington: Optical Society <strong>of</strong> America; 1999. OSA Technical<br />
Digest Series177–180.<br />
9. Harvey EM, Dobson V, Miller JM. Prevalence <strong>of</strong> high astigmatism,<br />
eyeglass wear, and poor <strong>visual</strong> <strong>acuity</strong> among Native American<br />
grade-school children. Optom Vis Sci 2006;83:206-12.<br />
10. Harvey EM, Dobson V, Miller JM, Clifford-Donaldson CE. Amblyopia<br />
in astigmatic children: Patterns <strong>of</strong> deficits. Vision Res 2007;47:<br />
315-26.<br />
11. Guyton DL, Miller JM, West CE. Optical pearls and pitfalls: Tricks<br />
and traps in strabismus. In: Wright KW, Speigel PH, editors. Pediatric<br />
Ophthalmology and Strabismus. 2nd ed. New York: Springer;<br />
2003. p. 292-6.<br />
12. Long WF. A matrix formalism for decentration problems. Am J Optom<br />
Physiol Opt 1976;53:27-33.<br />
13. Harris WF. The mean and variance <strong>of</strong> samples <strong>of</strong> dioptric powers: the<br />
basic calculations. Clin Exp Optom 1990;73:89-92.<br />
14. Harvey EM, Miller JM, Dobson V, Tyszko R, Davis AL. Measurement<br />
<strong>of</strong> refractive error in Native American preschoolers: Validity<br />
and reproducibility <strong>of</strong> autorefraction. Optom Vis Sci 2000;<br />
77:140-49.<br />
15. Cryotherapy for Retinopathy <strong>of</strong> Prematurity Cooperative Group.<br />
Multicenter trial <strong>of</strong> cryotherapy for retinopathy <strong>of</strong> prematurity:<br />
Snellen <strong>visual</strong> <strong>acuity</strong> and structural outcome at 5 1 ⁄2 years after randomization.<br />
Arch Ophthalmol 1996;114:417-24.<br />
16. Cryotherapy for Retinopathy <strong>of</strong> Prematurity Cooperative Group.<br />
Multicenter trial <strong>of</strong> cryotherapy for retinopathy <strong>of</strong> prematurity. Ophthalmological<br />
outcomes at 10 years. Arch Ophthalmol 2001;119:<br />
1110-8.<br />
17. Arditi A, Cagenello R. On the statistical reliability <strong>of</strong> <strong>letter</strong>-chart <strong>visual</strong><br />
<strong>acuity</strong> measurements. Invest Ophthalmol Vis Sci 1993;34:120-9.<br />
18. Bland JM, Altman DG. Measuring agreement in method <strong>comparison</strong><br />
studies. Stat Methods Med Res 1999;8:135-60.