Sötemann, S.W. et al - eWISA
Sötemann, S.W. et al - eWISA
Sötemann, S.W. et al - eWISA

You also want an ePaper? Increase the reach of your titles
YUMPU automatically turns print PDFs into web optimized ePapers that Google loves.
INTEGRATED BIOLOGICAL, CHEMICAL AND PHYSICAL<br />
PROCESSES KINETIC MODELLING PART 1: ANOXIC AND<br />
AEROBIC PROCESSES OF CARBON AND NITROGEN<br />
REMOVAL IN THE ACTIVATED SLUDGE SYSTEM<br />
S.W. <strong>Sötemann</strong>*, E.V. Musvoto, M.C. Wentzel and G.A. Ekama<br />
Water Research Group, Department of Civil Engineering, University of Cape Town, Rondebosch, 7701,<br />
Cape Town, South Africa. *E-mail: ssotema@eng.uct.ac.za<br />
ABSTRACT<br />
The biologic<strong>al</strong> kin<strong>et</strong>ic Activated Sludge Model No. 1 (ASM#1, Henze <strong>et</strong> <strong>al</strong>., 1987; Dold <strong>et</strong> <strong>al</strong>., 1991)<br />
for carbon (C) and nitrogen (N) remov<strong>al</strong> is integrated with the mixed weak acid/base model of<br />
Musvoto <strong>et</strong> <strong>al</strong>. (1997, 2000a,b,c) to extend application of ASM#1 to situations where an estimate for<br />
pH is important. Because chemic<strong>al</strong> precipitation is gener<strong>al</strong>ly not significant when treating municip<strong>al</strong><br />
wastewaters, only gas and liquid phase processes were considered for this integrated model. The<br />
biologic<strong>al</strong> processes in ASM#1 were modified to take into account the effect of the interaction of the<br />
weak acid/base species of the ammonia, carbonate, phosphate and short chain fatty acid systems<br />
and pH on h<strong>et</strong>erotrophic and autotrophic organism behaviour, which includes generation and<br />
utilization CO2 in m<strong>et</strong>abolism, use of specific weak acid/base species for organism growth and<br />
generation and utilization of H + . With these modifications, simulations with the model were compared<br />
with those of ASM#1 (Dold <strong>et</strong> <strong>al</strong>., 1991) and experiment<strong>al</strong> data in the literature; a good correlation<br />
was obtained. However, these comparisons are only a preliminary v<strong>al</strong>idation, because, despite their<br />
inclusion, the weak acid/bases and pH do not have a significant effect on the biologic<strong>al</strong> processes in<br />
the cases considered (i.e. well buffered wastewater). The performance of a ND activated sludge<br />
system with low influent <strong>al</strong>k<strong>al</strong>inity is ev<strong>al</strong>uated.<br />
INTRODUCTION<br />
A number of mathematic<strong>al</strong> models describing the biologic<strong>al</strong> processes of carbon (C), nitrogen (N)<br />
and phosphorus (P) remov<strong>al</strong> by the activated sludge system have been developed, e.g. the C and<br />
N remov<strong>al</strong> models of van Haandel <strong>et</strong> <strong>al</strong>. (1981) and Activated Sludge Model No.1 (ASM#1, Henze<br />
<strong>et</strong> <strong>al</strong>., 1987), and the C, N and P remov<strong>al</strong> models of Wentzel <strong>et</strong> <strong>al</strong>. (1992), and ASM#2 (Henze <strong>et</strong> <strong>al</strong>.,<br />
1995). These models are commonly used in research, design, operation and system development<br />
and can be coded into computer shell packages such as ASIM (Gujer, 1998) and Aquasim (Reichert,<br />
1998) and various versions of them are commerci<strong>al</strong>ly available such as Biowin (Envirosim and<br />
Associates,1998) and GPX (Hydromantis).<br />
In <strong>al</strong>l these models, it is assumed that the biologic<strong>al</strong> processes operate in a liquid phase of constant<br />
pH, i.e. that there is sufficient buffer capacity in the liquid phase to absorb or supply the protons (H + )<br />
and CO2 required or generated by the biologic<strong>al</strong> processes without a change in pH. For most<br />
applications with municip<strong>al</strong> wastewater, where the concentrations of C, N and P are low, this is a<br />
reasonable assumption. In fact, in some models, the param<strong>et</strong>er Alk<strong>al</strong>inity is included to check that<br />
this condition remains true (e.g. ASM#1, Henze <strong>et</strong> <strong>al</strong>., 1987; UCTOLD and IAWPRC, Dold <strong>et</strong> <strong>al</strong>.,<br />
1991). However, in the treatment of a number of wastewaters this assumption is not v<strong>al</strong>id, e.g. in the<br />
nitrification of wastewaters with low buffer capacity and/or high nitrogen (N) concentrations, or in the<br />
treatment of wastewaters where the generation or utilisation of short-chain fatty acids (SCFA) is<br />
significant.<br />
In this paper, the biologic<strong>al</strong> processes of C and N remov<strong>al</strong> are integrated into the three phase mixed<br />
weak acid/base physic<strong>al</strong>-chemic<strong>al</strong> kin<strong>et</strong>ic model developed by Musvoto <strong>et</strong> <strong>al</strong>. (1997, 2000a,b,c). This<br />
chemic<strong>al</strong>-physic<strong>al</strong> model includes kin<strong>et</strong>ic descriptions for (i) the ionic equilibrium reactions of the<br />
Proceedings of the 2004 Water Institute of Southern Africa (WISA) Bienni<strong>al</strong> Conference 2 –6 May 2004<br />
ISBN: 1-920-01728-3 Cape Town, South Africa<br />
Produced by: Document Transformation Technologies Organised by Event Dynamics
important weak acid/base systems that govern pH in wastewater treatment systems, i.e. the<br />
ammonia, carbonate (inorganic carbon), short chain fatty acid (SCFA) and phosphate systems, (ii)<br />
CO2 and NH3 gas exchange b<strong>et</strong>ween liquid and gas, (iii) ion pairing and (iv) precipitation of common<br />
miner<strong>al</strong>s associated with C<strong>al</strong>cium (Ca), Magnesium (Mg), carbonate and phosphate system species.<br />
Because in the activated sludge system, miner<strong>al</strong> precipitation is usu<strong>al</strong>ly not significant, only parts (i)<br />
to (ii) of the model, i.e. the liquid and gas phase processes, will be considered. Furthermore,<br />
because of the complex interaction b<strong>et</strong>ween pH and biologic<strong>al</strong> excess P remov<strong>al</strong> (BEPR), only the<br />
biologic<strong>al</strong> processes of C and N remov<strong>al</strong> are included into the integrated model at this stage. In<br />
subsequent papers, the biologic<strong>al</strong> processes of anaerobic digestion will be included into the model,<br />
and because in this system miner<strong>al</strong> precipitation is important, <strong>al</strong>l four parts of the physic<strong>al</strong>-chemic<strong>al</strong><br />
model will be considered (<strong>Sötemann</strong> <strong>et</strong> <strong>al</strong>., In Prep.).<br />
MODEL DEVELOPMENT<br />
Centr<strong>al</strong> to the mixed weak acid base chemic<strong>al</strong> model of Musvoto <strong>et</strong> <strong>al</strong>. (1997, 2000a,b,c) is that the<br />
hydrogen ion (H + ) is included explicitly as a compound. Integrating the biologic<strong>al</strong> processes of C and<br />
N remov<strong>al</strong> of ASM#1 into this chemic<strong>al</strong> model will require a number of interactions b<strong>et</strong>ween the<br />
chemic<strong>al</strong> and biologic<strong>al</strong> processes to be defined, e.g. (i) the influence of the biologic<strong>al</strong> processes on<br />
the weak acid/base systems species and H + concentrations, such as production and/or utilization of<br />
H + , CO2, N2, ammonia and phosphate in the growth and death (endogenous respiration) processes,<br />
and (ii) the effect of pH on the biologic<strong>al</strong> process rates where these are expected to be significant<br />
such as the autotrophic nitrifier organism (ANO) maximum specific growth rates.<br />
The mixed weak acid base kin<strong>et</strong>ic model of Musvoto <strong>et</strong> <strong>al</strong>. (1997) comprises (their Table 1):<br />
• The liquid phase forward and reverse dissociation chemic<strong>al</strong> processes of the ammonia,<br />
carbonate, phosphate and SCFA system species, i.e. processes 1-6 and 9-18 involving<br />
compounds 1-5 and 7-14.<br />
• The gas and solid phase physic<strong>al</strong> processes of the carbonate system, i.e. CO2 gas exchange<br />
(dissolution and expulsion) and CaCO3 precipitation, i.e. processes 7, 8 and 19 respectively.<br />
• Keeping the same numbering of processes and compounds, Musvoto <strong>et</strong> <strong>al</strong>. (2000a) extended<br />
this model to include (their Tables 1b and 3):<br />
• Ion pairing of Ca and Mg with hydroxide and the species of the carbonate and phosphate<br />
systems; this added 22 processes, i.e. the liquid phase forward and reverse dissociation<br />
chemic<strong>al</strong> processes of the 11 ion pairs (processes 20-41) and 12 compounds, i.e. Mg and 11 ion<br />
pair species (compounds 16-27) respectively (their Table 1b.)<br />
The gas and solid phase processes of ammonia, carbonate and phosphate systems, i.e. ammonia<br />
gas stripping and miner<strong>al</strong> precipitation of four addition<strong>al</strong> miner<strong>al</strong>s associated with Ca and Mg and<br />
species of the ammonia, carbonate and phosphate systems, i.e. struvite (MgNH4PO4), newberyite<br />
(MgHPO4), amorphous c<strong>al</strong>cium phosphate [ACP, Ca3(PO4)2] and MgCO3; this added 5 addition<strong>al</strong><br />
processes i.e. 42 to 46 but no new compounds (see their Table 3).<br />
Before incorporating the biologic<strong>al</strong> processes of ASM#1 into the weak acid/base chemic<strong>al</strong> physic<strong>al</strong><br />
(CP) model of Musvoto <strong>et</strong> <strong>al</strong>. (1997,2000a), <strong>al</strong>l the processes and compounds were categorised into<br />
chemic<strong>al</strong>, physic<strong>al</strong> and biologic<strong>al</strong> groups and subgroups. This was done for ease of discussion of the<br />
assembly of a particular integrated chemic<strong>al</strong> – physic<strong>al</strong> – biologic<strong>al</strong> (CPB) processes model, be it<br />
aerobic or anaerobic. For easy cross reference to the source chemic<strong>al</strong> physic<strong>al</strong> and biologic<strong>al</strong><br />
models, the numbers of the processes and compounds were not changed from those in the source<br />
models.<br />
The following gener<strong>al</strong> groups and subgroups of processes and compounds were adopted:<br />
• The chemic<strong>al</strong> processes, which comprise those of equilibrium (forward and reverse dissociation)<br />
and ion pairing. These are processes 1-41 in the Musvoto <strong>et</strong> <strong>al</strong>. (2000a) CP source model, but<br />
exclude the physic<strong>al</strong> processes 7, 8 and 19. These processes have the same numbers as in the<br />
source model, but the prefix C is added, i.e. C1-C41. The 27 compounds associated with these<br />
chemic<strong>al</strong> processes are <strong>al</strong>so numbered identic<strong>al</strong>ly as in the source model but have the prefix C<br />
added, i.e. compounds C1-C5 and C7-C14 involved in the equilibrium (CE) processes and
compounds C4, C5, C8, C10-c12 and C15-C27 involved in the ion pairing processes. The only<br />
compound that does not belong to this group is the CO2 gas (C6). CO2 is included with the<br />
compounds associated with the physic<strong>al</strong> processes and so is <strong>al</strong>so labelled P1.<br />
• The physic<strong>al</strong> processes, which comprise those of miner<strong>al</strong> precipitation (PMP) and gas exchange<br />
(PGE). The five miner<strong>al</strong> precipitation processes 19 and 42 to 45 in the Musvoto <strong>et</strong> <strong>al</strong>. (2000a) CP<br />
source model are renumbered processes P1 to P5. These processes involve only existing<br />
compounds in the model (viz. C1, C5, C11, C12, C15 and C16) and so add no new compounds.<br />
The CO2 exchange and ammonia stripping are processes 7, 8 and 46 respectively and these are<br />
numbered P6-P8. Gaseous ammonia is omitted because the gas phase is accepted to contain<br />
zero ammonia (infinite sink). Added to the PGE processes of the source model to form the<br />
integrated CPB model are the gas exchange processes (dissolution and expulsion) of oxygen<br />
and nitrogen gasses required for the ND activated sludge system and these were numbered<br />
P9-P12. The compounds associated with these addition<strong>al</strong> PGE processes are dissolved and<br />
gaseous compounds of ammonia, oxygen and nitrogen. Dissolved oxygen is a compound of the<br />
biologic<strong>al</strong> processes part of the model (see below, B8) so only three compounds need to be<br />
added for the CBP AS model, i.e. gaseous oxygen (P1) and dissolved and gaseous nitrogen (P2<br />
and P3).<br />
• The biologic<strong>al</strong> processes, which comprise the biologic<strong>al</strong> C and N remov<strong>al</strong> process of ASM#1.<br />
Also for these biologic<strong>al</strong> processes and compounds the same numbering of ASM#1 was r<strong>et</strong>ained,<br />
except the prefix B was added to each, i.e. processes B1 to B8 and compounds B1 to B13.<br />
However, two biologic<strong>al</strong> processes are added, viz. aerobic and anoxic growth of h<strong>et</strong>erotrophs<br />
(OHOs) with nitrate as N source and these were numbered B1b and B2b. Of the 13 compounds<br />
in ASM#1, two become redundant in an integrated CPB model – (i) the free and s<strong>al</strong>ine ammonia<br />
(FSA, B10) because NH3 and NH4 + are in the chemic<strong>al</strong> compounds group and (ii) the Alk<strong>al</strong>inity<br />
(B13), which is now obsol<strong>et</strong>e. Apart from the ammonium (C1), three other compounds in the<br />
source CP model are <strong>al</strong>so involved with the biologic<strong>al</strong> processes, i.e. H2CO3* (C3) through CO2<br />
generation or uptake, H + (C7) through ammonification, nitrification and denitrification and HPO4 2-<br />
through uptake for OHO growth.<br />
Following the grouping and numbering system above, the integrated two phase (liquid/gas) CPB AS<br />
model was assembled as follows:<br />
• The CE processes (C1-C6 and C9-C18) with associated compounds C1-C5 and C7-C14 (Table<br />
1 of Musvoto <strong>et</strong> <strong>al</strong>., 1997, not repeated here).<br />
• The biologic<strong>al</strong> processes of C and N remov<strong>al</strong> (B1 to B8) including aerobic and anoxic OHO<br />
growth on ammonium (processes B1a and B2a) and nitrate (processes B1b and B2b) with their<br />
associated compounds NH4 + (C1), H2CO3* (C3), H + (C7), HPO4 2- (C11) and the remaining 11<br />
biologic<strong>al</strong> system compounds (B1-B9, B11-B12).<br />
• The PGE processes of carbon dioxide (P6/C7and P7/C8), oxygen (P9 and P10) and nitrogen<br />
(P11 and P12) and ammonia stripping (C46/P8) with associated compounds dissolved and<br />
gaseous carbon dioxide (C3 and C6), oxygen (B8 and P1) and nitrogen (P2 and P3) and<br />
dissolved ammonia (C2). A gaseous ammonia compound is not included because in the pH<br />
range 5-8.5 little ammonia is stripped into the gas phase.<br />
Not included in integrated chemic<strong>al</strong>-physic<strong>al</strong>-biologic<strong>al</strong> activated sludge system model are (i) the<br />
chemic<strong>al</strong> ion pairing processes (C20-C41) because this was not considered important for activated<br />
sludge systems treating municip<strong>al</strong> wastewater (TDS < 1000 mg/l) and (ii) the physic<strong>al</strong> miner<strong>al</strong><br />
precipitation processes (C19, C42-C45 or P1-P5) because only the gas and liquid phases are<br />
considered in this first integrated AS model.<br />
For brevity, only the biologic<strong>al</strong> and PGE processes parts of the integrated CBP AS model with their<br />
associative compounds are shown in Tables 1 and 2. Because the chemic<strong>al</strong> and physic<strong>al</strong> parts of the<br />
model have units mol/l, these were changed to reflect the usu<strong>al</strong> units in biologic<strong>al</strong> models, viz. gC/m 3 ,<br />
gN/m 3 and gP/m 3 . Hence, when the H + interacts with the C, N or P species, it was divided by the<br />
molar mass of C, N and P respectively. Also, the kin<strong>et</strong>ic rate equations for the biologic<strong>al</strong> processes<br />
were modified to take into account the effect of H + where this effect is significant. This was done in<br />
two ways: (i) Where there is a direct influence of pH on the biologic<strong>al</strong> process rate, pH was included<br />
in the kin<strong>et</strong>ic rate formulation, and (ii) the kin<strong>et</strong>ic rates of the biologic<strong>al</strong> processes were reformulated
to utilize specific species of the weak acid/base systems - stoichiom<strong>et</strong>ric coefficients were added and<br />
existing ones modified to take this into account.<br />
The modifications s<strong>et</strong> out above were developed for the two organism groups included in ASM#1, i.e.<br />
ordinary h<strong>et</strong>erotrophic (OHOs) and autotrophic nitrifier (ANOs) organisms. For both groups,<br />
information in the literature on their behaviour was used for the modifications and these are reviewed<br />
briefly below. A review of bioenerg<strong>et</strong>ics and activated sludge model development is not given since<br />
these topics are <strong>al</strong>ready covered in the literature (e.g. McCarty, 1964, 1972; Dold <strong>et</strong> <strong>al</strong>., 1981; van<br />
Haandel <strong>et</strong> <strong>al</strong>., 1981; Henze <strong>et</strong> <strong>al</strong>., 1987; Clo<strong>et</strong>e and Muyima, 1995, Ohron <strong>et</strong> <strong>al</strong>., 1996, Sperandio<br />
<strong>et</strong> <strong>al</strong>., 1999). Only aspects relevant to the integration are discussed to clarify the additions and<br />
changes to the stoichiom<strong>et</strong>ric coefficients and kin<strong>et</strong>ic rates listed in Tables 1 and 2.<br />
MODIFICATIONS TO THE IWA ACTIVATED SLUDGE MODEL NO. 1 (ASM#1)<br />
Ordinary H<strong>et</strong>erotrophic Organisms (OHOs)<br />
The processes that involve the OHOs in ASM#1 (Table 1) are growth (B1 and B2), death (B4),<br />
hydrolysis of enmeshed particulate biodegradable organics (B7) and associated particulate<br />
biodegradable organic nitrogen (B8) and ammonification of soluble biodegradable organic nitrogen<br />
(B6). The growth of OHOs is described by four processes, two under aerobic conditions using either<br />
ammonia or nitrate as N source, and two under anoxic conditions, <strong>al</strong>so using either ammonia or<br />
nitrate as N source. These processes were modified to include (i) production of CO2 in m<strong>et</strong>abolism,<br />
(ii) uptake or release of specific weak acid/base N and P species for growth and death and (iii)<br />
utilization or production of H+.<br />
OHO M<strong>et</strong>abolism<br />
The bioenerg<strong>et</strong>ics of OHO growth is quantified in terms of the lumped electron donating capacity<br />
param<strong>et</strong>er COD because in wastewater treatment, the different kinds organics involved in the growth<br />
processes are not known. This is possible because the free energy released per electron (e - )<br />
transferred in the breakdown of different types of organics varies in the narrow range 105 to 121 kJ/e -<br />
eq. The integrated model requires a carbon b<strong>al</strong>ance to be made over the activated sludge system.<br />
Hence the mass of CO2 generated in the growth process needs to be known, which requires<br />
COD/TOC ratio of the wastewater organics to be known. For the range of different organics listed in<br />
Table 2, the COD/TOC ratio was c<strong>al</strong>culated and varies b<strong>et</strong>ween 2.67 and 4.0. Because most of the<br />
organics wastewater are of carbohydrate type with a relatively sm<strong>al</strong>l proportion of organics with high<br />
COD/TOC ratios, an average COD/TOC ratio would seem to be around 3.0. Because CO2 is<br />
generated only in catabolism, the CO2 generation is proportion<strong>al</strong> to the oxygen utilized, i.e.<br />
where<br />
YZH<br />
O2 utilised in producing 1 gCOD/m 3 OHO = (1-YZH)/YZH [1a]<br />
= yield coefficient (mg COD/mg COD)<br />
Hence the CO2 generated in producing 1 gOHOCOD/m 3<br />
= O2 utilised/(COD/TOC ratio) = (1-YZH)/(3.0 YZH) [1b]
Table 1. Matrix representation of the biologic<strong>al</strong> processes of ASM#1, including anoxic and aerobic growth of OHOs on nitrate (processes B1b and B2b), combined with<br />
the mixed weak acid base chemic<strong>al</strong>-physic<strong>al</strong> model of Musvoto <strong>et</strong> <strong>al</strong>. (2000a) to yield the two phase (liquid-gas) integrated chemic<strong>al</strong>-physic<strong>al</strong>-biologic<strong>al</strong> (CPB) model for<br />
C and N remov<strong>al</strong> in the activated sludge system (see Table 2 for physic<strong>al</strong> processes).<br />
No<br />
B1a<br />
B1b<br />
B2a<br />
B2b<br />
B3<br />
No<br />
Compound→<br />
Process↓<br />
Aerobic growth of ZBH<br />
with NH4 +<br />
Aerobic growth of ZBH<br />
with NO3 -<br />
Anoxic growth of ZBH<br />
with NH4 +<br />
Anoxic growth of ZBH<br />
with NO3 -<br />
Aerobic growth of ZBA<br />
B1<br />
SI<br />
B2<br />
Sbs<br />
-1/YZH<br />
-1/YZH<br />
-1/YZH<br />
-1/YZH<br />
B3<br />
XI<br />
B4<br />
Senm<br />
B5<br />
ZBH<br />
1<br />
1<br />
1<br />
1<br />
B6<br />
ZBA<br />
1<br />
B7<br />
ZE<br />
B8<br />
O<br />
dissolved<br />
-(1-YZH)<br />
/YZH<br />
-(1-YZH)<br />
/YZH<br />
B9<br />
NO3 -<br />
-fZB,N<br />
C1/B10<br />
NH4 +<br />
-fZB,N<br />
-(1-YZH)<br />
/(2.86YZH) -fZB,N<br />
B*<br />
-(4.57-YZA<br />
)<br />
/YZA 1/YZA<br />
-(1/YZA)<br />
-fZB,N<br />
B11<br />
Nobs<br />
B12<br />
Nobp<br />
B13<br />
SALK<br />
C3<br />
H2CO3 *<br />
(1-YZH)<br />
/(3YZH)<br />
(1-YZH)<br />
/(3YZH)<br />
(1-YZH)<br />
/(3YZH)<br />
(1-YZH)<br />
/(3YZH)<br />
-3/8<br />
C7<br />
H +<br />
fZB,N/14-2f<br />
ZB,P/31<br />
C11<br />
HPO4 2-<br />
-fZB,P<br />
-fZB,N/14-2f<br />
ZB,P/31 -fZB,P<br />
A*<br />
C*<br />
fZB,N /14+<br />
1/(7YZA)<br />
-fZB,P<br />
-fZB,P<br />
P2<br />
N2<br />
dissolved<br />
D*<br />
D*<br />
Rate<br />
⎡H<br />
Air⎤<br />
+<br />
⎡ Sbs<br />
⎤ ⎡NH4<br />
µ<br />
⎢ ⎥<br />
H ⎢<br />
⎢<br />
KSH<br />
+<br />
⎥<br />
⎣ S<br />
⎢ ⎥<br />
bs⎦<br />
limit<br />
⎢ On ⎥<br />
⎣<br />
⎣ ⎦<br />
⎡H<br />
Air⎤<br />
⎡ Sbs<br />
⎤ ⎡1-<br />
NH<br />
µ<br />
⎢ ⎥<br />
H ⎢<br />
⎢<br />
KSH<br />
+<br />
⎥<br />
⎣ S<br />
⎢ ⎥<br />
bs⎦<br />
lim<br />
⎢ On ⎥<br />
⎣<br />
⎣ ⎦<br />
µ<br />
µ<br />
µ<br />
H<br />
H<br />
A<br />
⎡H<br />
Air⎤<br />
+<br />
⎡ Sbs<br />
⎤ ⎢ ⎥ ⎡NH4<br />
⎢<br />
⎢<br />
KSH<br />
+<br />
⎥<br />
⎣ S<br />
⎢ ⎥<br />
bs⎦<br />
limit<br />
⎢ Off ⎥<br />
⎣<br />
⎣ ⎦<br />
⎡H<br />
Air⎤<br />
⎡ Sbs<br />
⎤ ⎢ ⎥ ⎡1-<br />
NH<br />
⎢<br />
⎢<br />
KSH<br />
+<br />
⎥<br />
⎣ S<br />
⎢ ⎥<br />
bs⎦<br />
lim<br />
⎢ Off ⎥<br />
⎣<br />
⎣ ⎦<br />
⎡A<br />
Air⎤<br />
+ ⎡ NH4<br />
⎤ ⎢ ⎥<br />
⎢<br />
+ Z<br />
KSA<br />
+<br />
⎥<br />
⎣ NH<br />
⎢ ⎥<br />
4 ⎦<br />
⎢⎣<br />
On ⎥⎦<br />
BA
No<br />
No<br />
Compound→<br />
Process↓<br />
B1<br />
SI<br />
B2<br />
Sbs<br />
B3<br />
XI<br />
B4<br />
Senm<br />
B5<br />
ZBH<br />
B6<br />
ZBA<br />
B7<br />
ZE<br />
B8<br />
O<br />
dissolved<br />
B4 Death of ZBH 1-fE -1 fE fZB,N-fEfZE,N 2(fZB,P-fEfZ<br />
E,P)/31<br />
B5<br />
B6<br />
B7<br />
B8<br />
Death of ZBA<br />
Ammpnification of Nobs<br />
Hydrolysis of Senm<br />
Hydrolysis of Nobp<br />
Units<br />
1<br />
1-fE<br />
-1<br />
gCOD/<br />
m 3<br />
gCOD<br />
/m 3<br />
gCOD/<br />
m 3<br />
gCOD<br />
/m 3<br />
gCOD<br />
/m 3<br />
gCOD<br />
/m 3<br />
gCOD<br />
/m 3<br />
gCOD<br />
/m 3<br />
-1<br />
fE<br />
B9<br />
NO3 -<br />
gN/m 3<br />
C1/B10<br />
NH4 +<br />
1<br />
gN/m 3<br />
B11<br />
Nobs<br />
-1<br />
1<br />
B12<br />
Nobp<br />
fZB,N-fEfZE,N<br />
-1<br />
gN/m 3<br />
gN/m 3<br />
B13<br />
SALK<br />
C3<br />
H2CO3 *<br />
* 1-<br />
YZH<br />
f ZB, N f ZB, P<br />
A = -<br />
+ -2*<br />
14*<br />
2.86Y<br />
ZH 14 31<br />
* 1-<br />
YZH<br />
B = - + f ZB, N<br />
2.86Y<br />
ZH<br />
* 1-<br />
YZH<br />
f ZB,<br />
C = -<br />
-<br />
14*<br />
2.86Y<br />
ZH 14<br />
⎛ ⎡H<br />
Air⎤<br />
⎞<br />
* 1-<br />
=<br />
YZH<br />
H Air<br />
* ⎡ ( Senm<br />
/ ZBH)<br />
⎤ ⎜<br />
NO<br />
D<br />
=<br />
⎢ ⎥ ⎡ ⎤ ⎡ 3⎤<br />
⎟<br />
E KH<br />
+ S<br />
ZBH<br />
2.86<br />
⎢<br />
⎜<br />
⎟<br />
YZH<br />
KX<br />
+ ( Senm<br />
/ ZBH)<br />
⎥ ⎢ ⎥<br />
η ⎢<br />
⎜<br />
Off<br />
⎥ ⎢<br />
limit<br />
⎥<br />
⎣<br />
⎦<br />
On<br />
⎣ ⎦ ⎣ ⎦⎟<br />
⎝<br />
⎢⎣<br />
⎥⎦<br />
⎠<br />
gC/m 3<br />
C7<br />
H +<br />
-1/14<br />
g/m 3<br />
N<br />
C11<br />
HPO4 2-<br />
fZB,P-fEfZE,P<br />
gP/m 3<br />
f<br />
-2*<br />
ZB, P<br />
31<br />
P2<br />
N2<br />
dissolved<br />
gN/m 3<br />
Rate<br />
bH ZBH<br />
bA ZBA<br />
KR Nobs<br />
ZBH<br />
E *<br />
. S<br />
( N<br />
/ S<br />
*<br />
E enm obp enm<br />
Notes: (1) Compound B1-B13 numbered identic<strong>al</strong>ly to ASM#1, except NH 4 + , which is C1 in Musvoto <strong>et</strong> <strong>al</strong>. (1997) and B10 in ASM#1. NH4 + in ASM#1 is actu<strong>al</strong>ly the free (NH3) and s<strong>al</strong>ine<br />
(NH 4 + ) ammonia (FSA), where here it is only the s<strong>al</strong>ine. Alk<strong>al</strong>inity (compound 13) is no longer required. Ammonium (C1), dissolved CO2 (C3) and nitrogen (P2), H + (C7) and<br />
mono-hydrogen phosphate (C11) are included here because they are involved with the biologic<strong>al</strong> processes.<br />
)
Table 2. Matrix representation of the physic<strong>al</strong> gas exchange (PGE) processes incorporated in the integrated two-phase chemic<strong>al</strong>-physic<strong>al</strong>-biologic<strong>al</strong> (CPB) model for<br />
C and N remov<strong>al</strong> in the activated sludge system (see Table 1 for biologic<strong>al</strong> processes).<br />
No<br />
No<br />
Compound→<br />
Process↓<br />
C7/P6 Dissolution of CO2<br />
C8/P7 Expulsion CO2<br />
P8<br />
P9<br />
P10<br />
P11<br />
Gas stripping of<br />
CO2<br />
Gas stripping of<br />
NH3<br />
Gas stripping of N2<br />
Aeration -<br />
dissolution of O2<br />
Units<br />
C2<br />
C3<br />
NH3<br />
dissolved H2CO3*<br />
-1<br />
mol/l<br />
+1<br />
-1<br />
-1<br />
mol/l<br />
C6 /P1<br />
CO2<br />
gas<br />
-1<br />
+1<br />
+1<br />
mol/l<br />
B8<br />
P2<br />
O2 O2<br />
dissolved gas<br />
+1<br />
mgO/l<br />
-1<br />
mol/l<br />
P3<br />
P4<br />
N2 N2<br />
dissolved gas<br />
-1<br />
mol/l<br />
+1<br />
mol/l<br />
P5<br />
NH3<br />
gas<br />
+1<br />
mol/l<br />
Rate<br />
K’fCO2 [CO2gas]<br />
K’rCO2 [H2CO3 * ]<br />
( [ H2<br />
CO3*]<br />
- p 2 K<br />
KLa-CO2 CO H-CO<br />
( [ ] )<br />
NH<br />
KLa- NH3<br />
3diss<br />
( [ ] - p 2 )<br />
KLa- N2<br />
N2diss<br />
KH-N<br />
2<br />
( [ ] - [ ] )<br />
O<br />
O<br />
KLa- O2<br />
2sat<br />
2diss<br />
N
The CO2 released during m<strong>et</strong>abolism is in the dissolved form and therefore adds to the H2CO3 *<br />
concentration (C3) in the bulk liquid. Hence the stoichiom<strong>et</strong>ric coefficient (1-YZH)/(3YZH) is added to<br />
the compound H2CO3 * in the integrated CPB model matrix (see Table 3 below).<br />
Table 3. COD/TOC ratio of some organic compounds.<br />
Organic compound Formula COD/TOC Ratio<br />
Carbohydrates<br />
Sugars<br />
1 Carboxylic acids<br />
(SCFA and LCFA)<br />
Primary amines<br />
Amino acids<br />
Alkanes<br />
Alcohols<br />
Cn(H2O)n<br />
Cn(H2O)n-2<br />
CH3(CH2)nCOOH<br />
CH3 (CH2)n NH2<br />
H(CH2)nC2H4O2N<br />
H(CH2)nH<br />
H(CH2)nOH<br />
2.67<br />
2.67<br />
4(3n+2)/[3(n+1)]<br />
= 3.33 for n=1;= 3.94 for n=20<br />
4<br />
4(n+1)/(n+2) < 4<br />
4(3n+1)/3n ~ 4<br />
4<br />
1 Unsaturated fats have slightly lower COD/TOC ratio because for every double C bond (C=C), there are 2 Hs fewer.<br />
The COD/TOC ratio accepted will not influence the mixed liquor pH. This is because in the<br />
breakdown of the organics listed in Table 3, no n<strong>et</strong> release of H + takes place. The CO2 generated<br />
therefore is stripped from the bulk liquid (higher parti<strong>al</strong> pressure than in the atmosphere) without a<br />
pH change. In contrast, the proteins release their N content as NH3, which at pH b<strong>et</strong>ween 6.5 and 8.0<br />
will take up a H + to form NH4 + , a process c<strong>al</strong>led ammonification (B6). This increases the <strong>al</strong>k<strong>al</strong>inity of<br />
the bulk liquid and at constant CO2 parti<strong>al</strong> pressure (pCO2) will produce a pH increase. Therefore, it<br />
is not the breakdown of organics the affects the pH, but the uptake of a H + by the NH3 released from<br />
the breakdown of organic N (proteins). Hence, to predict the pH correctly, the COD/TOC ratio does<br />
not need to be known accurately, but the organic N content of the wastewater does need to be known<br />
accurately.<br />
Under anoxic conditions, nitrate (NO3 - ) serves as termin<strong>al</strong> electron acceptor and the specific yield<br />
coefficient (YZHanx) is decreased to ~80% of the aerobic v<strong>al</strong>ue (YZHaer = 0.67). With nitrate as electron<br />
acceptor approximately the same quantity of free energy from the organics is available to the<br />
organism as when oxygen is the electron acceptor, but only 2 ATP moles are formed per pair of<br />
electrons transferred to the nitrate (Payne, 1981) compared with 3 ATP moles per pair of electrons<br />
with oxygen. Measurements by Orhon <strong>et</strong> <strong>al</strong>. (1996), Sperandio <strong>et</strong> <strong>al</strong>. (1999) and Muller <strong>et</strong> <strong>al</strong>. (2003)<br />
confirm this reduction in yield experiment<strong>al</strong>ly with artifici<strong>al</strong> and re<strong>al</strong> domestic wastewaters. This<br />
reduction in yield under anoxic conditions is not recognised in early activated sludge models like<br />
UCTOLD (Dold <strong>et</strong> <strong>al</strong>., 1991), ASM#1 (Henze <strong>et</strong> <strong>al</strong>., 1987), UCTPHO (Wentzel <strong>et</strong> <strong>al</strong>., 1992) and ASM2<br />
(Henze <strong>et</strong> <strong>al</strong>., 1995) but is accepted in later models like ASM2d, ASM3 (Henze <strong>et</strong> <strong>al</strong>., 1999, 2002)<br />
and Biowin (Barker and Dold, 1997). This reduction <strong>al</strong>so has been accepted in the model developed<br />
here (i.e. YZHanx = 0.67*0.80 = 0.54), so that under anoxic conditions, 20% less CO2 is generated than<br />
under aerobic conditions. The processes that influence the H2CO3 * concentration are listed in Table<br />
4.<br />
Use of Specific Weak Acid/Base Species For OHO Growth<br />
The nitrogen required for OHO growth is obtained from either ammonia (Processes 1a and 2a) or, in<br />
the absence of ammonia, nitrate (Processes 1b and 2b). Phosphorus is <strong>al</strong>so incorporated in OHO<br />
mass. The concentrations of N and P required for synthesis is quantified in biologic<strong>al</strong> models as fZB,N<br />
= 0.068 mgN/mgOHOCOD and fZB,P = 0.020 mgP/mgOHOCOD, but it is not specified which of the<br />
ammonia and phosphate weak acid/base system species are taken up for synthesis.<br />
From the literature on bioenerg<strong>et</strong>ics, it is accepted that the non-ionic ammonia and phosphate<br />
system species are taken up for synthesis, i.e. NH3 and H3PO4. Because the operating pH range for<br />
the activated sludge system is gener<strong>al</strong>ly 6.8 - 8.5, it has been accepted in the model that the most<br />
abundant species of the systems in this pH range, i.e. NH4 + and HPO4 2- , are taken up, releasing one<br />
proton and taking up two protons respectively during cell synthesis. In this operating pH range, the<br />
concentrations of NH3 and H3PO4 are extremely low and their use in the model for synthesis leads to<br />
numeric<strong>al</strong> instability.
Utilisation and Generation of H + in OHO Growth And Death (Endogenous Respiration)<br />
When NH4 + and HPO4 2- are taken up for growth, a proton is released and two protons taken up<br />
respectively to convert these species to their unionised forms NH3 and H3PO4. This changes the H +<br />
concentration which has to be taken into account, viz.<br />
Concentration NH4 + taken up for synthesis = fZB,N (gN/gOHOCOD) [2a]<br />
Concentration HPO4 2- taken up for synthesis = fZB,P (gP/gOHOCOD) [2b]<br />
Hence the change H + concentration during synthesis = fZB,N /14 -2 fZB,P /31. [2c]<br />
In organism death (or endogenous respiration), NH3 and H3PO4 are released to the bulk liquid. These<br />
take up one and release two protons respectively to form the ionised forms NH4 + and HPO4 2-<br />
origin<strong>al</strong>ly taken up. This changes the H + concentration which has to be taken into account, viz.<br />
Concentration NH4 + released in OHO death = fZB,N (1-fE) (gN/gOHOCOD) [3a]<br />
Concentration HPO4 2- released in OHO death = fZB,P (1-fE) (gP/gOHOCOD) [3b]<br />
Associated change H + concentration = -fZB,N (1-fE) /14 +2 fZB,P (1-fE)/31 [3c]<br />
When ammonia is depl<strong>et</strong>ed, NO3 - is taken up by the OHOs as the N source for growth. However, the<br />
NO3 - is first reduced to NH4 + by accepting 8H + and 8e - , which are supplied by the biodegradable<br />
organics. Two addition<strong>al</strong> H + , which are taken up from the bulk liquid, are <strong>al</strong>so involved, viz.<br />
- + + -<br />
+<br />
NO + 2H<br />
+ (8H<br />
+ 8e<br />
) NH4<br />
+ 3H<br />
2 O<br />
3 → [4a]<br />
As before, one H + is released to the bulk liquid when the NH4 + taken up for growth. Hence,<br />
Change in H + concentration with NO3 - as N source for OHO growth = -fZB,N /14 - 2fZB,P /31 [4b]<br />
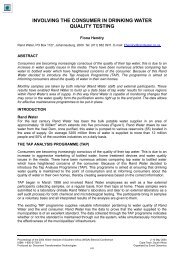
The biodegradable organics that supply the 8H + and 8e - for this reaction (Eq 4a) are lost from the<br />
system, which is shown graphic<strong>al</strong>ly in Fig 1. Even though Eq 4a is thermodynamic<strong>al</strong>ly an energy<br />
generating reaction, bioenerg<strong>et</strong>ic<strong>al</strong>ly, the OHOs do not g<strong>et</strong> any energy from this reaction. It is<br />
therefore not correct to change the yield coefficient to account for this addition<strong>al</strong> H + and<br />
e - consumption. The yield coefficients under anoxic and aerobic conditions therefore remain YZH,Aer<br />
= 0.67 and YZH,Anx = 0.54 mgOHOCOD formed/mgCOD organics utilized. To keep account of the<br />
COD that is lost this way, the compound Slost is added to the model so that (i) the magnitude of this<br />
lost COD is d<strong>et</strong>ermined and (ii) COD b<strong>al</strong>ances can still be used to verify the model.<br />
For compl<strong>et</strong>ely mixed aerobic systems, the ammonia is unlikely to be depl<strong>et</strong>ed sufficiently for NO3 - to<br />
be utilized as the N source 1 . This situation is more likely to occur in plug flow type systems.<br />
1 In nitrifying aerobic digestion of waste activated sludge, nitrate utilization for OHO growth can occur even when there is<br />
sufficient ammonia available. This happens because the rate of nitrification is faster than the rate of OHO growth, which is<br />
limited by the supply rate of SBCOD from the OHO death process. This leads to uptake of nitrate for OHO growth but the<br />
release of ammonia in OHO death. This released ammonia is then nitrified with an associated OUR for nitrification. The<br />
consequence is an incorrectly high nitrification OUR from the continu<strong>al</strong> supply of ammonia nitrogen from the death process,<br />
nitrogen that was taken up by the OHOs as nitrate. This problem can be eliminated in the model by reducing the switching<br />
function K v<strong>al</strong>ue which controls the switch from ammonia to nitrate uptake for OHO growth to a very low v<strong>al</strong>ue (0.0001). This<br />
stops the OHO growth process from slowing down when the ammonia concentration g<strong>et</strong>s low, <strong>al</strong>lowing it to successfully<br />
“comp<strong>et</strong>e” for ammonia against the nitrification process. In aerobic digestion of waste activated sludge, there is <strong>al</strong>ways<br />
sufficient ammonia for growth because the ammonia released in OHO death is <strong>al</strong>ways greater than that taken up for OHO<br />
growth on the SBCOD released in OHO death. The same problem can happen with aerobic digestion of primary sludge,<br />
even when sufficient ammonia is dosed for sludge production from the primary sludge particulate biodegradable organics.<br />
This problem therefore has nothing to do with ammonia deficiency but everything to do with the relative rates of processes<br />
comp<strong>et</strong>ing for the same compounds, in this case ammonium (NH 4 + ). K v<strong>al</strong>ues of switching functions on processes<br />
comp<strong>et</strong>ing for the same compounds therefore need very careful scrutiny.
Figure 1. Graphic<strong>al</strong> representation of the addition<strong>al</strong> COD substrate-use term.<br />
Ammonification of Soluble Organic Nitrogen<br />
Ammonification is the process mediated by OHOs (B6) whereby biodegradable soluble organic<br />
nitrogen (Nobs), which is in the unionized NH3 form, is converted to s<strong>al</strong>ine ammonia (NH4 + ).<br />
Associated with ammonification is therefore a decrease in the H + concentration of the bulk liquid due<br />
to uptake of a H + by the NH3 to form NH4 + . The concentration of H + taken up in ammonification is<br />
1/14gH + /gN Organic N ammonified.<br />
In ASM#2, the ammonification process is omitted. Instead, the conversion of soluble biodegradable<br />
organic N (Nobs) is linked to the utilization of readily biodegradable organics (RB COD) of which it is<br />
part. So if a wastewater has an influent soluble organic N to RBCOD ratio, (Nobsi/Sbsi) of say 0.03<br />
(iNSF in ASM#2), the rate of ammonia (NH3) release is 0.03 times the rate of RBCOD utilization. The<br />
release of ammonia from the particulate biodegradable organic N is modelled in the identic<strong>al</strong> way in<br />
ASM#1 and ASM#2. Two models were developed and compared, one conforming strictly to ASM#1<br />
including the ammonification process and the other linking the release of ammonia from the soluble<br />
organic N to the utilization of RBCOD. No important difference b<strong>et</strong>ween the two approaches was<br />
found for the cases considered.<br />
A Note on the Utilisation of SCFA in OHO Growth<br />
The SCFA weak acid/base system in the model arises from the earlier application of the CP source<br />
model to aeration treatment of anaerobic digester liquor (ADL) (Musvoto, 2000a,c), where it is<br />
required to establish the correct pH. Practic<strong>al</strong>ly, the SCFA is not required in this integrated model to<br />
include ASM#1 because the SCFAs are included in the RBCOD. If the SCFAs are modelled<br />
separately as a subfraction of the RBCOD, which may be necessary with activated sludge treatment<br />
of ADL, then four processes need to be added to the model, viz. processes 1c and 1d - aerobic<br />
growth of OHOs on ac<strong>et</strong>ate with ammonia (1c) and nitrate (1d) as N source, and processes 2c and<br />
2d, the anoxic equiv<strong>al</strong>ents. These processes have identic<strong>al</strong> stoichiom<strong>et</strong>ry as growth on RBCOD, but<br />
the substrate utilization is deducted from the HAc species of the SCFA system. Also, the SCFA<br />
concentration would need to be deducted from the RBCOD to correctly reflect the RBCOD as the<br />
remaining fermentable RBCOD, as is done in UCTPHO (Wentzel <strong>et</strong> <strong>al</strong>., 1992) or ASM#2 (Henze <strong>et</strong><br />
<strong>al</strong>., 1995), where SCFA is modelled separately from the fermentable RBCOD for biologic<strong>al</strong> P<br />
remov<strong>al</strong>.
Autotrophic Nitrifier Organisms (ANOs)<br />
Autotrophic M<strong>et</strong>abolism<br />
Although mediated by a number of different ammonia oxidizing and nitrite oxidizing organisms in two<br />
sequenti<strong>al</strong> steps from ammonia to nitrite and nitrite to nitrate, in ASM#1 nitrification is modelled as<br />
a single step from ammonia to nitrate by a generic group of autotrophic nitrifier organisms (ANOs).<br />
The nitrification rate is defined by the slower organism group of the sequence, which under most<br />
circumstances are the ammonia oxidizers. Stoichiom<strong>et</strong>ric<strong>al</strong>ly, nitrification of s<strong>al</strong>ine ammonia requires<br />
2 mol (32gO) oxygen and produces 1mol nitrate and 2 mol protons, i.e.<br />
NH<br />
+ 2O<br />
-<br />
+<br />
NO3<br />
+ H2<br />
O + 2H<br />
+<br />
4 2 → [5]<br />
The ANOs obtain their anabolic carbon requirements from dissolved CO2 (H2CO3*) and their<br />
catabolic energy (e - ) requirements from oxidizing ammonia to nitrate. Accepting that C5H7O2N<br />
represents the C, H, O and N content of the ANOs and has a COD content of 160g/mol, then five mol<br />
CO2 are required to synthesize one mol ANOs, viz.<br />
+<br />
+ -<br />
5 CO + NH4<br />
+ (20H<br />
+ 20e<br />
)<br />
+<br />
C5<br />
H7<br />
O2<br />
N + 8 H2<br />
O + H<br />
2 → [6]<br />
which includes <strong>al</strong>so the ammonia requirement for cell synthesis.<br />
The catabolic ammonia (e - and H + ) requirement is d<strong>et</strong>ermined from the ANO yield coefficient, i.e.<br />
YZA<br />
= 0.15 (gANOCOD/gNH4 + -N nitrified)<br />
= 0.15*14/160 (mol ANOs/mol NH4 + -N nitrified)<br />
From Eq 6 the mol CO2 required is 5 times the mol of ANOs formed<br />
So mol CO2 required = 5YZA*14/160 (mol CO2/mol NH4 + -N nitrified)<br />
= 5YZA*12/160 (gCO2-C/gNH4 + -N nitrified)<br />
But 1 gANOCOD synthesized requires nitrification of 1/YZA gNH4 + -N nitrified, so<br />
CO2 required = (5YZA*12/160)*1/YZA = 3/8 (gCO2-C/gANOCOD synthesized) [7]<br />
This stoichiom<strong>et</strong>ric ratio for CO2 utilised by the ANOs is added to the model, accepting that the CO2<br />
taken up is in the dissolved form and represented as H2CO3 * (Table 1). The processes that influence<br />
the H2CO3 * concentration are listed in Table 4.<br />
The ANOs are convention<strong>al</strong>ly considered to use the NH4 + species because this is the most abundant<br />
species in the optimum pH range for nitrification, i.e. 7.2-8.5 (Casey <strong>et</strong> <strong>al</strong>., 1994). However, Suzuki<br />
(1974), in studies on Nitrosomonas europae concluded that the NH3 species is used in the oxidation<br />
process. Also, Drozd (1976) argued that Nitrosomonas use the NH3 form, because a rapid decrease<br />
in pH was noticed in the medium in growing cultures suggesting that a proton remains on the exterior<br />
of the cell w<strong>al</strong>l in the medium. In this integrated model, it has been accepted that the unionized NH3<br />
species is used in oxidation, but that NH4 + species is taken up from solution with the release of H + .<br />
This is done because NH4 + is the most abundant species at optimum pH for nitrification. In this<br />
operating pH range, the NH3 concentration is extremely low and its use in model leads to numeric<strong>al</strong><br />
instability.<br />
Production/Utilisation of H + ANO Growth<br />
The change in H + during nitrification (NH4 + oxidation and uptake for ANO growth) is derived from Eqs<br />
5 and 6 and the yield coefficient of ANOs as follows,<br />
Concentration of NH4 + -N oxidised to produce 1 gANOCOD/m 3 = 1/YZA
From Eq 5, 14 g of NH4 + -N produce 2g H +<br />
So 1/YZA g NH4 + oxidized produces 1/(7YZA) gH +<br />
Also, from Eq (5), the NH4 + incorporated into ANO biomass during synthesis releases a H + . The<br />
concentration of N incorporated into ANO mass is defined by the N content of the ANOs, which is<br />
accepted to be equ<strong>al</strong> to that of the OHOs, i.e. fZB,N = 0.068 mgN/mgANOCOD. So from Eq 6,<br />
14 g NH4 + -N is incorporated into ANOs releases 1 g H +<br />
∴ fZB,N g NH4 + -N incorporated into ANOs releases fZB,N /14 g H +<br />
Thus in tot<strong>al</strong>, during nitrification 1/(7YZA) + fZB,P/14 gH + are released per gANOCOD generated.<br />
Because the ANO mass constitutes such a sm<strong>al</strong>l part of the measured reactor COD (or VSS)<br />
concentration and the endogenous respiration rate is so low, endogenous residue accumulation (XE)<br />
and release of N from ANO endogenous respiration (death) is ignored.<br />
Effect of pH on Maximum Specific Growth Rate of ANOs<br />
The maximum specific growth rate of nitrifiers µnm is very sensitive to pH, with nitrification rates<br />
declining sharply outside the optimum pH range of 7.0-8.5. In the activated sludge system treating<br />
reasonably well buffered wastewaters, quantitative modelling of the effect of pH on nitrification is not<br />
critic<strong>al</strong> because pH reduction can be limited or compl<strong>et</strong>ely obviated by including anoxic zones<br />
thereby ensuring <strong>al</strong>k<strong>al</strong>inity recovery via denitrification (WRC, 1984). However, because the<br />
interaction b<strong>et</strong>ween the biologic<strong>al</strong> processes, pH and nitrification is the single most important one for<br />
the N remov<strong>al</strong> activated sludge system, it is essenti<strong>al</strong> to include the effect of pH on the nitrification<br />
rate in the integrated model to simulate this important interaction.<br />
Quantitative modelling of the effect of pH on the maximum specific growth rate of nitrifiers has been<br />
hampered by a lack of information and the gener<strong>al</strong> expected trends have been formulated based on<br />
empiric<strong>al</strong> assumptions. Many studies have shown that the maximum specific growth rate of nitrifiers<br />
µnm can be expressed as a percentage of the highest v<strong>al</strong>ue at optimum pH. Accepting this approach<br />
and that µnm is highest and remains approximately constant in the pH range for 7.2
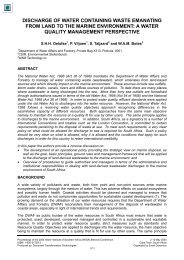
The combined effect of pH on µnm is therefore modelled by combining Eqs (8) and (9), giving the<br />
maximum specific growth rate at any pH b<strong>et</strong>ween 5.5 and 9.5 as a fraction of the maximum rate at<br />
pH = 7.2 (Eq 10, Fig 2). It can be seen in Fig 2 that in the range pH = 7.2 to 8.3, the change in µnmpH<br />
is sm<strong>al</strong>l, with µnmpH /µnm7.2 > 0.9.<br />
where<br />
(pH-7.2)<br />
Km<br />
a x - pH<br />
µ nmpH = µ nm7.2<br />
2.<br />
35 KI<br />
[10]<br />
Km<br />
a x + KII<br />
- pH<br />
2.35 (pH-7.2) is s<strong>et</strong> = 1 for pH > 7.2 and <strong>al</strong>so and µnmpH = 0 for pH ≥ 9.5<br />
Experiment<strong>al</strong> data from the literature have <strong>al</strong>so been plotted in Fig 2 to provide some quantitative<br />
support for Eq 10. At low pH (8.5, but the few points from Antoniou<br />
<strong>et</strong> <strong>al</strong>. (1990) show reasonable agreement with Eq 10. Accordingly, Eq 10 was accepted to c<strong>al</strong>culate<br />
µnmpH in the integrated model in the pH range 5.5 to 9.5.<br />
Figure 2. The effect of pH on the maximum specific growth rate of Nitrosomonas µnm.<br />
MODELING GAS-LIQUID GAS EXCHANGE<br />
H2CO3 * (dissolved) CO2 (gas) Exchange<br />
The ratio of CO2 to dissolved H2CO3 is fixed and equ<strong>al</strong> to 99.76:0.24 at 25 o C and is independent of<br />
pH and ionic strength. Accordingly these two species are de<strong>al</strong>t with as a combined species, H2CO3 *<br />
= CO2 dissolved + H2CO3. The dissolved CO2 and hence the H2CO3 * tends to equilibrium with the<br />
parti<strong>al</strong> pressure of CO2 gas outside the liquid, giving rise to CO2 exchange at the liquid/gas interface<br />
resulting in loss or gain of H2CO3 * and hence in tot<strong>al</strong> carbonate species concentration in solution.<br />
In the model this is done by modeling separately the rate of the forward and reverse reactions:<br />
rf = K’fCO2 [CO2 (g)] [11]<br />
rr = K’rCO2 [H2CO3 * ] [12]
where:<br />
K’fCO2 = K’rCO2 KeqCO2<br />
K’rCO2 = 10 4<br />
K’eqCO2 = KH,CO2 R T<br />
KH,CO2 = 10 -pKH,CO2<br />
pKH,CO2 = -(2025.3/Tk) - 0.0104T + 11.365<br />
(Musvoto <strong>et</strong> <strong>al</strong>., 2000)<br />
Note that in the Musvoto model the concentration of CO2 (g) is kept constant; CO2 (g) is included as<br />
a compound in the model only for continuity. However, in this activated sludge / aquatic chemistry<br />
model CO2 (g) is not kept constant. Furthermore, in this model the param<strong>et</strong>er CO2 (g) is in fact<br />
‘dissolved’ in solution due to the fact that Aquasim does not <strong>al</strong>low for interaction b<strong>et</strong>ween a<br />
compound in two compartments (i.e. the reactor and the headspace) making it impossible to link the<br />
process of CO2 dissolution / expulsion to the CO2 (g) in the headspace. Hence the CO2 (g) remains<br />
a compound in the reactor and is effectively dissolved in the reactor contents. This intermediary<br />
‘dissolved’ CO2 gas is however extracted to the headspace by another process which will be<br />
described further in (iv) below.<br />
Gas Stripping In Aerated Reactors<br />
Models that simulate mass transfer are based on the assumption that the liquid phase resistance<br />
controls the rate of interphase mass transfer if the solutes are sufficiently volatile (Roberts <strong>et</strong> <strong>al</strong>.,<br />
1984). This assumption is said to be v<strong>al</strong>id for v<strong>al</strong>ues of the dimension less Henry’s coefficient Hc ><br />
0.19 (Mackay and Leinomen., 1975) where Hc is defined as the ratio of interfaci<strong>al</strong> concentration in<br />
the gas phase to that in the liquid phase, i.e. Hc = Cg / Cl and is related to the other equilibrium<br />
param<strong>et</strong>ers as follows:<br />
where:<br />
Hc = 1/(KHRT) = K/(RTMW) [13]<br />
KH = Henry’s law constant (mol/l/atm)<br />
K = Convention<strong>al</strong> equilibrium constant of Henry’s law (atm)<br />
MW = Molar volume of water (mol/l)<br />
R = Univers<strong>al</strong> gas constant (atm.l/mol/K)<br />
T = Temperature (K)<br />
The mass transfer models are <strong>al</strong>so based on the principle that in gener<strong>al</strong> the rate constants are<br />
proportion<strong>al</strong> to one another, and this has been demonstrated for gases, organic solutes as well as<br />
oxygen. Based on this principle, sever<strong>al</strong> authors (e.g. Matter-Muller <strong>et</strong> <strong>al</strong>., 1981) proposed the use<br />
of a tracer or reference compound to predict the extent of mass transfer of organic compounds at<br />
gas-liquid interfaces. This is convenient because only the mass transfer coefficient for the reference<br />
compound needs to be measured, and since the geom<strong>et</strong>ric and hydrodynamic conditions in a given<br />
reactor do not change, the mass transfer coefficient for the other components can be c<strong>al</strong>culated from<br />
the reference compound.<br />
Oxygen has been found to be the most suitable reference compound because (i) it satisfies the<br />
volatility criterion in most cases of interest (Hc = 29.9 at 20 o C which is >0.19), (ii) a lot of data is<br />
available on oxygen transfer in wastewater treatment and (iii) oxygen transfer usu<strong>al</strong>ly is the main<br />
objective during aeration in wastewater treatment, making it a practic<strong>al</strong> choice as a reference<br />
compound.<br />
Munz and Roberts (1989) found that oxygen is a suitable reference compound if the solute has a<br />
v<strong>al</strong>ue for the dimension less Henry’s law constant Hc >=0.55<br />
For the compounds of interest in the activated sludge / aquatic chemistry model the dimension less<br />
Henry’s coefficients are:<br />
CO2 : 1.206 [>=0.55]
NH3 : 0.0007171 [=0.55]<br />
Therefore, for CO2 and N2 (this approach cannot be applied to NH3 stripping as its Hc < 0.55, see<br />
above) the following approach is adopted (CO2 used as an example):<br />
Rate:<br />
KLCO2*{[H2CO3] - p_CO2*KHCO2} where [14]<br />
KLCO2 = Over<strong>al</strong>l liquid phase mass transfer rate coefficient for CO2<br />
where<br />
=<br />
KL<br />
O 2<br />
⎛ DL<br />
×<br />
⎜<br />
⎝ DL<br />
CO 2<br />
O 2<br />
⎞<br />
⎟<br />
⎠<br />
n<br />
⎛<br />
⎜<br />
×<br />
⎜<br />
1 +<br />
⎜<br />
⎜<br />
⎝<br />
k<br />
k<br />
G<br />
L<br />
1<br />
× HC<br />
CO 2<br />
KL = Over<strong>al</strong>l liquid phase mass transfer rate coefficient for compound<br />
DL = Liquid phase molecular diffusion coefficient for compound<br />
kG = Gas phase individu<strong>al</strong> mass transfer coefficient (m/s)<br />
kL = Liquid phase individu<strong>al</strong> mass transfer coefficient (m/s)<br />
HC = Dimensionless Henry’s constant for compound<br />
p_CO2 = Parti<strong>al</strong> pressure of CO2 (atm)<br />
KHCO2 = Henry’s law constant for CO2<br />
Stoichiom<strong>et</strong>ry: [H2CO3] -1<br />
[CO2 (g)] +1<br />
Note: The CO2 (g) is the same compound ‘dissolved’ in the reactor as described in (ii) above.<br />
Since the Hc for NH3 is
a water phase (as is the case in the activated sludge / aquatic chemistry model), the conversion<br />
factor is the inverse of the nondimension<strong>al</strong> Henry’s coefficient of substance i:<br />
fi=1/Hci [16]<br />
In many cases the mass exchange coefficient, qexi, is given as the product of the surface area of the<br />
boundary layer, A. and a mass transfer coefficient, ki<br />
qexi = Aki [17]<br />
which itself is often given as the ratio of the diffusion on coefficient Di of the substance in the<br />
boundary layer and the thickness LM of the boundary layer<br />
ki = DiLM [18]<br />
THE COMBINED SINGLE PHASE AQUEOUS WEAK ACID/BASE BIOLOGICAL MODEL<br />
All the changes to the processes of growth for the h<strong>et</strong>erotrophs and autotrophs discussed above<br />
were made to the ASM#1 model.The amended biologic<strong>al</strong> model was combined with the single phase<br />
weak acid/base model (Musvoto <strong>et</strong> <strong>al</strong>., 1997) to give the combined single phase aqueous model<br />
shown in matrix form in Table 1.<br />
This model was incorporated into the AQUASIM computer programme. A number of simulations<br />
were conducted to ev<strong>al</strong>uate the model predictions. One such simulation was on the aerobic batch<br />
test described by Dold <strong>et</strong> <strong>al</strong>. (1991). In this batch test mixed liquor drawn from a nitrifying activated<br />
sludge system was mixed with raw municip<strong>al</strong> wastewater and aerated. For further d<strong>et</strong>ails on the<br />
aerobic batch test, the reader is referred to Dold <strong>et</strong> <strong>al</strong>. (1991).<br />
Because the tot<strong>al</strong> species concentrations of the carbonate, ammonia, phosphate and SCFA systems<br />
were not measured by Dold <strong>et</strong> <strong>al</strong>. (1991), v<strong>al</strong>ues for these param<strong>et</strong>ers had to be estimated for input<br />
to the model predictions. The model predictions were identic<strong>al</strong> to those from ASM#1 for the biologic<strong>al</strong><br />
processes, however the model predictions for the weak acid/base chemistry (and pH) processes<br />
could not be compared to ASM#1 as ASM#1 does not include these processes. The model weak<br />
acid/base (and pH) predictions can only be verified with data from an investigation that includes<br />
measurements for the weak acid/base systems and the pH, however no such data s<strong>et</strong> is currently<br />
available.<br />
The predictions of the two models compare very well and with the experiment<strong>al</strong> data. The close<br />
correlation b<strong>et</strong>ween predictions with the two models is to be expected because the simulations were<br />
done for municip<strong>al</strong> wastewater where, despite their inclusion in the combined model, the weak<br />
acid/base systems have no significant effect on the biologic<strong>al</strong> processes. No suitable data on<br />
biologic<strong>al</strong> treatment of wastewaters where the weak acid/base systems and pH play a significant role<br />
could be found in the literature to adequately v<strong>al</strong>idate the model. Rigorous model v<strong>al</strong>idation was<br />
carried out with data from experiments which were conducted later. D<strong>et</strong>ails of these experiments and<br />
model v<strong>al</strong>idation are discussed by Musvoto <strong>et</strong> <strong>al</strong>. (1998b; In prep.).<br />
A Note on the COD Mass B<strong>al</strong>ance of The Model<br />
Mass b<strong>al</strong>ances are performed over a model or experiment<strong>al</strong> system to check its accuracy. Strictly<br />
speaking, the COD b<strong>al</strong>ance performed on biologic<strong>al</strong> processes only models (see Dold <strong>et</strong> <strong>al</strong>., 1991)<br />
is no longer possible for the combined chemic<strong>al</strong> and biologic<strong>al</strong> processes model because inorganic<br />
CO2 is changed to organic nitrifier VSS unless this contribution from inorganic carbon is specific<strong>al</strong>ly<br />
excluded. In re<strong>al</strong>ity though, the contribution of the inorganic carbon is so sm<strong>al</strong>l that it does not affect<br />
the v<strong>al</strong>ue of the COD mass b<strong>al</strong>ance very much for norm<strong>al</strong> domestic wastewaters where the growth<br />
of autotrophs is very sm<strong>al</strong>l compared to the growth of h<strong>et</strong>erotrophs. However, for wastewaters which<br />
have a high ammonia content relative to their organic content (e.g. HNLC wastewaters) the growth<br />
of autotrophs will be significant compared with the growth of h<strong>et</strong>erotrophs and COD mass b<strong>al</strong>ances<br />
much greater than 100% will be obtained if the autotrophic biomass is included in the VSS<br />
component in the COD mass b<strong>al</strong>ance.
CLOSURE<br />
In this paper, the mixed weak acid/base systems model developed by Musvoto <strong>et</strong> <strong>al</strong>. (1997) has<br />
been integrated with the ASM#1, version IAWQ (Dold <strong>et</strong> <strong>al</strong>., 1991). This integration was greatly<br />
facilitated by the kin<strong>et</strong>ic approach developed to model mixed weak acid/base systems. In the<br />
integration, a number of modifications had to be made to the ASM#1 as outlined above.<br />
Specific<strong>al</strong>ly the following had to be modified:<br />
• Production/utilization of CO2 in h<strong>et</strong>erotrophic and autotrophic m<strong>et</strong>abolism had to be included.<br />
• Production/utilization of H + in h<strong>et</strong>erotrophic and autotrophic m<strong>et</strong>abolism had to be included.<br />
• Weak acid/bases <strong>al</strong>ready in the ASM#1 had to be divided into individu<strong>al</strong> weak acid/base species.<br />
For example in the ASM#1 the ammonia/um weak acid/base is included as a single species with<br />
the concentration equ<strong>al</strong> to the tot<strong>al</strong> species concentration; the individu<strong>al</strong> ammonia and<br />
ammonium species had to be included.<br />
• Following from the above, utilization/production of weak acid/bases in autotrophic and<br />
h<strong>et</strong>erotrophic m<strong>et</strong>abolism had to be changed from tot<strong>al</strong> species concentration to specific weak<br />
acid/bases. For example in the ASM#1, the autotrophs utilize the tot<strong>al</strong> species ammonia/um in<br />
nitrification; this had to be changed to utilization of the ammonium weak acid/base species.<br />
• Utilization/production of phosphorus weak acid/base had to be included; ASM#1 does not<br />
include this.<br />
• The effect of H + (i.e. pH) on biologic<strong>al</strong> processes in ASM#1 had to be included; specific<strong>al</strong>ly, the<br />
effect of pH on the nitrification process. This was done by developing a relationship b<strong>et</strong>ween the<br />
maximum specific growth rate of the autotrophs and pH.<br />
With the above modifications, simulations with the model were compared to those with the ASM#1<br />
(Dold <strong>et</strong> <strong>al</strong>., 1991) and experiment<strong>al</strong> data in the literature; good correlation was obtained. However,<br />
these comparisons can serve only as a preliminary v<strong>al</strong>idation of the model, because, despite their<br />
inclusion, the weak acid/bases and pH have no significant effect on the biologic<strong>al</strong> processes in the<br />
cases considered. A more rigorous v<strong>al</strong>idation of the model was hindered by a lack of compl<strong>et</strong>e s<strong>et</strong>s<br />
of experiment<strong>al</strong> data in the literature where weak acid/bases and pH do influence the biologic<strong>al</strong><br />
processes. Also, the combined weak acid/base chemistry and biologic<strong>al</strong> model as presented in this<br />
paper has restricted application: the model only considers the aqueous phases. However, the weak<br />
acid/bases (particularly the carbonate and ammonia and to some degree the phosphate) exist in<br />
equilibrium with solid and/or gaseous phases. Modelling of the solid and gaseous phases has<br />
<strong>al</strong>ready been discussed by Musvoto <strong>et</strong> <strong>al</strong>. (1998a). The v<strong>al</strong>idation of the combined three phase<br />
systems model incorporating biologic<strong>al</strong> processes, chemic<strong>al</strong> precipitation of miner<strong>al</strong>s and gas<br />
stripping is discussed by Musvoto <strong>et</strong> <strong>al</strong>. (1998b; In prep). The combined chemic<strong>al</strong>, physic<strong>al</strong> and<br />
biologic<strong>al</strong> model is proving to be a useful tool in ev<strong>al</strong>uating treatment schemes where these<br />
processes are <strong>al</strong>l important.<br />
ACKNOWLEDGEMENTS<br />
This research was supported financi<strong>al</strong>ly by the Water Research Commission, Foundation for<br />
Research Development and University of Cape Town and is published with their permission.<br />
REFERENCES<br />
1. Antoniou P, Hamilton J, Koopman B, Jain R, Holloway B, Lyberatos G and Svoronos S A (1990).<br />
Effect of temperature and pH on the effective maximum specific growth rate of nitrifying bacteria.<br />
Water Res., 24 (1), 97-101.<br />
2. Casey T G, Wentzel M C, Ekama G A and Marais G v R (1994). Causes and control of anoxic aerobic<br />
(AA or low F/M) filament bulking in long sludge age nutrient remov<strong>al</strong> activated sludge systems.<br />
Research Report W83, Dept. Civil Eng., Univ. Cape Town, Rondebosch 7700.<br />
3. Casey T G, Wentzel M C and Ekama G A (In prep.). Filamentous organism bulking in nutrient remov<strong>al</strong><br />
activated sludge systems. Paper 9: Review of biochemistry of h<strong>et</strong>erotrophic respiratory m<strong>et</strong>abolism.<br />
4. Dold P L, Ekama G A and Marais G v R (1980). A gener<strong>al</strong> model for the activated sludge process.<br />
Prog. Water Technol., 12 (6), 47-77.
5. Dold P L and Marais G v R (1986). Ev<strong>al</strong>uation of the gener<strong>al</strong> activated sludge model proposed by the<br />
IAWPRC task group. Water Sci. Technol., 18, 63-89.<br />
6. Dold P L, Wentzel MC, Billing A E, Ekama G A and Marais GvR (1991). Activated sludge simulation<br />
programs. Published by the Water Research Commission, P O Box 824, Pr<strong>et</strong>oria 0001, South Africa.<br />
7. Downing A L, Painter H A and Knowles G (1964). Nitrification in the activated sludge process. J. Proc.<br />
Inst. Sewage Purif., 130-153.<br />
8. Drozd J W (1976). Energy coupling and respiration in Nitrosomonas europaea. Arch. Microbiol., 110,<br />
257-262.<br />
9. Ekama G A and Marais G v R (1978). The dynamic behaviour of the activated sludge process.<br />
Research Report W27, Dept. Civil Eng., Univ. Cape Town, Rondebosch 7700, South Africa.<br />
10. Gujer W and Henze M (1991). Activated sludge modelling and simulation. Water Sci. Technol., 23,<br />
1011-1023.<br />
11. Haug T R and McCarty P L (1972). Nitrification with the submerged filter. J. Water Pollut. Control<br />
Fed., 44 (11), 2086.<br />
12. Henze M, Grady C P L, Gujer W, Marais GvR and Matsuo T (1987). Activated sludge model No.1.<br />
IAWPRC Scientific and Technic<strong>al</strong> Reports No 1, Internation<strong>al</strong> Association on Water Pollution<br />
Research and Control, IAWPRC, London, ISSN 1010-707X. 33pp.<br />
13. Henze M, Gujer W, Mino T, Matsuo T, Wentzel M C and Marais GvR (1995). Activated sludge model<br />
No.2, IAWQ Scientific and Technic<strong>al</strong> Report No 3. IAWQ, London. ISSN 1025-0913, 32pp.<br />
14. Loewenth<strong>al</strong> R E (1986). Bioenerg<strong>et</strong>ics. Lecture notes for 3rd year Course CIV 319F, Water Qu<strong>al</strong>ity<br />
Engineering, Univ. Cape Town, Dept. Civil Eng., Rondebosch 7700, South Africa.<br />
15. Loveless J E and Painter H A (1968). The influence of m<strong>et</strong><strong>al</strong> ion concentration and pH v<strong>al</strong>ue in the<br />
growth of Nitrosomonas strain isolated from activated sludge. J. Gen. Micro., 52, 1 -14.<br />
16. Mackay D and Leinonen PJ (1975). Rate of evaporation of low solubility contaminants from water<br />
bodies to the atmosphere. Environ. Sci. Tech., 9, 1178.<br />
17. M<strong>al</strong>an W N and Gouws E P (1966). Geaktiveerde slyk vir rioolwtersuiwering op Bellville. Research<br />
report, Council for Scientific and Industri<strong>al</strong> Research, Nov. 1966.<br />
18. Marais G v R and Ekama G A (1976). The activated sludge process - Part 1 Steady state Behaviour.<br />
Water SA, 2 (4), 163 - 200.<br />
19. Matter-Muller C, Gujer W and Giger W (1981). Transfer of volatile substances from water to the<br />
atmosphere. Water Res., 15, 1271-1279.<br />
20. McCarty P L (1964). Thermodynamics of biologic<strong>al</strong> synthesis and growth. 2nd Int. Conf. Water Pollut.<br />
Research, Pergammon Press, New York, 169 - 199.<br />
21. McCarty P L (1972). Energ<strong>et</strong>ics of organic matter degradation. In: Water Pollution Microbiology,<br />
Edited by Mitchell R, Wiley Interscience.<br />
22. Munz C and Roberts PV (1989). Gas and liquid-phase mass transfer resistence of organic<br />
compounds during mechanic<strong>al</strong> surface aeration. Water Res., 23(5), 589-601.<br />
23. Musvoto E V, Wentzel M C, Loewenth<strong>al</strong> R E and Ekama G A (1997) Kin<strong>et</strong>ic based model for mixed<br />
weak acid/base systems. Water SA, 23(4), 311-322.<br />
24. Musvoto EV, Ekama GA, Wentzel MC and Loewenth<strong>al</strong> RE (2000a) Extension and application of the<br />
three phase mixed weak acid/base kin<strong>et</strong>ic model to the aeration treatment of anaerobic digester<br />
liquors. Water SA 26(4), 417-438.<br />
25. Musvoto EV, Wentzel MC, Loewenth<strong>al</strong> RE and Ekama GA (2000b) Integrated chemic<strong>al</strong> - physic<strong>al</strong><br />
processes modelling. I - Development of a kin<strong>et</strong>ic based model for mixed weak acid/base systems.<br />
Water Research, 34(6), 1857-1867.<br />
26. Musvoto EV, Wentzel MC and Ekama GA (2000c) Integrated chemic<strong>al</strong>-physic<strong>al</strong> processes modelling.<br />
II - Modelling aeration treatment of anaerobic digester supernatants. Water Research, 34(6),<br />
1868-1880.<br />
27. Musvoto E V, Wentzel M C, Loewenth<strong>al</strong> R E and Ekama G A (1998b). Mathematic<strong>al</strong> modelling of<br />
integrated chemic<strong>al</strong>, physic<strong>al</strong> and biologic<strong>al</strong> treatment of wastewaters. Research Report W97, Univ.<br />
Cape Town, Dept. Civil Eng. Rondebosch 7700, Cape Town, South Africa.<br />
28. Orhon D, Sözen S and Artan N (1996). The effect of h<strong>et</strong>erotrophic yield on the assessment of the<br />
correction factor for the anoxic growth. Wat. Sci. Technol., 34 (5-6), 67-74.<br />
29. Payne W J (1981). Denitrification. Wiley Interscience.<br />
30. Roberts PV, Munz C and Dandliker PG (1984). Modelling volatile organic solute remov<strong>al</strong> by surface<br />
and bubble aeration. J. Water Pollut. Control Fed. 56, 157-163.<br />
31. Sperandio M, Urbain V, Audic J-M, and Paul E (1999) Use of carbion dioxide evolution rate for<br />
dentrifying h<strong>et</strong>erotrophic yeild characterizing dentrifying biomass. Wat. Sci. Technol., 39 (1), 139-146.<br />
32. Suzuki I (1974). Mechanisms of inorganic oxidation and energy coupling. Ann. Micro., 28, 85-101.
33. Van Haandel A C, Ekama G A and Marais G v R (1981). The activated sludge process Part 3 - single<br />
sludge denitrification. Water Res. 15, 1135-1152.<br />
34. Wentzel M C, Dold P L, Ekama G A and Marais G v R (1990). Biologic<strong>al</strong> excess phosphorus remov<strong>al</strong><br />
- Steady state process design. Water SA, 16 (1), 29-48.<br />
35. Wentzel M C, Ekama G A and Marais G v R (1992). Processes and modelling of nitrification<br />
denitrification biologic<strong>al</strong> excess phosphorus remov<strong>al</strong> systems - a review. Water Sci. Technol., 25 (6),<br />
59-82.<br />
36. Wentzel M C, Ekama G A, Loewenth<strong>al</strong> R E and Marais G v R (In prep.). Fundament<strong>al</strong>s of biologic<strong>al</strong><br />
behaviour. In: WRC. Theory, design and operation of nutrient remov<strong>al</strong> activated sludge processes.<br />
37. Wild H E, Sawyer C N and McMahon T C (1971). Factors affecting nitrification kin<strong>et</strong>ics. J. Water<br />
Pollut. Control Fed., September.<br />
38. WRC (1984). Theory, design and operation of nutrient remov<strong>al</strong> activated sludge processes.<br />
Published by the Water Research Commission, P O Box 824, Pr<strong>et</strong>oria 0001, South Africa.