Lerotholi, S. et al - eWISA
Lerotholi, S. et al - eWISA
Lerotholi, S. et al - eWISA

Create successful ePaper yourself
Turn your PDF publications into a flip-book with our unique Google optimized e-Paper software.
BIOASSESSMENT OF A RIVER IN A SEMI-ARID,<br />
AGRICULTURAL CATCHMENT, EASTERN CAPE<br />
S. <strong>Lerotholi</strong> 1 , C.G. P<strong>al</strong>mer 1 and K. Rowntree 2<br />
1<br />
Unilever Centre for Environment<strong>al</strong> Water Qu<strong>al</strong>ity, Institute for Water Research, Rhodes University,<br />
PO Box 94, Grahamstown 6139.<br />
2<br />
Geography Department, Catchment Group, Rhodes University, Grahamstown. Corresponding Author:<br />
Tel: (046) 622 2428 or 6224014. Fax: (046) 622 9427. E-mail: t<strong>al</strong>ly@iwr.ru.ac.za<br />
ABSTRACT<br />
The Kat River flows from a semi-arid agricultur<strong>al</strong> catchment in the Eastern Cape. The river is<br />
vulnerable to s<strong>al</strong>inisation, owing to the type of climate and geology. The problem is exacerbated by<br />
the predominance of citrus irrigation and sewage treatment plant effluent at Fort-Beaufort, the main<br />
urban centre in the catchment. An assessment of the s<strong>al</strong>inity in the Kat River catchment was<br />
carried out using; historic<strong>al</strong> water qu<strong>al</strong>ity data, time series plots and an ev<strong>al</strong>uation of the<br />
relationship b<strong>et</strong>ween flow and Tot<strong>al</strong> Dissolved Solids as a surrogate for s<strong>al</strong>inity. An addition<strong>al</strong> s<strong>al</strong>t<br />
load monitoring that included flow and electric<strong>al</strong> measurements was undertaken at the end of every<br />
month to assess the magnitude of s<strong>al</strong>t load transport in the catchment. Continuous s<strong>al</strong>inity<br />
measurements were taken at one of the DWAF weirs to monitor the relationship b<strong>et</strong>ween flow and<br />
s<strong>al</strong>inity more closely. Bioassessments were <strong>al</strong>so undertaken simultaneously so as to be able to<br />
relate s<strong>al</strong>inisation to ecologic<strong>al</strong> he<strong>al</strong>th. Different indices, SASS5 for macroinvertebrates, FAII for<br />
fish, RVI for riparian veg<strong>et</strong>ation and IHAS for the physic<strong>al</strong> habitat were used. The role played by<br />
s<strong>al</strong>inity on the macroinvertebrate community structure is being investigated by relating instream<br />
s<strong>al</strong>inity, s<strong>al</strong>inity tolerances and macroinvertebrate community composition.<br />
INTRODUCTION<br />
S<strong>al</strong>inisation has been identified as one of the main water qu<strong>al</strong>ity concerns in South Africa<br />
(1)(32)(33) and (14). Both natur<strong>al</strong> and anthropogenic factors may contribute to this high s<strong>al</strong>inity. A<br />
number of natur<strong>al</strong> processes are responsible for the high s<strong>al</strong>t concentration in the country’s water<br />
bodies. Evaporation can cause s<strong>al</strong>ts concentration to increase (32), as some of the water is lost in<br />
the atmosphere as water vapour. This phenomenon is prev<strong>al</strong>ent in arid and semi-arid<br />
environments (9), where the annu<strong>al</strong> rainf<strong>al</strong>l is exceeded by the annu<strong>al</strong> evaporation (4). In other<br />
parts of the World, aerosol spray from the sea are a major source of s<strong>al</strong>ts to the land and running<br />
water especi<strong>al</strong>ly in areas that are in the proximity of the sea (4). S<strong>al</strong>inisation in water bodies may<br />
<strong>al</strong>so be caused by the geology in an area (16). Sedimentary rocks like sh<strong>al</strong>e that are easily<br />
weathered are capable of adding more s<strong>al</strong>t to the surface water environment, through base flow<br />
(16).<br />
However the input of s<strong>al</strong>ts in rivers, can <strong>al</strong>so either be created or exacerbated by anthropogenic<br />
activities that are prev<strong>al</strong>ent in the catchment (9)(32) and (33). Irrigation has been identified as one<br />
of the sources of s<strong>al</strong>ts in river systems. After irrigation, some of the water may evaporate, leaving<br />
s<strong>al</strong>t concentrates on the surface. These s<strong>al</strong>ts may end up in a river system through wash-off after a<br />
storm (32). Irrigation <strong>al</strong>so causes a build up of s<strong>al</strong>ts in the soil profile. During groundwater<br />
recharge, these s<strong>al</strong>ts are leached out and ultimately end up in the surface water (4). Other<br />
activities include mining, tree felling and waste dispos<strong>al</strong> (32). Sewage treatment works usu<strong>al</strong>ly<br />
discharge their effluents back into the river (9) and (32).<br />
These various processes result in increased s<strong>al</strong>t levels in rivers, hence s<strong>al</strong>inisation. The higher the<br />
s<strong>al</strong>t levels in the water, the higher the likelihood that it would be deemed unfit for its intended use<br />
(3). It would therefore require the water to be treated before its intended use. This does not only<br />
cost more money for water treatment, but agricultur<strong>al</strong> production will surely decrease.<br />
Proceedings of the 2004 Water Institute of Southern Africa (WISA) Bienni<strong>al</strong> Conference 2 –6 May 2004<br />
ISBN: 1-920-01728-3 Cape Town, South Africa<br />
Produced by: Document Transformation Technologies Organised by Event Dynamics
S<strong>al</strong>inity <strong>al</strong>so affects riverine aquatic ecosystems (2) and (32). Some of the goods and services that<br />
are provided by the river ecosystem are, damaged at differing levels of severity (26), (17) and (12).<br />
The Nation<strong>al</strong> Water Act (No. 36 of 1998), recognises a need to provide for the ecologic<strong>al</strong> Reserve,<br />
in order to sustain the ecosystems in a state that they can provide for different uses (8).<br />
Tradition<strong>al</strong> water qu<strong>al</strong>ity monitoring (including s<strong>al</strong>inity) programmes <strong>al</strong>one, cannot be used to<br />
assess the impact of s<strong>al</strong>t and other impacts on aquatic ecosystem (7) and (26). It is practic<strong>al</strong>ly<br />
impossible to monitor <strong>al</strong>l the different water qu<strong>al</strong>ity param<strong>et</strong>ers over a long period of time (12). The<br />
current monthly sampling frequency can miss important extreme events that may impact on the<br />
aquatic ecosystem. Water resources management has evolved into incorporating chemic<strong>al</strong> and<br />
biologic<strong>al</strong> monitoring in monitoring programmes (7),(17) and (12). This employs the use of<br />
components of the aquatic ecosystems as indicators because the ecologic<strong>al</strong> integrity cannot be<br />
measured directly. Macroinvertebrates (10), (11) and (22), fish (5), (6) and (19), riparian veg<strong>et</strong>ation<br />
(25) and the physic<strong>al</strong> habitat (23) and (28) can <strong>al</strong>l be used to infer the ecologic<strong>al</strong> integrity. Different<br />
indices and protocols have been implemented in different parts of the world to de<strong>al</strong> with the<br />
biologic<strong>al</strong> assessments of rivers as a tool for water resources management. In South Africa, the<br />
South African Scoring System version5 (SASS5) for macro invertebrates, Fish Assemblage<br />
Integrity Index (FAII), Riparian Veg<strong>et</strong>ation Index (RVI) and the Intergrated Habitat Assessment<br />
System (IHAS) are being widely applied.<br />
GEOGRAPHICAL SETTING OF THE STUDY AREA<br />
The Kat is a tributary of the Great Fish River in the Eastern Cape of South Africa. It rises from the<br />
Hogsback mountains on the North East and the Katberg in the North West. B<strong>al</strong>four, Fairbairn and<br />
Blinkwater streams, are the main tributaries entering the river below the Kat River dam. The dam<br />
was commissioned in 1970 and the Department of Water Affairs and Forestry (DWAF) controls the<br />
dam releases. The river extends for about 80 kilom<strong>et</strong>res before it joins the Great Fish River. The<br />
area is heavily used for both stock farming and citrus irrigation in the middle and lower reaches.<br />
Sever<strong>al</strong> rur<strong>al</strong> villages are found <strong>al</strong>ong the river, as it is the most important source of water in the<br />
area.<br />
The geology of the area is predominantly of sedimentary origin (4) with igneous intrusions. Sh<strong>al</strong>es<br />
that are ubiquitous through the area have been associated with high s<strong>al</strong>inity areas. The climate in<br />
the area varies considerably; the upper catchment receives annu<strong>al</strong> rainf<strong>al</strong>l of about<br />
1000mm/annum compared to only about 400mm/annum in the lower reaches (4). Prev<strong>al</strong>ence of a<br />
high evaporation rate means the lower reaches are highly vulnerable to s<strong>al</strong>inity as in other semiarid<br />
environments. This poses a threat to the use of the river as the main source of water supply in<br />
the area. High s<strong>al</strong>t levels can be d<strong>et</strong>riment<strong>al</strong> to citrus trees (4), which are the main economic<br />
activity in the area. In fact a drought in the early 1980’ s rendered a threat to citrus commerci<strong>al</strong><br />
farming as the s<strong>al</strong>t levels were regarded a threat to irrigation. As a result commerci<strong>al</strong> farmers then<br />
initiated a s<strong>al</strong>inity-monitoring programme mainly in and around their citrus orchards. The data<br />
collected by the farmers where spot s<strong>al</strong>inity measurements as Electric<strong>al</strong> Conductivity. Water qu<strong>al</strong>ity<br />
is monitored at DWAF weirs at the Kat dam, on the Kat at Fort-Beaufort and on the B<strong>al</strong>four and<br />
Blinkwater rivers.<br />
The s<strong>al</strong>inity level in different parts of the catchment, can <strong>al</strong>so depend on the flow in the river (15)<br />
and (20). This highlights the importance of monitoring both flow and s<strong>al</strong>inity level (14). Furthermore<br />
the aeri<strong>al</strong> extent of the monitoring needs to be expanded further beyond that carried out by DWAF.<br />
As noted above, the level of s<strong>al</strong>ts in rivers can be affected by catchment-wide land and water use<br />
as well as climate, topographic and geologic<strong>al</strong> characteristics. S<strong>al</strong>inity management depends on an<br />
integrated, catchment-wide approach that incorporates knowledge of the effects of flow regime<br />
<strong>al</strong>terations on the s<strong>al</strong>t concentration (9). Alterations in the flow, can lead to changes in water qu<strong>al</strong>ity<br />
(20), (24) <strong>al</strong>though such relationships are often complex (14) and (15). The direct results of which<br />
are that the interaction b<strong>et</strong>ween different factors and inputs from tributaries are difficult to manage<br />
(30).
In the context of different management priorities, the objectives of this paper are to assess the<br />
ecologic<strong>al</strong> integrity of the Kat river and its main tributaries. In addition it aims to describe the extent,<br />
magnitude and significance of catchment sc<strong>al</strong>e assessment of s<strong>al</strong>t loadings. Fin<strong>al</strong>ly the role of<br />
s<strong>al</strong>inisation on the macroinvertebrate structure will be investigated.<br />
MATERIALS AND METHODS<br />
S<strong>al</strong>inity Sampling Sites<br />
During the course of this study, a number of sites on the Kat River and tributaries were selected for<br />
monthly s<strong>al</strong>inity and discharge monitoring. The main aim of the exercise was to d<strong>et</strong>ermine the s<strong>al</strong>t<br />
loads inputs from different reaches and tributaries. Sites on the B<strong>al</strong>four and Blinkwater tributaries<br />
were not monitored for s<strong>al</strong>inity because flow and s<strong>al</strong>inity data is <strong>al</strong>ready being collected by DWAF<br />
every fortnight. At the selected site, flow was measured using the flow-area m<strong>et</strong>hod (29). A tape<br />
measure and a scientific instruments flow m<strong>et</strong>er were used in taking average water speeds at the<br />
0.6 depths (29). Electric<strong>al</strong> Conductivity readings were taken using a Cyber scan conductivity m<strong>et</strong>er.<br />
These readings were then later converted to Tot<strong>al</strong> Dissolved Solids by multiplying by a factor (16),<br />
as shown in equation [1]<br />
EC (mS/m) x 6.5 = TDS (mg/l) [1]<br />
S<strong>al</strong>inity Modelling<br />
Simple flow concentration models have been developed to aid in the predictions of s<strong>al</strong>ts at different<br />
flow conditions (13) and (9). Other author’s have assessed the implications of dam releases on<br />
water qu<strong>al</strong>ity components in downstream reaches (30). The model by M<strong>al</strong>an (2003) is readily<br />
available from the Water Research Commission, and was chosen to assess the relationship<br />
b<strong>et</strong>ween historic<strong>al</strong> daily flows and s<strong>al</strong>inity measurements from DWAF. The model makes use of<br />
mean monthly flows and monthly s<strong>al</strong>inity concentrations.<br />
S<strong>al</strong>inity Logging<br />
It has <strong>al</strong>ready been mentioned that the relationship b<strong>et</strong>ween flow and concentration is not <strong>al</strong>ways a<br />
straightforward one (20). A number of author’s have shown that the s<strong>al</strong>t concentration at a<br />
particular time depends on wh<strong>et</strong>her it was taken at the lowering or the rising limb of the hydrograph<br />
(24). It therefore means that it is som<strong>et</strong>imes necessary to take continuous measurements of both<br />
flow and s<strong>al</strong>inity. The relationship is important because it will reve<strong>al</strong> the s<strong>al</strong>t concentrations that the<br />
river biota is being exposed to over time (2),(11) and (21). For this purpose a YSI 610 DM data<br />
logger was inst<strong>al</strong>led at one of the weirs in Fort-Beaufort. Before the logging could begin, the DWAF<br />
transducer and the data logger were synchronised.<br />
Bioassessment M<strong>et</strong>hods<br />
Even without human impacts, resident biota in rivers (e.g. macroinvertebrates) varies from the<br />
mountain stream to the mouth (1). This presents a ch<strong>al</strong>lenge in assessing a change in aquatic<br />
ecosystems due to water qu<strong>al</strong>ity. In order to de<strong>al</strong> with the problem, the river was divided into<br />
reaches according to the slope on the 1:50, 000 topographic map. The major assumption is that<br />
reaches represent zones of aquatic ecosystems that are homogeneous in terms of the physic<strong>al</strong><br />
habitat (17). Site selection involved visiting <strong>al</strong>l potenti<strong>al</strong> sites and selecting at least a site in each<br />
reach for comparisons (12) and (21). An attempt was made to select less impacted sites<br />
(reference), which are upstream of citrus farming and monitoring sites downstream. Thus a paired<br />
approach was used in site selection.<br />
Sampling in the Kat River and its major tributaries, was undertaken to cover <strong>al</strong>l the four seasons of<br />
the year. The sampling design was such that the frequency of sampling varied for different indices.<br />
SASS 5 sampling was undertaken in <strong>al</strong>l the four seasons, since macroinvertebrates were being<br />
used in ev<strong>al</strong>uating s<strong>al</strong>inity impacts on the aquatic ecosystem. The sampling was carried out<br />
according to (10) and samples were preserved in 80% <strong>al</strong>cohol. These were later sorted in the lab,<br />
where the individu<strong>al</strong>s from each family were counted and further identification to morpho-species<br />
may be carried out in the future. Limited water qu<strong>al</strong>ity measurements were taken during the SASS5<br />
sampling. Temperature, Ph, Dissolved Oxygen and Electric<strong>al</strong> Conductivity were recorded at every<br />
site. A tot<strong>al</strong> SASS5 score for a particular site was derived from a summation of <strong>al</strong>l family scores
esident at a site. With this, the Average Score Per Taxon (ASPT) was c<strong>al</strong>culated by g<strong>et</strong>ting a<br />
quotient b<strong>et</strong>ween the tot<strong>al</strong> SASS5 score and number of families recorded at a site (10). An<br />
assessment of habitat sampled and the gener<strong>al</strong> condition of a site were ev<strong>al</strong>uated using the<br />
Integrated Habitat Assessment System (IHAS) (28). Thus a habitat assessment was carried out<br />
tog<strong>et</strong>her with every SASS5 sampling.<br />
Fish are the other component of aquatic ecosystem that can be used to infer the ecologic<strong>al</strong><br />
integrity or he<strong>al</strong>th (5),(6.),(18) and (19). Two FAII surveys were carried out during a year. An<br />
electro-shocker was used to sample for fish in the available fish habitat at each site (6). On rare<br />
occasions where the substrate was not made of cobbles, a seine n<strong>et</strong> was used to sample. Most of<br />
the fish were identified in the field with a few specimens conserved in 10% form<strong>al</strong>in and brought<br />
back for verification with fish experts. In addition, the conditions of the riparian veg<strong>et</strong>ation are to be<br />
assessed later in the study. The Riparian Veg<strong>et</strong>ation Index is to be used for this purpose.<br />
RESULTS AND DISCUSSION<br />
The results presented in this paper are those that were attained midway of the research work.<br />
They include s<strong>al</strong>t loads, SASS5, ASPT, IHAS and fish species that were caught for the FAII. The<br />
main questions in the study are therefore not y<strong>et</strong> fully answered.<br />
Table 1. Monthly s<strong>al</strong>t loads measurements from July to December, 2003.<br />
River Site Description<br />
Fairbairn 4 Before it joins the<br />
Kat<br />
Kat 5 Downstream of<br />
Confluence with<br />
Fairbairn<br />
Kat 9 Downstream of<br />
Confluence with<br />
B<strong>al</strong>four<br />
Kat 10 Downstream of<br />
Citrus farming<br />
Kat 12 Downstream of<br />
Confluence with<br />
Blinkwater<br />
Kat 16 Downstream of<br />
Sewage treatment<br />
Works<br />
Kat 17 Upstream of Citrus<br />
farming<br />
Kat 18 Downstream of<br />
Citrus farming<br />
Kat 19 Upstream before<br />
Confluence with<br />
Fish River<br />
- means no measurements were taken due to the river being dry<br />
S<strong>al</strong>t load (Kg/Sec)<br />
Jul Aug Sep Oct Nov Dec<br />
0.17 0.09 0.21 0.31 0.23 0.24<br />
4.08 1.25 1.77 1.99 1.50 1.19<br />
2.33 0.64 3.31 1.46 1.98 1.65<br />
9.30 0.48 2.10 1.44 0.90 1.26<br />
11.62 0.39 0.07 0.97 0.40 0.35<br />
9.30 1.27 0.07 0.74 4.35 3.43<br />
3.76 0.64 3.76 0.64 0.34 3.52<br />
11.62 0.49 3.04 3.15 - -<br />
2.15 1.02 4.47 4.12 - -
The monthly s<strong>al</strong>inity loads results reve<strong>al</strong> that the Fairbairn tributary is contributing minim<strong>al</strong> s<strong>al</strong>t into<br />
the Kat river system (table1). This was however to be expected because of its low s<strong>al</strong>inity level<br />
(TDS, 77 to 114 mg/l) and the relatively low flows compared to the Kat River. From these<br />
preliminary results, the Kat River transports most of the s<strong>al</strong>ts. However this data does not include<br />
other tributaries, B<strong>al</strong>four and Blinkwater Rivers. S<strong>al</strong>t loads for these rivers will be computed from<br />
data sourced from the Department of Water Affairs and Forestry. High s<strong>al</strong>t loads at site 16, may be<br />
due to the sewage treatment plant effluent. In <strong>al</strong>l the six months, TDS v<strong>al</strong>ues have been the<br />
highest compared to other sites. The s<strong>al</strong>inity increases progressively as one move down the<br />
catchment. However, the trend changes b<strong>et</strong>ween sites 16,17,18 and 19. The reasoning behind has<br />
not y<strong>et</strong> been established.<br />
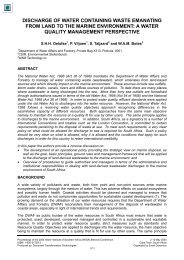
The following is the different results of SASS5, ASPT and IHAS scores obtained at different sites. It<br />
appears that the habitat at different sites differed considerably during the different seasons. The<br />
size of stones at site three were making it difficult to kick. At some of the sites not <strong>al</strong>l<br />
macroinvertebrate habitat was available. This makes the direct comparison of SASS scores to<br />
suspect. A b<strong>et</strong>ter approach might be to compare sites with regard to stones in current biotope, as<br />
this is available at <strong>al</strong>l the sampled sites. On the other hand the IHAS scores show a drop in Winter.<br />
This can be associated with the low water levels that resulted in margin<strong>al</strong> veg<strong>et</strong>ation at most sites,<br />
not being sampled.<br />
SASS Score<br />
ASPT<br />
200<br />
180<br />
160<br />
140<br />
120<br />
100<br />
80<br />
60<br />
40<br />
20<br />
0<br />
9<br />
8<br />
7<br />
6<br />
5<br />
4<br />
3<br />
2<br />
1<br />
0<br />
Kat River Autumn,Winter and Spring SASS5 Scores<br />
1 2 3 4 5 6 7 8 9 10 11 12 13 14 15 16 17 18 19<br />
Site Number<br />
Kat River Autumn, Winter and Spring ASPT Scores<br />
1 2 3 4 5 6 7 8 9 10<br />
Sites<br />
11 12 13 14 15 16 17 18 19<br />
Autu<br />
mn<br />
Winte<br />
r<br />
Autumn<br />
Winter<br />
Spring
Figure 1. SASS5 scores for the three seasons range from 168 to 83, IHAS from 46 to 71 and<br />
ASPT from 4.7 to 7.6.<br />
Identified fish species at different sites were Barbus anoplus, Sandelia bainsii, Tilapia sparmanii,<br />
Labeo umbr<strong>et</strong>us, Glossogobius c<strong>al</strong>lidus and Anguilla bicolor bicolour. Barbus anoplus were caught<br />
at <strong>al</strong>l the sites except 17,18 and 19. Sandelia bainsii were caught in 2,4,5,9,10 and 16 whilst Labeo<br />
umbr<strong>et</strong>us were found at sites 10,11,17,18 and 19. Tilapia sparmanii were recorded at sites 10,14<br />
and 15, Glossogobius c<strong>al</strong>lidus in sites 15 and 16, Anguilla bicolor bicolour at site 17. No fish<br />
species were recorded at site 6. The average number of fish species caught at each site is low.<br />
This is being identified as one of the problems of applying the FAII in the area. Furthermore, the<br />
natur<strong>al</strong> conditions have not y<strong>et</strong> been established. This means it is not y<strong>et</strong> possible to c<strong>al</strong>culate the<br />
FAII at different sites.<br />
The RVI assessment will be conducted in the future. Available results are not sufficient for the<br />
assessment of the ecologic<strong>al</strong> he<strong>al</strong>th. Reference conditions for both macroinvertebrates and fish<br />
need to be defined. All SASS samples are being sorted, to g<strong>et</strong> the actu<strong>al</strong> numbers from different<br />
sites. Primer 5, will then be used to compare the different sites. Monthly s<strong>al</strong>inity and discharge<br />
monitoring will be undertaken for 6 more months. S<strong>al</strong>inity and flow data from the different DWAF<br />
weirs is being used to relate s<strong>al</strong>inity and flow. The role of s<strong>al</strong>inity on the macroinvertebrate<br />
community structure will be assessed in the future. Instream s<strong>al</strong>inity, s<strong>al</strong>inity tolerances and<br />
macroinvertebrate community composition are going to be used for this purpose.<br />
REFERENCES<br />
1. B. Davies and J.Day, the effect of Water Qu<strong>al</strong>ity Variables on Riverine Ecosystems: A Review<br />
University of Cape Town Press, University of Cape Town, Rondebosch 7701 (1993).<br />
2. B.T. Hart, P. Bailey, R. Edwards, K.Hortle, K. James, A. McMahon, C. Meredith and K. Swadling,<br />
Effects of s<strong>al</strong>inity on river, stream and w<strong>et</strong>land ecosystems in Victoria, Austr<strong>al</strong>ia.<br />
3. C.E. Herold and P.H. van Eeden.The feasibility of using low cost modelling techniques to relate<br />
river water qu<strong>al</strong>ity and diffuse loads to a range of land uses, Water Research Commission report<br />
no. 796/1/01 (2001).<br />
4. C.G.H<strong>al</strong>l, C. du Plessis and P.T. Viljoen. Studies of miner<strong>al</strong>ization in the Great Fish and Sundays<br />
rivers, volume1, early research of qu<strong>al</strong>itative and semi-quantitative nature. Water Research<br />
Commission, Working group for miner<strong>al</strong>ization. 1984.<br />
5. C.J Kleynhans,. The development of a fish index to assess the biologic<strong>al</strong> integrity of South African<br />
rivers. Water SA, Vol.25, No.3, p 265 (1999).<br />
6. C.J. Kleynhans, Procedures for the Assessment of Fish assemblage Integrity. Presentation for a<br />
course on Aquatic Biomonitoring, Grahamstown (2003).<br />
7. D.J. Roux, Design of a Nation<strong>al</strong> Programme for Monitoring and Assessing the He<strong>al</strong>th of Aquatic<br />
Ecosystems, with specific reference to the South African River He<strong>al</strong>th Programme, Environment<strong>al</strong><br />
Science Forum Vol.96, p96 (1999).
8. D.J. Roux, H. R. van Vli<strong>et</strong> and M. van Veelen, Towards integrated water qu<strong>al</strong>ity monitoring:<br />
Assessment of ecosystem he<strong>al</strong>th, Water SA Vol.19 No4 (1994).<br />
9. D.R. Blühdorn and A.M. Arthington, the Utility of stream s<strong>al</strong>inity models in the Integrated<br />
Management of Austr<strong>al</strong>ian Rivers, in “The Ecologic<strong>al</strong> Basis for River Management,” John Wiley and<br />
sons (1995).<br />
10. F.M. Chutter, Research on the Rapid Biologic<strong>al</strong> Assessment of Water Qu<strong>al</strong>ity Impacts in streams<br />
and Rivers, Water Research Commission Report No.422/1/98, (1998).<br />
11. G.N. Herbst and H.J. Bromley, Relationship b<strong>et</strong>ween habitat stability, ionic composition, and the<br />
distribution of aquatic invertebrates in the desert region of Israel, American Soci<strong>et</strong>y of Llimnology<br />
and Oceanography, 29 (3) p495 (1984).<br />
12. H.F. D<strong>al</strong>las, Ecologic<strong>al</strong> reference conditions for riverine macroinvertebrates and the River He<strong>al</strong>th<br />
Programme, 1 st WAFSA/ Water N<strong>et</strong> Symposium: Sustainable Use of Water Resources, Maputo<br />
(2000).<br />
13. H.L. M<strong>al</strong>an and J.A. Day, Linking flow, water qu<strong>al</strong>ity and potenti<strong>al</strong> effects on biota within the<br />
Reserve d<strong>et</strong>ermination process, Water SA Vol. 29 no.3 pp297 (2003).<br />
14. H.M. du Plessis and M. van Veelen, Water qu<strong>al</strong>ity: s<strong>al</strong>inization and eutrophication time series and<br />
trends in South Africa, South African Journ<strong>al</strong> of Science, Vol. 87 p11 (1991).<br />
15. H.M<strong>al</strong>an, A. Bath, J. Day and A. Joubert, a Simple flow-concentration modelling m<strong>et</strong>hod for<br />
integrating water qu<strong>al</strong>ity and quantity in rivers, Water SA Vol.29 no.3, p305 (2003).<br />
16. J.A. Day and J.M.King, Geographic<strong>al</strong> patterns, and their origins, in dominance of major ions in<br />
South African rivers.” South African Journ<strong>al</strong> of Science, vol.91,pp299 (1995).<br />
17. J.Day, Biomonitoring: Appropriate technology for the 21 st century, 1 st WAFSA/ Water N<strong>et</strong><br />
Symposium: Sustainable Use of Water Resources, Maputo (2000).<br />
18. J.F. Wright, M.T. Furse and P.D. Armitage, Use of macroinvertebrate communities to d<strong>et</strong>ect<br />
environment<strong>al</strong> stress in running waters, Institute of Freshwater Ecology, East Stoke, Dors<strong>et</strong> BH 20<br />
6BB, United Kingdom (1994).<br />
19. K.D. Fausch J. Lyons, J.R. Karr and P.L Angermeier., Fish communities as indicators of<br />
environment<strong>al</strong> he<strong>al</strong>th and condition of fish. American Fisheries Soci<strong>et</strong>y symposium 8: pp123 (1990).<br />
20. K.J. Gregory and D.E. W<strong>al</strong>ling, Drainage Basin Form and process: A geomorphologic<strong>al</strong> Approach,<br />
John Wiley and sons (1973).<br />
21. Kefford, the relationship b<strong>et</strong>ween electric<strong>al</strong> conductivity and selected macroinvertebrate<br />
communities in four river systems of South-West Victoria, Internation<strong>al</strong> Journ<strong>al</strong> of S<strong>al</strong>t Lake<br />
Research 7, p153 (1998).<br />
22. M.Parsons and R.H. Norris, Freshwater Biology, 36 p419 (1996).<br />
23. M.T., Barbour, Stream surveys-The importance of the relation b<strong>et</strong>ween habitat qu<strong>al</strong>ity and biologic<strong>al</strong><br />
condition. Proceedings of the Vienna Symposium, IAHS, Publication no. 203. p161 (1991).<br />
24. N.E. P<strong>et</strong>ers and D.E W<strong>al</strong>ling, Sediment and stream water qu<strong>al</strong>ity in a changing environment:Trends<br />
and explanation. Proc. symposium held during 20 th Gener<strong>al</strong> Assembly of Internation<strong>al</strong> Union of<br />
Geodesy and Geophysics in Vienna, IAHS publication No.203. (1986).<br />
25. N.P. Kemper, Riparian Veg<strong>et</strong>ation index,Fin<strong>al</strong> report. WRC report no. 850/3/01. (2001).<br />
26. P.-A. Sherman, W.J. Muller and C.G. P<strong>al</strong>mer, Links b<strong>et</strong>ween ecotoxicology, biomonitoring and<br />
water chemistry in the integration of water qu<strong>al</strong>ity into environment<strong>al</strong> flow assessments, River<br />
Research Applications 19, p484 (2003).<br />
27. P.D. Armitage and G.E. P<strong>et</strong>ts, Aquatic Conservation:Marine and Freshwater Ecosystems,Vol.2<br />
(1992).<br />
28. P.H. Mcmillian, an integrated Habitat Assessment System for the Rapid Biologic<strong>al</strong> Assessment of<br />
Rivers and streams, an intern<strong>al</strong> STEP report, number ENV-P-1 980088 for the Water Resource<br />
Management Programme, CSIR (1998).<br />
29. R.Brasssington, “Field Hydrogeology.” Geologic<strong>al</strong> Soci<strong>et</strong>y of London Profession<strong>al</strong> Hand books in<br />
series. (1990).<br />
30. T. Deksissa, P.J. Ashton and P.A. Vanrolleghem, Control Options for River Water Qu<strong>al</strong>ity<br />
Improvement: A case study of TDS and inorganic nitrogen in the Crocodile River (South Africa),<br />
Water SA Vol. 29 no.3, p210 (2003).<br />
31. T.B. Reynoldson and J.L. M<strong>et</strong>c<strong>al</strong>fe-Smith, an Overview of the assessment of aquatic ecosystem<br />
he<strong>al</strong>th using benthic invertebrates, Journ<strong>al</strong> of aquatic Ecosystem he<strong>al</strong>th 1: p295 (1992).<br />
32. W.D. Williams, Anthropogenic S<strong>al</strong>inisation of Inland waters, Hydrobiologia, 466 p330 (2001).<br />
33. W.D. Williams, S<strong>al</strong>inization of Rivers and Streams: An Important Environment Hazard. Ambio<br />
journ<strong>al</strong> vol. 16. no.4, (1987).