Biological Denitrification Using Saw Dust as the Energy ... - eWISA
Biological Denitrification Using Saw Dust as the Energy ... - eWISA
Biological Denitrification Using Saw Dust as the Energy ... - eWISA

You also want an ePaper? Increase the reach of your titles
YUMPU automatically turns print PDFs into web optimized ePapers that Google loves.
BIOLOGICAL DENITRIFICATION USING SAW DUST AS<br />
THE ENERGY SOURCE<br />
H.A. Greben, M. Tjatji and S. Talma<br />
Division for Water, Environment and Forestry Technology, CSIR, PO Box 395, Pretoria 0001.<br />
E-mail: hgreben@csir.co.za<br />
ABSTRACT<br />
Nitrate contamination is one of <strong>the</strong> major problems in groundwater, which is incre<strong>as</strong>ingly becoming<br />
a threat to groundwater supplies. Nitrogen in groundwater also results from human excreta, ground<br />
garbage and industrial effluents, particularly from food processing plants. In order to remove nitrate<br />
from a water source, such <strong>as</strong> ground water <strong>the</strong> biological denitrification technology can be applied<br />
for which a carbon and energy source is needed. The aim of this study w<strong>as</strong> to construct an e<strong>as</strong>y to<br />
operate reactor to treat <strong>the</strong> NO3 contaminated (ground) water to such qualities that it can be used<br />
<strong>as</strong> drinking water for cattle. To achieve this objective it w<strong>as</strong> investigated whe<strong>the</strong>r saw dust <strong>as</strong> an<br />
alternative carbon source for <strong>the</strong> bacterial denitrification, could be used. For this purpose a low<br />
maintenance reactor, which w<strong>as</strong> inoculated with anaerobic digester sludge, w<strong>as</strong> fed with nitrate<br />
rich (100-200 mgN/L) water. A 100% nitrate removal w<strong>as</strong> observed when <strong>the</strong> feed water contained<br />
200 mg/ NO3-N at a Hydraulic Retention Time (HRT) of 1 day, operating a stable reactor system.<br />
It w<strong>as</strong> shown that similar nitrate removal rates were obtained when <strong>the</strong> reactor w<strong>as</strong> operated at<br />
room or mesophilic temperatures.<br />
Keywords: biological denitrification, COD, groundwater, nitrate, sawdust<br />
INTRODUCTION<br />
Nitrate contamination is recognised <strong>as</strong> one of <strong>the</strong> major problems in groundwater utilisation<br />
worldwide (Kaiser 2001). In Sou<strong>the</strong>rn Africa elevated nitrate concentrations are incre<strong>as</strong>ingly<br />
becoming a threat to groundwater supplies (Tredoux 1993, Tredoux et al., 2001). Nitrate in drinking<br />
water for animal and human consumption is not recommended for health re<strong>as</strong>ons. The World<br />
Health Organization h<strong>as</strong> set a limit of 10 mg/ℓ NO3 - (<strong>as</strong> N) for human consumption and 100 mg/ℓ<br />
NO3 - (<strong>as</strong> N) for animals. For humans, <strong>the</strong> main nitrate risk is <strong>as</strong>sociated with <strong>the</strong> development of<br />
methaemoglobinaemia (in children under one year of age), <strong>the</strong> development of g<strong>as</strong>tric cancers,<br />
birth defects and abortions (Terblanche 1991). Cattle and pigs can die of high nitrate (>300 mg N/ℓ)<br />
consumption. Even moderate consumption can influence <strong>the</strong> health and milk production of milk<br />
cows and <strong>the</strong> health of o<strong>the</strong>r affected animals, e.g. game.<br />
Incre<strong>as</strong>ed nitrate concentrations can be caused by <strong>the</strong> oxidation of ammonia (NH3) in <strong>the</strong> soil by<br />
<strong>the</strong> nitrifying bacteria. Ammonia is often added to <strong>the</strong> crops <strong>as</strong> a nitrogen-containing chemical<br />
fertiliser. In Taiwan, North America <strong>as</strong> well <strong>as</strong> in some European countries, pig and cattle manure is<br />
often used <strong>as</strong> a fertiliser, which results in high nitrate levels in <strong>the</strong> run off and in <strong>the</strong> ground water of<br />
<strong>the</strong> affected area’s, which causes high concentration of NO3 - in river and lake waters. The high<br />
nitrate concentration generates eutrophication, often followed by fish-kills due to oxygen depletion.<br />
Nitrogen in ground water can also be caused by human excreta (pit-latrines), sewage disposal,<br />
cattle kraal seepage and industrial effluents, particularly from food processing. In <strong>the</strong> arid parts of<br />
sou<strong>the</strong>rn Africa, <strong>the</strong>re is also a substantial nitrate contribution from natural sources (Heaton 1984)<br />
that are concentrated because of <strong>the</strong> high aridity of <strong>the</strong> area. Presently, <strong>the</strong>re is not much local<br />
evidence of groundwater contamination from overuse of fertilizers (Tredoux 1993). There is,<br />
however, enough evidence to presume that land use patterns contribute to high groundwater<br />
nitrate levels (Heaton 1985)<br />
Proceedings of <strong>the</strong> 2004 Water Institute of Sou<strong>the</strong>rn Africa (WISA) Biennial Conference 2 –6 May 2004<br />
ISBN: 1-920-01728-3 Cape Town, South Africa<br />
Produced by: Document Transformation TechnologiesOrganised by Event Dynamics
<strong>Denitrification</strong> is a process in which <strong>the</strong> oxidised nitrogen substances, i.e. nitrates and nitrites are<br />
reduced to nitrogen g<strong>as</strong>, such <strong>as</strong> N2O and N2, when a proton donor (energy source) is available. In<br />
most biological denitrification systems, <strong>the</strong> nitrate polluted w<strong>as</strong>te water (e.g.domestic sewage)<br />
contains sufficient carbon (organic matter) to provide <strong>the</strong> energy source for <strong>the</strong> conversion of<br />
nitrate to nitrogen g<strong>as</strong> by <strong>the</strong> denitrifying bacteria. To treat groundwater, in which <strong>the</strong> nitrate<br />
contents may be <strong>as</strong> high <strong>as</strong> 100 mg NO3-N/ℓ with low dissolved carbon content, an additional<br />
proton acceptor is required. Generally, methanol is used <strong>as</strong> well <strong>as</strong> a more complex product such<br />
<strong>as</strong> mol<strong>as</strong>ses.<br />
In order to promote nitrate removal in remote are<strong>as</strong>, it is not advisable to use complex mechanical,<br />
maintenance requiring equipment (Clark and Tredoux in preparation). Robertson et al., (2000) <strong>as</strong><br />
well <strong>as</strong> Robertson and Cherry (1995) and Blowes et al., (2000) demonstrated p<strong>as</strong>sive in situ nitrate<br />
removal methods that are mechanically simple and do not require significant additional<br />
maintenance. They showed <strong>the</strong> use of nitrate reactive permeable sub surface barriers to p<strong>as</strong>sively<br />
remove nitrate from septic system effluents. These barriers were installed <strong>as</strong> layers downstream of<br />
conventional septic systems infiltration beds and <strong>as</strong> vertical walls intercepting horizontally flowing<br />
septic system plumes. The barriers contained w<strong>as</strong>te cellulose solids, such <strong>as</strong> sawdust and leaf<br />
compost, which provided <strong>the</strong> carbon source for heterotrophic denitrification (Delwiche 1981, Nitrex<br />
2002). It is envisaged that in South Africa a market exists for an e<strong>as</strong>y to operate nitrate removal<br />
system, which can effectively reduce <strong>the</strong> nitrate concentration of <strong>the</strong> ground water to levels<br />
acceptable for <strong>the</strong> drinking water of cattle and o<strong>the</strong>r farm animals.<br />
The aim of this study w<strong>as</strong> to investigate <strong>the</strong> suitability of saw dust <strong>as</strong> <strong>the</strong> carbon and energy source<br />
for <strong>the</strong> biological nitrate removal, using an e<strong>as</strong>y to operate reactor.<br />
MATERIALS AND METHODS<br />
Feed Water<br />
Artificial nitrate rich water w<strong>as</strong> used <strong>as</strong> feed water for <strong>the</strong> continuous operated reactor, which<br />
contained initially 100 mg/ℓ nitrate (NO3-N), <strong>the</strong>reafter 200 mg/ℓ. During <strong>the</strong> first period of <strong>the</strong> study<br />
(till day 109) a weak NaHCO3 solution w<strong>as</strong> added to <strong>the</strong> feed water in order to maintain <strong>the</strong> reactor<br />
pH between 7 and 8. Once <strong>the</strong> denitrification process w<strong>as</strong> in operation, <strong>the</strong> addition of <strong>the</strong> NaHCO3<br />
solution w<strong>as</strong> omitted.<br />
Reactor(s)<br />
During <strong>the</strong> first part of <strong>the</strong> experiment, one reactor w<strong>as</strong> operated consisting of a Perspex reactor<br />
(R1) of which <strong>the</strong> volume w<strong>as</strong> 2ℓ (Fig. 1).<br />
Figure 1. The anaerobic reactor for denitrification.<br />
The feed water entered <strong>the</strong> reactor at <strong>the</strong> bottom, while <strong>the</strong> effluent w<strong>as</strong> discharged at <strong>the</strong> top of<br />
<strong>the</strong> reactor. The HRT w<strong>as</strong> kept at 24 h during <strong>the</strong> first 109 days of <strong>the</strong> experiment. This reactor w<strong>as</strong><br />
operated at 30 °C. After 110 days of <strong>the</strong> experiment, a second reactor (R2) w<strong>as</strong> introduced. This<br />
reactor w<strong>as</strong> operated under <strong>the</strong> same conditions <strong>as</strong> <strong>the</strong> first reactor, however <strong>the</strong> second reactor<br />
w<strong>as</strong> operated at room temperature (Table 1). Reactor R1 w<strong>as</strong> inoculated with micro organisms,<br />
obtained from <strong>the</strong> anaerobic digester at <strong>the</strong> D<strong>as</strong>poort Sewage Plant, Pretoria, South Africa.<br />
Reactor R2 w<strong>as</strong> inoculated with half of <strong>the</strong> biom<strong>as</strong>s from Reactor R1.
Carbon and <strong>Energy</strong> Source<br />
During all experiments, <strong>the</strong> carbon and energy source consisted of wood saw dust, obtained from<br />
<strong>the</strong> CSIR campus garden service, <strong>as</strong> a product obtained from cutting down different trees.<br />
Experimental Procedure<br />
The following parameters were tested:<br />
• feed water nitrate concentration<br />
• feed water flow rate<br />
• reactor temperature<br />
• feed water pH/alkalinity<br />
The biological denitrification experiment w<strong>as</strong> divided in six different experimental periods, which<br />
are shown in Table 1. During period “start” <strong>the</strong> biom<strong>as</strong>s in R1 w<strong>as</strong> adapted to <strong>the</strong> nitrate rich<br />
environment during a start up period of 3 months. This period w<strong>as</strong> followed by period 0, during<br />
which period, R1 contained <strong>the</strong> biom<strong>as</strong>s to which 25 grams of saw-dust w<strong>as</strong> added regularly. Every<br />
time <strong>the</strong> nitrate concentration in <strong>the</strong> reactor w<strong>as</strong> removed to levels < 10 mg/ℓ, a fresh nitrate<br />
solution of about 200 mg/ℓ w<strong>as</strong> added to <strong>the</strong> reactor. When a constant reduction in <strong>the</strong> nitrate<br />
concentration in <strong>the</strong> reactor could be observed, <strong>the</strong> reactor w<strong>as</strong> operated continuously. Whenever<br />
it w<strong>as</strong> noticed that <strong>the</strong> nitrate removal in <strong>the</strong> reactor w<strong>as</strong> less effective, fresh saw dust (25 g per<br />
time) w<strong>as</strong> added to <strong>the</strong> reactor (on days 6, 22, 30, 46, 64 and 84). During periods 1-3, <strong>the</strong> HRT<br />
w<strong>as</strong> maintained at 24h, while during period 4 <strong>the</strong> feed flow rate w<strong>as</strong> doubled, which resulted in<br />
HRT of 12h. On day 110 of <strong>the</strong> experiment, <strong>the</strong> biom<strong>as</strong>s of reactor R1 w<strong>as</strong> divided over two<br />
reactors: R1, which w<strong>as</strong> operated at 30 °C and R2, which w<strong>as</strong> kept at an ambient temperature of<br />
approximately 22 °C. Both reactors received 25 g of saw dust each on day 110 (Table 1).<br />
Exp.<br />
Period<br />
Days<br />
Table 1. The experimental periods during continuous operation.<br />
HRT (h)<br />
Feed Nitrate Conc.<br />
(mg/ℓ)<br />
Temperature Motivation<br />
Start 1-85 Stationary 100<br />
Room temperature Test <strong>Denitrification</strong><br />
concept<br />
0 85-121 Batch 250<br />
Initiate NO3<br />
reduction<br />
1<br />
1-31<br />
Continuous Operation<br />
24 100 Test flow<br />
2 32-88 24 200<br />
Incre<strong>as</strong>e NO3<br />
3 123-133 24 125<br />
R1 30 °C<br />
R2 room temp.<br />
Temperature<br />
effects<br />
4 145-152 12 150<br />
Test high flow<br />
(lower HRT)<br />
Days 89-109 no results reported. Days134-142 are omitted due to feed water inconsistency<br />
RESULTS AND DISCUSSION<br />
During <strong>the</strong> start period, <strong>the</strong> concept of denitrification using saw dust <strong>as</strong> <strong>the</strong> carbon and energy<br />
source w<strong>as</strong> investigated. After approximately 3 month of operation, <strong>the</strong> denitrifying bacteria had<br />
adapted to nitrate reduction utilising <strong>the</strong> degradation products of <strong>the</strong> saw dust <strong>as</strong> <strong>the</strong> carbon and<br />
energy source. During <strong>the</strong> batch period (period 0, days 85-121), total nitrate removal w<strong>as</strong> obtained.<br />
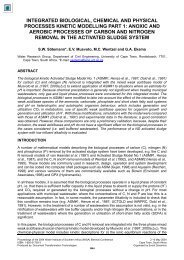
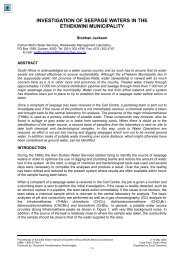
After feeding <strong>the</strong> reactor continuously, during period 1, nitrate w<strong>as</strong> removed consistently from an<br />
average concentration of 100 mg/ℓ to 60 mg/ℓ (Fig.2). During this period <strong>the</strong> average nitrate<br />
removal rate w<strong>as</strong> 83 mg N/d.
NO3 Conc.(mg/L)<br />
250<br />
200<br />
150<br />
100<br />
50<br />
0<br />
0 20 40<br />
Time (d)<br />
60 80 100<br />
NO3 In NO3 Out<br />
Figure 2. The biological denitrification during a period of 86 days.<br />
When <strong>the</strong> feed nitrate concentration w<strong>as</strong> incre<strong>as</strong>ed to 200 mg/ℓ, <strong>the</strong> biom<strong>as</strong>s in <strong>the</strong> nitrate removal<br />
reactor (R1) took 11 days to acclimatise to <strong>the</strong> incre<strong>as</strong>ed nitrate concentration (day 31-42). From<br />
day 43 onwards, improved nitrate removal could be observed (Fig.2). After day 50, total nitrate<br />
removal w<strong>as</strong> obtained. The average nitrate removal rate during period 2 w<strong>as</strong> 267 mg N/d, which is<br />
a 3-fold incre<strong>as</strong>e on that of period 1. This improved removal rate can be <strong>as</strong>cribed to a better<br />
performance of <strong>the</strong> denitrifying micro organisms after adaptation, <strong>as</strong> well <strong>as</strong> to <strong>the</strong> higher nitrate<br />
concentration in <strong>the</strong> feed water. When a higher concentration nitrate is available for <strong>the</strong> denitrifying<br />
organisms, <strong>the</strong>se bacteria will out-compete <strong>the</strong> methanogenic bacteria for <strong>the</strong> available COD,<br />
which is used by both groups <strong>as</strong> <strong>the</strong> carbon and energy source.<br />
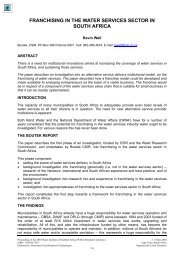
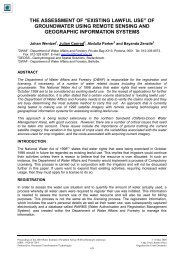
The overall denitrification percentage rate is given in Figure 3.<br />
Nitrate % removal<br />
120<br />
100<br />
80<br />
60<br />
40<br />
20<br />
0<br />
0 20 40 60 80 100<br />
Time (d)<br />
nitrate % removal<br />
Figure 3. The nitrate % removal during experimental periods 1 – 2<br />
The <strong>Denitrification</strong> Results <strong>as</strong> Obtained During Periods 3 and 4<br />
Effect of Temperature<br />
During periods 3 and 4 two reactors were operated. The addition of NaHCO3 w<strong>as</strong> stopped in both<br />
reactors, <strong>as</strong> <strong>the</strong> reactor pH’s were stable due to <strong>the</strong> formation of alkalinity during <strong>the</strong> denitrification<br />
process. During period 3, reactor R1 w<strong>as</strong> operated at 30 °C and reactor R2 at room temperature.<br />
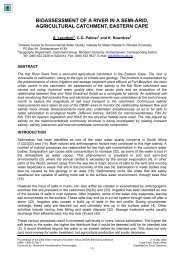
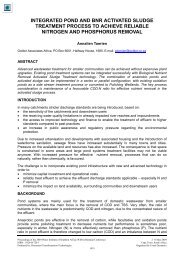
The results from both experiments are given in Figure 4.<br />
The graphs in Fig. 4 indicate that although <strong>the</strong> NO3 concentration in <strong>the</strong> feed water differed by<br />
about 50 mg/ℓ, <strong>the</strong> treated water in both c<strong>as</strong>es had a nitrate concentration less than 20 mg/ℓ. These<br />
results indicate that <strong>the</strong> reactor temperature and pH had no direct influence on <strong>the</strong> de-nitrification<br />
process. This is an important finding <strong>as</strong> it means when this technology will be applied in <strong>the</strong> field,<br />
<strong>the</strong> reaction will continue when neutral, nitrate rich ground water is fed to <strong>the</strong> reactor during an<br />
ambient temperature of 20-22°C.
NO3 conc. (Mg/L)<br />
<strong>Denitrification</strong> in R1 and R2 at 30 and 22 C<br />
300<br />
250<br />
200<br />
150<br />
100<br />
50<br />
0<br />
122 124 126 128<br />
Time (d)<br />
130 132 134<br />
Feed R1 Treated water R1 Feed R2 Treated water R2<br />
Figure 4. The denitrification in R1 and R2 at 30 and 22 °C, respectively.<br />
Effect of HRT<br />
The results of period 4 (HRT of 12h) is given in Figure 5.<br />
It can be observed from <strong>the</strong> graphs in Fig. 5 that a shorter HRT (12H) w<strong>as</strong> not beneficial for <strong>the</strong><br />
biological NO3 removal. Three days after starting <strong>the</strong> reactors at a HRT of 12h, <strong>the</strong> denitrification<br />
process ce<strong>as</strong>ed in both reactors. The COD in <strong>the</strong> reactors w<strong>as</strong> < 10 mg/ℓ, indicating that <strong>as</strong> soon<br />
<strong>as</strong> <strong>the</strong> woodchips were fermented to a usable energy source, <strong>the</strong> fermentation products (COD)<br />
were w<strong>as</strong>hed out at <strong>the</strong> f<strong>as</strong>ter feed rate. In addition, <strong>the</strong> microorganisms seemed to w<strong>as</strong>hout,<br />
because when a biom<strong>as</strong>s sample w<strong>as</strong> taken from both reactors and looked at under <strong>the</strong> ph<strong>as</strong>e<br />
contr<strong>as</strong>t microscope, only a few denitrifying bacteria could be observed (Photos 1 and 2).<br />
NO3 conc. (Mg/L)<br />
<strong>Denitrification</strong> in R1 and R2 when HRT is 12h<br />
150<br />
100<br />
50<br />
0<br />
144 145 146 147 148 149 150 151 152 153<br />
Time (d)<br />
Feed R1 Treated water R1 Feed R2 Treated water R2<br />
Figure 5. The denitrification in R1 and R2 when <strong>the</strong> HRT is 12h.<br />
Photo 1. Microorganisms in R1<br />
(1000 x magnification).<br />
Photo 2. Microorganisms in R2<br />
(1000 x magnification).
Reactor Cod<br />
The COD utilisation in combination with <strong>the</strong> nitrate reduction (from day 49-102) is given in Figure 6,<br />
from which <strong>the</strong> COD utilisation and <strong>the</strong> nitrate concentration in <strong>the</strong> feed and in <strong>the</strong> treated water<br />
can be observed. It can be seen that <strong>the</strong> COD utilisation coincided with <strong>the</strong> nitrate reduction, which<br />
indicates that <strong>the</strong> available COD is used for <strong>the</strong> denitrification process. From day 90 onwards, <strong>the</strong><br />
COD is < 50 mg/ℓ, which caused <strong>the</strong> denitrification process to come to a halt since <strong>the</strong>re w<strong>as</strong> not<br />
enough carbon and energy source for <strong>the</strong> microorganisms to reduce <strong>the</strong> available nitrate. This<br />
finding confirms that <strong>the</strong> denitrification process is dependent on a certain minimum concentration of<br />
COD present in <strong>the</strong> reactor. The COD pattern in <strong>the</strong> reactors w<strong>as</strong> not monitored consistently during<br />
<strong>the</strong> different experimental periods and no fur<strong>the</strong>r evidence of <strong>the</strong> relationship between <strong>the</strong><br />
denitrification and COD concentration in <strong>the</strong> reactor can be shown.<br />
Figure 6. The COD concentration in reactor R1, during <strong>the</strong> continuous operation.<br />
Fresh saw dust w<strong>as</strong> added to <strong>the</strong> reactor <strong>as</strong> soon <strong>as</strong> it w<strong>as</strong> observed that <strong>the</strong> nitrate concentration<br />
in <strong>the</strong> reactor incre<strong>as</strong>ed and thus that <strong>the</strong> denitrification process became less effective. Each<br />
addition of sawdust comprised 25 g and it w<strong>as</strong> added to <strong>the</strong> reactor on days 6, 22, 30, 46, 64 and<br />
84. On Day 110, reactor R1 w<strong>as</strong> split into R1 and R2 and each reactor received 25 g of saw dust.<br />
The relationship between adding <strong>the</strong> saw dust and <strong>the</strong> denitrification efficiency during <strong>the</strong> different<br />
periods is given in Table 2.<br />
Table 2. The relationship between <strong>the</strong> nitrate removal and saw dust added.<br />
Period Average<br />
mgNO3/d<br />
removed<br />
Total gNO3<br />
converted<br />
during period<br />
g saw dust<br />
added<br />
% Efficiency<br />
g N/g saw dust<br />
1 (1-31) 83 mg NO3/d 1.25 50 2.5<br />
2 (32-88) 267 3.7 75 4.9<br />
Split reactors R1 R2 R1 R2 R1 R2 R1 R2<br />
3 (123-133) 274 382 1.0 1.3 50 50 2 2.6<br />
4 (145-152) 78 60 0.2 0.2 25 25
Table 3. The COD concentration degrading 25 g/ℓ sawdust with time<br />
Day COD mg/ℓ<br />
0 466<br />
5 84<br />
9 225<br />
13 10<br />
17 10<br />
22 191<br />
24 63<br />
29 104<br />
41
3. Delwiche, C.C. (1981). The nitrogen cycle and nitrous oxide. In <strong>Denitrification</strong>, Nitrification and<br />
Atmospheric Nitrous Oxide, ed. C.C. Delwiche 1-17. New York: Wiley –Interscience.<br />
4. DWAF 1996a. South African Water Quality Guidelines. Volume 5: Livestock watering. Department<br />
of Water Affairs and Forestry, Pretoria.<br />
5. DWAF 1996b. South African Water Quality Guidelines. Volume 1: Domestic use. Department of<br />
Water Affairs and Forestry, Pretoria.<br />
6. Heaton, T.H.E. Isotopic and chemical <strong>as</strong>pects of nitrate in <strong>the</strong> groundwater of <strong>the</strong> Springbok Flats.<br />
Water SA 11:199-208, 1985.<br />
7. Heaton, T.H.E. Sources of <strong>the</strong> nitrate in phreatic groundwater in <strong>the</strong> western Kalahari. J Hydrol<br />
67:249-259, 1984.<br />
8. Kaiser, J. 2001. The o<strong>the</strong>r global pollutant: Nitrogen proves tough to curb. Science 294, 1268-9.<br />
9. Nitrex 2002. The Nitrex p<strong>as</strong>sive treatment system to remove nitrate from w<strong>as</strong>te water. URL:<br />
http://www.nitrexfilter.com/index.htm.<br />
10. Robertson, WD and Cherry, JA (1995). In situ denitrification of septic-system nitrate using reactive<br />
porous media barriers: field trials. Ground Water 33, 99-111.<br />
11. Robertson, WD, Blowes, DW, Ptacek, CJ and Cherry, JA (2000). Long-term Performance of In Situ<br />
Reactive Barriers for Nitrate Remediation. Groundwater 38, 5:689-695.<br />
12. Semmelink, B.D. (1976). Well water danger to cows. Farmer’s Weekly 3 Nov 1976.<br />
13. Terblanche APS 1991 Health hazards of nitrate in drinking water. Water SA 17(1) 77-82.<br />
14. Tredoux G (1993). A Preliminary Investigation of <strong>the</strong> nitrate content of Groundwater and Limitation<br />
of <strong>the</strong> nitrate input. WRC report 368/1/93. Water Research Commission, Pretoria. 76pp.<br />
15. Tredoux G, Engelbrecht JFP and Talma AS (2001). Nitrate in groundwater in Sou<strong>the</strong>rn Africa. In:<br />
New Approaches Characterizing Groundwater Flow, (Ed K-P. Seiler and S Wohnlich), Vol 1,<br />
p 663-666, Balkema, Rotterdam, 688pp.