Snyman, Heidi G. et al - eWISA
Snyman, Heidi G. et al - eWISA
Snyman, Heidi G. et al - eWISA

You also want an ePaper? Increase the reach of your titles
YUMPU automatically turns print PDFs into web optimized ePapers that Google loves.
METAL CONTENT OF SOUTH AFRICAN SEWAGE SLUDGE<br />
<strong>Heidi</strong> G. <strong>Snyman</strong> 1 , J.E. Herselman 2 and G Kasselman 3<br />
1 Corresponding Author: Golder Associates Africa, PO Box 6001, H<strong>al</strong>fway House, 1685, South Africa.<br />
Tel: (011) 254 4915. Fax: (011) 315 0317. E-mail: hsnyman@golder.co.za.<br />
2 Institute of Soil, Climate and Water, ARC, Private Bag X79, Pr<strong>et</strong>oria 0002, South Africa.<br />
3 ERWAT Chair in Wastewater Management, Water Utilisation Division, Department of Chemic<strong>al</strong> Engineering,<br />
University of Pr<strong>et</strong>oria, Pr<strong>et</strong>oria 0002, South Africa.<br />
ABSTRACT<br />
A survey was done to d<strong>et</strong>ermine the potenti<strong>al</strong>ly toxic m<strong>et</strong><strong>al</strong>s and element (m<strong>et</strong><strong>al</strong>) qu<strong>al</strong>ity of sewage<br />
sludge in South Africa. Sludge samples (78) were collected and an<strong>al</strong>ysed for Cd, Co, Cr, Cu, Hg,<br />
Mo, Ni, Pb, Zn, Se, B and F, using three extraction m<strong>et</strong>hods. The efficiency of the extraction<br />
m<strong>et</strong>hods, aqua regia (tot<strong>al</strong> extraction), EPA 3050 (tot<strong>al</strong> extraction), and TCLP (leachable) were<br />
compared. The aqua regia extraction m<strong>et</strong>hod was found to give more reliable results compared to<br />
the EPA 3050 extraction.<br />
The m<strong>et</strong><strong>al</strong> content of sludge from the plants receiving industri<strong>al</strong> effluent was higher or similar to the<br />
m<strong>et</strong><strong>al</strong> content of sludge from plants receiving domestic effluent for <strong>al</strong>l the m<strong>et</strong><strong>al</strong>s with the exception<br />
of B.<br />
The sewage sludge surveyed was ev<strong>al</strong>uated in terms of leachable and tot<strong>al</strong> extractable m<strong>et</strong><strong>al</strong><br />
content with respect to compliance to the Sludge Guidelines and related Addendum. None of the<br />
plants surveyed exceeded the TCLP (leachable) extractable concentration limits as specified in the<br />
Addendum of the Sludge Guidelines. The results from the tot<strong>al</strong> m<strong>et</strong><strong>al</strong> extractions showed a<br />
different picture. The major m<strong>et</strong><strong>al</strong>s of concern are Ni and Zn. Sixty-one percent (61 %) and 44 % of<br />
the tot<strong>al</strong> mass of sludge surveyed exceeded the Ni and Zn concentration limits respectively. A<br />
major fraction (40 % mass basis) of the sludge surveyed did not exceed any of the tot<strong>al</strong> m<strong>et</strong><strong>al</strong><br />
limits. Thirty-five percent (35 % mass basis) of the sludge surveyed exceeded on one or two<br />
m<strong>et</strong><strong>al</strong>s. Only 4% of the sludge surveyed, exceeded the limits for more than seven of the twelve<br />
m<strong>et</strong><strong>al</strong>s an<strong>al</strong>ysed for.<br />
INTRODUCTION<br />
The concentration of potenti<strong>al</strong>ly toxic m<strong>et</strong><strong>al</strong>s and elements (hereafter referred to as “m<strong>et</strong><strong>al</strong>s”) of<br />
South African sewage sludge was d<strong>et</strong>ermined in 1989 by Smith and Vasiloudis (1) who surveyed<br />
77 wastewater treatment plants. Smith and Vasiloudis (1) used tot<strong>al</strong> extraction m<strong>et</strong>hods to<br />
d<strong>et</strong>ermine the m<strong>et</strong><strong>al</strong> content of sewage sludge. However, the South African Sludge Guidelines<br />
have been revised since this survey was done. It now includes the requirement that sludge<br />
samples should be extracted using both a tot<strong>al</strong> and an available (leachable) extraction m<strong>et</strong>hod.<br />
This is d<strong>et</strong>ailed in the document entitled: “Permissible utilisation and dispos<strong>al</strong> of sewage sludge,<br />
Edition 1” published in 1997 (2) and the related addendum (Addendum No 1 to Edition 1 (1997) of<br />
the Permissible utilisation and dispos<strong>al</strong> of sewage sludge in 2002) (3) that advises use of both the<br />
aqua regia extraction m<strong>et</strong>hod (tot<strong>al</strong> extraction m<strong>et</strong>hod) and the Toxicity Characteristic Leaching<br />
Procedure (TCLP) (leachable extraction m<strong>et</strong>hod) to characterise the m<strong>et</strong><strong>al</strong>s in sewage sludge. The<br />
aqua regia and EPA 3050 extraction m<strong>et</strong>hods are commonly referred to as tot<strong>al</strong> extraction m<strong>et</strong>hods<br />
<strong>al</strong>though they are not an accurate reflection of the tot<strong>al</strong> extractable m<strong>et</strong><strong>al</strong>s in a sample. More<br />
aggressive extraction m<strong>et</strong>hods exist for this purpose.<br />
Proceedings of the 2004 Water Institute of Southern Africa (WISA) Bienni<strong>al</strong> Conference 2 –6 May 2004<br />
ISBN: 1-920-01728-3 Cape Town, South Africa<br />
Produced by: Document Transformation Technologies Organised by Event Dynamics
The TCLP was developed to measure a wastes’ leachability and hence the risk to pollute<br />
groundwater. It is typic<strong>al</strong>ly used when a waste is to be landfilled in a site that receives a vari<strong>et</strong>y of<br />
organic and inorganic wastes. The procedure aims to simulate the dissolving action of the organic<br />
acid leachate formed in a landfill where hazardous waste has been co-disposed with gener<strong>al</strong><br />
waste. It can be used to d<strong>et</strong>ermine the mobility of organics and inorganics in liquid, solid, and<br />
multiphase wastes. The TCLP has historic<strong>al</strong>ly not been used by the wastewater industry to assess<br />
the amount of sludge to be safely used in agricultur<strong>al</strong> practices. Most wastewater laboratories have<br />
used the aqua regia (tot<strong>al</strong>) extraction, which gives an indication of the acid soluble fraction.<br />
Therefore, limited data is available for applying the TCLP to sludge samples. In addition, the m<strong>et</strong><strong>al</strong><br />
limits in the Sludge Guidelines are still being debated, particularly the an<strong>al</strong>ytic<strong>al</strong> m<strong>et</strong>hods for<br />
d<strong>et</strong>ermining m<strong>et</strong><strong>al</strong>s in sludge. These issues are currently being addressed in the development of<br />
the “Permissible utilisation and dispos<strong>al</strong> of sewage sludge, Edition 2”. In the interim, the<br />
explanatory addendum (3) stipulates that sludge should be extracted with both the TCLP<br />
(leachable) and aqua regia (tot<strong>al</strong>) extraction m<strong>et</strong>hods. In this study, the extraction procedure<br />
included both the TCLP and aqua regia extraction m<strong>et</strong>hods. This data was used to d<strong>et</strong>ermine the<br />
extent of compliance to the current Sludge Guidelines (2 and 3).<br />
MATERIALS AND METHODS<br />
Two hundred South African wastewater treatment plants (WWTPs) were initi<strong>al</strong>ly pre-selected and<br />
interviewed telephonic<strong>al</strong>ly. A sample of 72 plants was selected from the initi<strong>al</strong> 200 plants based on<br />
a questionnaire used to gather background information with emphasis on the treatment m<strong>et</strong>hods<br />
and the type of sludge produced. To achieve this some sludge samples did not represent the end<br />
product. For example, in many plants, activated sludge is blended with other sludge types to form<br />
the end product. In such a case, a decision had to be made to either sample the blend or the<br />
activated sludge.<br />
Sludge samples (78 – more than one sample was collected from some plants) were collected at<br />
the selected wastewater treatment plants. Three rounds of sampling was done to include season<strong>al</strong><br />
variation i.e. winter, summer and autumn. These samples were an<strong>al</strong>ysed for microbiologic<strong>al</strong>,<br />
nutrient and selected m<strong>et</strong><strong>al</strong> concentrations. This paper will focuses on the results of the m<strong>et</strong><strong>al</strong><br />
an<strong>al</strong>ysis only.<br />
Two different South African laboratories were selected for the an<strong>al</strong>yses: The East Rand Water<br />
Care Company Laboratory (ERLAB) and the Agricultur<strong>al</strong> Research Councils (ARC) Institute for<br />
Soil, Climate and Water (ISCW) laboratory. No accredited laboratory for the an<strong>al</strong>ysis of sludge<br />
could be found at that stage. For this reason, an inter-laboratory extraction and an<strong>al</strong>ysis train was<br />
s<strong>et</strong> up. This was done to utilise the expertise of both laboratories to the optimum. Samples were<br />
collected and transported to the laboratories with a maximum delay of 72 hours. A subsample was<br />
used to an<strong>al</strong>yse for pH and moisture content (4). The rest of the sample was dried at 50 0 C for<br />
seven days and crushed to pass through a 1 mm sieve. The samples were extracted using the<br />
following extraction m<strong>et</strong>hods: (a) Aqua regia extraction (5); (b) EPA 3050 extraction (6) and (c)<br />
TCLP (DWAF 1998). The F was extracted using the m<strong>et</strong>hod described by (5). These extracts were<br />
an<strong>al</strong>ysed for Cd, Co, Cr, Cu, Hg, Mo, Ni, Pb, Zn, As, Se and B using a VG Plasmaquad PQ2 Turbo<br />
Plus Inductively Coupled Plasma Spectrom<strong>et</strong>er (ICP-MS).<br />
The an<strong>al</strong>ytic<strong>al</strong> data was used to classify the sludge and to d<strong>et</strong>ermine the impact of the existing<br />
Guidelines on the dispos<strong>al</strong> options.<br />
The m<strong>et</strong><strong>al</strong> data was interpr<strong>et</strong>ed to reflect the contribution of the plants to m<strong>et</strong><strong>al</strong> load of the tot<strong>al</strong><br />
mass of sludge an<strong>al</strong>ysed in this study. In other words, as large plants contribute more sludge than<br />
sm<strong>al</strong>l plants, it was necessary to express the an<strong>al</strong>ytic<strong>al</strong> data on a mass basis to obtain a clear<br />
overview of trends in the country. Some of the wastewater treatment plants could not supply the<br />
mass of sludge produced per day. For these plants, the mass of sludge was c<strong>al</strong>culated using the<br />
inflow volume and inflow COD.
RESULTS AND DISCUSSION<br />
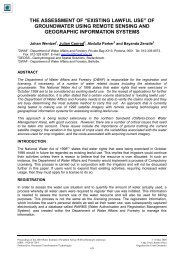
Figure 1 gives a geographic<strong>al</strong> map of the plants selected. The plants represented different<br />
treatment m<strong>et</strong>hods geographic<strong>al</strong>ly spread throughout South Africa.<br />
Figure 1. Geographic<strong>al</strong> representation of selected plants categorised into the treatment m<strong>et</strong>hod.<br />
Anaerobic Digestion<br />
57%<br />
Activated Sludge<br />
20%<br />
Blended sludge<br />
12%<br />
P<strong>et</strong>ro sludge<br />
2%<br />
Oxidation Dams<br />
0.3%<br />
Aerobic digestion<br />
1%<br />
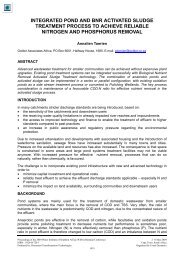
Figure 2. Sludge types produced by the wastewater treatment plants surveyed in South Africa on a mass<br />
percent basis. The blended sludge represents primary and activated or humus sludge blended before or after<br />
digestion.
Figure 2 indicates the types of sludge generated by the wastewater treatment plants surveyed. The<br />
majority of the sludge produced (57% on a mass basis) employs anaerobic digestion of primary<br />
and humus sludge.<br />
M<strong>et</strong><strong>al</strong> Content<br />
The weighted mean v<strong>al</strong>ues for the m<strong>et</strong><strong>al</strong>s an<strong>al</strong>ysed for, with respect to the extraction m<strong>et</strong>hod used,<br />
are included in Table 1.<br />
Table 1. Weighted mean* m<strong>et</strong><strong>al</strong> concentrations for <strong>al</strong>l the plants surveyed with respect to the<br />
extraction m<strong>et</strong>hod.<br />
Aqua regia<br />
(mg kg -1 )<br />
EPA 3050<br />
(mg kg -1 )<br />
TCLP<br />
(mg kg -1 )<br />
TCLP<br />
(mg L -1 M<strong>et</strong><strong>al</strong><br />
)<br />
Tot<strong>al</strong> Extraction Leachable Extraction<br />
Cd 10 6 0.03 0.0016<br />
Co 32 21 0.16 0.0079<br />
Cr 414 282 1.02 0.0512<br />
Cu 576 383 0.43 0.0217<br />
Hg 4 3 0.07 0.0035<br />
Mo 9 8 0.03 0.0016<br />
Ni 269 93 0.91 0.0456<br />
Pb 318 190 0.08 0.0042<br />
Zn 3159 1673 7.15 0.3573<br />
Se 11 6 0.07 0.0033<br />
B 57 29 0.84 0.0419<br />
* The v<strong>al</strong>ues were c<strong>al</strong>culated by d<strong>et</strong>ermining the tot<strong>al</strong> mass of each m<strong>et</strong><strong>al</strong> in the sludge for each plant<br />
based on the daily sludge production. These v<strong>al</strong>ues were then added tog<strong>et</strong>her and divided by the<br />
tot<strong>al</strong> mass of sludge produced by <strong>al</strong>l the plants.<br />
Table 1 shows that the average m<strong>et</strong><strong>al</strong> concentration v<strong>al</strong>ues for the aqua regia extraction m<strong>et</strong>hod is<br />
larger than the EPA 3050 extraction m<strong>et</strong>hod. Since the two procedures both aim to d<strong>et</strong>ermine a<br />
tot<strong>al</strong> m<strong>et</strong><strong>al</strong> concentration the higher v<strong>al</strong>ue was chosen as a precautionary principle. Furthermore<br />
the aqua regia extraction data proved to be more reliable compared to the EPA 3050 extraction<br />
m<strong>et</strong>hod. All further data interpr<strong>et</strong>ation was therefore done using the data generated from the aqua<br />
regia extracted samples.<br />
Table 2. Weighted mean* tot<strong>al</strong> (aqua regia) m<strong>et</strong><strong>al</strong> concentrations in mg kg-1 for the sludge<br />
samples collected in this survey categorised according to the inflow.<br />
M<strong>et</strong><strong>al</strong><br />
< 10<br />
ML day –1<br />
10 to 25<br />
ML day -1<br />
25 – 80<br />
ML day -1<br />
> 80<br />
ML day -1<br />
Cd 6 6 11 12<br />
Co 14 16 42 37<br />
Cr 375 359 342 504<br />
Cu 469 526 648 583<br />
Hg 6 6 3 3<br />
Mo 7 7 8 11<br />
Ni 190 205 363 261<br />
Pb 190 208 270 446<br />
Zn 2956 2758 3436 3243<br />
Se 10 9 14 11<br />
B 42 55 54 65<br />
F<br />
Mass percentage<br />
157 139 135 101<br />
of tot<strong>al</strong> sludge in<br />
each group<br />
11 22 27 40<br />
* The v<strong>al</strong>ues were c<strong>al</strong>culated by d<strong>et</strong>ermining the tot<strong>al</strong> mass of each m<strong>et</strong><strong>al</strong> in the sludge for each plant<br />
based on the daily sludge production. These v<strong>al</strong>ues were then added tog<strong>et</strong>her and divided by the tot<strong>al</strong><br />
mass of sludge produced by <strong>al</strong>l the plants in one day.
In the study the TCLP fraction was an<strong>al</strong>ysed for different m<strong>et</strong><strong>al</strong>s to establish compliance with the<br />
Sludge Guidelines (3). The TCLP was designed to predict the concentration of a m<strong>et</strong><strong>al</strong> in the<br />
leachate expressed in mg L -1 . However, the maximum leachable concentrations stipulated in the<br />
Sludge Guidelines are expressed in mg kg -1 (3). For this reason both concentrations are included<br />
in Table 1.<br />
Table 2 d<strong>et</strong>ails the weighted mean m<strong>et</strong><strong>al</strong> concentration of the surveyed wastewater treatment<br />
plants’ sludge categorised according to the inflow received. This will <strong>al</strong>low wastewater plants that<br />
were not included in this study to benchmark their m<strong>et</strong><strong>al</strong> v<strong>al</strong>ues.<br />
Influence of Industri<strong>al</strong> Effluents on Sludge M<strong>et</strong><strong>al</strong> Qu<strong>al</strong>ity<br />
The sampling sites were <strong>al</strong>so sorted into two groups; plants receiving mainly domestic effluent (and<br />
industri<strong>al</strong> effluent that should not affect the m<strong>et</strong><strong>al</strong> concentration) and plants receiving industri<strong>al</strong><br />
effluent that could affect the m<strong>et</strong><strong>al</strong> concentration. For example, if a plant receives effluent from a<br />
candy factory, it was considered a domestic plant. On the other hand, if a plant receives m<strong>et</strong><strong>al</strong><br />
plating effluent, the effluent will impact on the sludge m<strong>et</strong><strong>al</strong> qu<strong>al</strong>ity and was therefore categorised<br />
as an industri<strong>al</strong> plant. A distinction was only made with respect to m<strong>et</strong><strong>al</strong> concentration; we<br />
assumed that a wastewater treatment plant that receives industri<strong>al</strong> waste should contain more<br />
m<strong>et</strong><strong>al</strong>s than a domestic plant. Thirty-nine samples were categorised as industri<strong>al</strong> and thirty-nine as<br />
domestic. The weighted mean m<strong>et</strong><strong>al</strong> concentration for the results from this classification is shown<br />
in Figures 3 to 5.<br />
Concentration [mg kg -1 ]<br />
4500<br />
4000<br />
3500<br />
3000<br />
2500<br />
2000<br />
1500<br />
1000<br />
500<br />
0<br />
Zn<br />
M<strong>et</strong><strong>al</strong><br />
Industri<strong>al</strong> Tot<strong>al</strong> Domestic<br />
Figure 3. The weighted mean Zn concentration for industri<strong>al</strong> and domestic plants. Tot<strong>al</strong> refers to<br />
<strong>al</strong>l the plants (domestic and industri<strong>al</strong>).<br />
As expected, the Zn concentration (aqua regia; tot<strong>al</strong> extraction) for sludge generated from plants<br />
that receive industri<strong>al</strong> effluent that could affect the m<strong>et</strong><strong>al</strong> concentration of the sludge is higher than<br />
plants receiving mainly domestic effluent (Figure 3). The same trend was observed for the other<br />
m<strong>et</strong><strong>al</strong>s with the exception of B (Figure 5). This indicates that B may not be from industri<strong>al</strong> origin.
Concentration [mg kg -1 ]<br />
Concentration [mg kg -1 ]<br />
800<br />
700<br />
600<br />
500<br />
400<br />
300<br />
200<br />
100<br />
0<br />
Cr Cu Ni Pb<br />
M<strong>et</strong><strong>al</strong><br />
Industri<strong>al</strong> Tot<strong>al</strong> Domestic<br />
Figure 4. The weighted mean m<strong>et</strong><strong>al</strong> concentrations for industri<strong>al</strong> and domestic plants for Cr, Cu,<br />
Ni and Pb. Tot<strong>al</strong> refers to <strong>al</strong>l the plants (domestic and industri<strong>al</strong>).<br />
80<br />
70<br />
60<br />
50<br />
40<br />
30<br />
20<br />
10<br />
0<br />
Cd Co Hg Mo Se B<br />
M<strong>et</strong><strong>al</strong><br />
Industri<strong>al</strong> Tot<strong>al</strong> Domestic<br />
Figure 5. The weighted mean m<strong>et</strong><strong>al</strong> concentrations for industri<strong>al</strong> and domestic plants for Cd, Co, Hg,<br />
Mo, Se and B. Tot<strong>al</strong> refers to <strong>al</strong>l the plants (domestic and industri<strong>al</strong>).<br />
M<strong>et</strong><strong>al</strong> Limits<br />
Table 3 shows the <strong>al</strong>lowable m<strong>et</strong><strong>al</strong> limits for a type D sludge according to the Permissible utilisation<br />
and dispos<strong>al</strong> of sewage sludge, Edition 1 (2) and the related addendum (3). The data from the<br />
survey will be compared to the limits d<strong>et</strong>ailed in Table 3 in the next two sections.
Table 3. Allowable m<strong>et</strong><strong>al</strong> content in a Type D sludge according to the Permissible utilisation<br />
and dispos<strong>al</strong> of sewage sludge, Edition 1 and the related addendum.<br />
M<strong>et</strong><strong>al</strong><br />
Leachable limit<br />
(mg kg -1 )<br />
Tot<strong>al</strong> Limit<br />
(mg kg -1 )<br />
Cd 15.7 20<br />
Co - 100<br />
Cr - 1 750<br />
Cu 50,5 750<br />
Hg - 10<br />
Mo - 25<br />
Ni - 200<br />
Pb 50,5 400<br />
Zn 353,5 2 750<br />
As - 15<br />
Se - 15<br />
B - 80<br />
F - 400<br />
The Compliance of Sewage Sludge to the Leachable Limits<br />
The leachable concentration i.e. TCLP data was converted from mg L -1 to mg kg -1 to compare the<br />
data with the limit v<strong>al</strong>ues in the Sludge Guidelines (3). Figures 6, 7 and 8 represent the TCLP<br />
(leachable) fraction for the wastewater treatment plants in the study. Each line on the graph refers<br />
to a specific m<strong>et</strong><strong>al</strong>. They are cumulative percentage graphs and are interpr<strong>et</strong>ed as follows.<br />
Consider Mo at 0.4 mg kg -1 in Figure 6. It reads off at approximately 7 % on the y-axis. This means<br />
that approximately 7 % of the tot<strong>al</strong> mass of sludge an<strong>al</strong>ysed for has a concentration of 0.4 mg kg -1<br />
or larger.<br />
All the sludge surveyed complied with the TCLP leachable limits (Table 3) for the m<strong>et</strong><strong>al</strong>s as<br />
stipulated in the Sludge Guidelines (3).<br />
Percent of sludge mass<br />
100<br />
90<br />
80<br />
70<br />
60<br />
50<br />
40<br />
30<br />
20<br />
10<br />
0<br />
0 0.2 0.4 0.6 0.8 1<br />
mg kg<br />
1.2 1.4 1.6 1.8 2<br />
-1<br />
Cadmium Molybdenum Selenium Mercury<br />
Figure 6. Mass percentage distribution of the sludge in terms of the leachable (TCLP) m<strong>et</strong><strong>al</strong><br />
concentration for Cd, Mo, Se and Hg in units of mg kg-1.
Percent of sludge mass<br />
Percent of sludge mass<br />
100<br />
90<br />
80<br />
70<br />
60<br />
50<br />
40<br />
30<br />
20<br />
10<br />
0<br />
0 2 4 6 8<br />
mg kg<br />
10 12 14 16<br />
-1<br />
Copper Cob<strong>al</strong>t Chromium Lead<br />
Figure 7. Mass percentage distribution of the sludge in terms of the leachable (TCLP) m<strong>et</strong><strong>al</strong><br />
concentration for Cu, Co, Cr and Pb in units of mg kg-1.<br />
100<br />
90<br />
80<br />
70<br />
60<br />
50<br />
40<br />
30<br />
20<br />
10<br />
0<br />
0 5 10 15 20 25<br />
mg kg -1<br />
Zinc Nickel<br />
Figure 8. Mass percentage distribution of the sludge in terms of the leachable (TCLP) m<strong>et</strong><strong>al</strong><br />
concentration for Zn and Ni in units of mg kg-1.<br />
The Compliance of Sewage Sludge to the Tot<strong>al</strong> Limits<br />
Figure 9 represents the mass percentage of the surveyed sludge that exceeded the m<strong>et</strong><strong>al</strong><br />
concentration for type D sludge (Table 3) as specified in the Sludge Guidelines (3). The tot<strong>al</strong> mass<br />
of sludge was considered (an<strong>al</strong>ysed using the aqua regia tot<strong>al</strong> extraction m<strong>et</strong>hod) irrespective of its<br />
classification. In other words, type A, B, C and D sludge was considered in this an<strong>al</strong>ysis. Fifty-one<br />
percent (51%) and 44 % of the tot<strong>al</strong> mass of sludge surveyed exceeded the Ni and Zn<br />
concentration limits respectively. The survey included the an<strong>al</strong>ysis of As, however the an<strong>al</strong>ytic<strong>al</strong><br />
m<strong>et</strong>hods used exaggerated the As concentration. This exaggeration was a function of the ICP-MS<br />
and these results was therefore omitted from both the tot<strong>al</strong> and leachable results.
Percentage of tot<strong>al</strong> sludge an<strong>al</strong>ysed<br />
60<br />
50<br />
40<br />
30<br />
20<br />
10<br />
0<br />
9.1<br />
6.0<br />
2.3<br />
23.4<br />
7.6<br />
1.9<br />
Cd Co Cr Cu Hg Mo Ni Pb Zn Se B F<br />
M<strong>et</strong><strong>al</strong><br />
Figure 9. Mass percentage of the surveyed sludge exceeding the guidelines for a type D sludge based on<br />
the tot<strong>al</strong> aqua regia concentrations.<br />
Figure 10 represents the tot<strong>al</strong> mass of sludge an<strong>al</strong>ysed in this project. The graph specifies the<br />
mass percentage of the tot<strong>al</strong> sludge that exceeds a number of m<strong>et</strong><strong>al</strong>s according to the Sludge<br />
Guideline (2) and Addendum (3). The m<strong>et</strong><strong>al</strong>s that were considered for the interpr<strong>et</strong>ation of this<br />
graph were Cd, Co, Cr, Cu, Hg, Mo, Ni, Pb, Zn, Se, B, and F. The mass percentage of sludge<br />
surveyed that exceeds with one m<strong>et</strong><strong>al</strong> is mainly due to Ni, Zn, B, and Hg. No sludge surveyed<br />
exceeded more than 9 m<strong>et</strong><strong>al</strong>s. Seven percent (7 %) of the tot<strong>al</strong> mass of the sludge an<strong>al</strong>ysed<br />
exceeded the limits for more than six m<strong>et</strong><strong>al</strong>s (3 % exceeded six m<strong>et</strong><strong>al</strong>s; 2 % exceeded seven<br />
m<strong>et</strong><strong>al</strong>s; 0 % exceeded exactly eight m<strong>et</strong><strong>al</strong>s and 2 % exceeded nine m<strong>et</strong><strong>al</strong>s).<br />
4 m<strong>et</strong><strong>al</strong>s<br />
4%<br />
3 m<strong>et</strong><strong>al</strong>s<br />
5%<br />
5 m<strong>et</strong><strong>al</strong>s<br />
10%<br />
6 m<strong>et</strong><strong>al</strong>s<br />
3%<br />
7 m<strong>et</strong><strong>al</strong>s<br />
2%<br />
2 m<strong>et</strong><strong>al</strong>s<br />
23%<br />
8 m<strong>et</strong><strong>al</strong>s<br />
0%<br />
50.8<br />
1 m<strong>et</strong><strong>al</strong><br />
12%<br />
9 m<strong>et</strong><strong>al</strong>s<br />
2%<br />
11.0<br />
0 m<strong>et</strong><strong>al</strong>s<br />
40%<br />
Figure 10. Mass percentage of the surveyed sludge exceeding the guidelines for a type D sludge based on<br />
the tot<strong>al</strong> aqua regia concentrations and d<strong>et</strong>ailing the number of m<strong>et</strong><strong>al</strong>s that exceed.<br />
43.5<br />
10.7<br />
18.8<br />
0.0
CONCLUSIONS<br />
Seventy-two (72) wastewater treatment plants were selected to represent different sludge types<br />
and sludge handling technologies in South Africa. Sludge samples (78) were collected at these<br />
selected wastewater treatment plants. These samples were an<strong>al</strong>ysed for Cd, Co, Cr, Cu, Hg, Mo,<br />
Ni, Pb, Zn, Se, B and F, using three extraction m<strong>et</strong>hods. The an<strong>al</strong>ytic<strong>al</strong> data was used to classify<br />
the sludge and to d<strong>et</strong>ermine the impact of the existing guidelines on the dispos<strong>al</strong> options.<br />
The efficiency of the extraction m<strong>et</strong>hods, aqua regia (tot<strong>al</strong>), EPA 3050 (tot<strong>al</strong>), and TCLP<br />
(leachable) were compared. The aqua regia extraction m<strong>et</strong>hod was found to give more reliable<br />
results compared to the EPA 3050 extraction.<br />
The average m<strong>et</strong><strong>al</strong> concentration of the sludge from the surveyed plants receiving industri<strong>al</strong><br />
effluent (50%) was compared to the plants that do not receive industri<strong>al</strong> effluent. As expected, the<br />
m<strong>et</strong><strong>al</strong> concentration (aqua regia tot<strong>al</strong> extraction) of sludge from the plants receiving industri<strong>al</strong><br />
effluent was higher or similar to the average m<strong>et</strong><strong>al</strong> concentration from sludge plants receiving<br />
domestic effluent for <strong>al</strong>l the m<strong>et</strong><strong>al</strong>s with the exception of B.<br />
The compliance to the Sludge Guideline and related Addendum of the sewage sludge surveyed in<br />
this study was ev<strong>al</strong>uated in terms of the leachable and tot<strong>al</strong> extractable m<strong>et</strong><strong>al</strong> content. None of the<br />
plants surveyed exceeded the leachable (TCLP) extractable concentration limits as specified in the<br />
Addendum of the 1997 Sludge Guidelines. The results from the tot<strong>al</strong> m<strong>et</strong><strong>al</strong> extractions showed a<br />
different picture. The major m<strong>et</strong><strong>al</strong>s of concern are Ni and Zn. Sixty-one percent (61%) and 44% of<br />
the tot<strong>al</strong> mass of sludge surveyed exceeded the Ni and Zn concentration limits respectively. A<br />
major fraction (40%) of the sludge surveyed did not exceed any of the tot<strong>al</strong> m<strong>et</strong><strong>al</strong> limits. Thirty-five<br />
percent (35% mass basis) of the sludge surveyed exceeded on one or two m<strong>et</strong><strong>al</strong>s. Only 4 % of the<br />
sludge surveyed, exceeded the limits for more than seven of the twelve m<strong>et</strong><strong>al</strong>s an<strong>al</strong>ysed for.<br />
ACKNOWLEDGEMENTS<br />
The authors wish to acknowledge and thank the Water Research Commission for funding the<br />
research. The authors would <strong>al</strong>so like to thank the East Rand Water Care Company (ERWAT) in<br />
particular, Mr JW Wilken (ERWAT) and the staff at ERLAB for their contributions as well as the<br />
Agricultur<strong>al</strong> Research Commission (ARC) Institute for Soil Climate and Water (ISCW) specific<strong>al</strong>ly<br />
Mr A Loock.<br />
REFERENCES<br />
1. R. Smith and H Vasiloudis, Inorganic Chemic<strong>al</strong> Characterisation of South African Municip<strong>al</strong> Sewage<br />
Sludges. WRC Report 180/1/89 (1989).<br />
2. Permissible Utilisation and Dispos<strong>al</strong> of Sewage Sludge. 1 st Edition. TT85-97, WRC (1997).<br />
3. Addendum No, 1 to Edition 1 (1997) of Permissible Utilisation and Dispos<strong>al</strong> of Sewage Sludge. TT<br />
150/01 WRC (2002).<br />
4. Standard M<strong>et</strong>hods for the Examination of Water and Wastewater, 19 th Edition, pub Water<br />
Environment Federation, USA (ed. M.A.F. Franson, A.D. Eaton, L.S. Clesceri, and A.E. Greenberg)<br />
(1995).<br />
5. M<strong>et</strong>hods of Soil An<strong>al</strong>ysis. Part 3: Chemic<strong>al</strong> M<strong>et</strong>hods, pub Soil Science Soci<strong>et</strong>y of America and<br />
American Soci<strong>et</strong>y of Agronomy, USA (ed. J.M. Bigham and J.M. Bartels)(1996).<br />
6. Test M<strong>et</strong>hods for Ev<strong>al</strong>uating Solid Waste, Physic<strong>al</strong>/Chemic<strong>al</strong> M<strong>et</strong>hods (SW-846): M<strong>et</strong>hod 3050 Acid<br />
Digestion of Sediments, Sludges and Soils, pub USA EPA, (1986).<br />
7. DWAF, Waste Management Series, Minimum Requirements for the Handling, Classification and<br />
Dispos<strong>al</strong> of Hazardous Waste (1998).