Involving the Consumer in Drinking Water Quality Testing - eWISA
Involving the Consumer in Drinking Water Quality Testing - eWISA
Involving the Consumer in Drinking Water Quality Testing - eWISA

You also want an ePaper? Increase the reach of your titles
YUMPU automatically turns print PDFs into web optimized ePapers that Google loves.
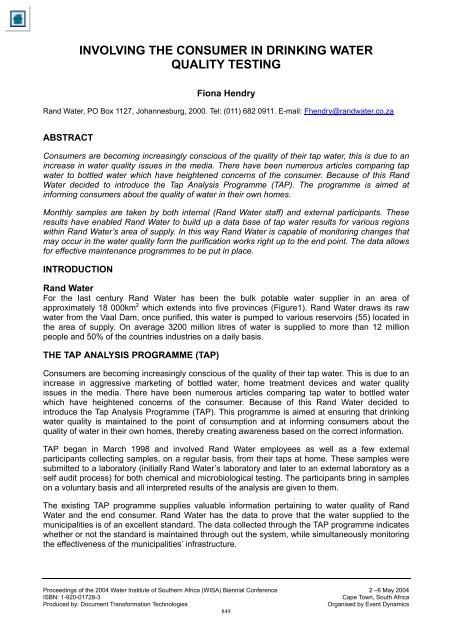
INVOLVING THE CONSUMER IN DRINKING WATER<br />
QUALITY TESTING<br />
Fiona Hendry<br />
Rand <strong>Water</strong>, PO Box 1127, Johannesburg, 2000. Tel: (011) 682 0911. E-mail: Fhendry@randwater.co.za<br />
ABSTRACT<br />
<strong>Consumer</strong>s are becom<strong>in</strong>g <strong>in</strong>creas<strong>in</strong>gly conscious of <strong>the</strong> quality of <strong>the</strong>ir tap water, this is due to an<br />
<strong>in</strong>crease <strong>in</strong> water quality issues <strong>in</strong> <strong>the</strong> media. There have been numerous articles compar<strong>in</strong>g tap<br />
water to bottled water which have heightened concerns of <strong>the</strong> consumer. Because of this Rand<br />
<strong>Water</strong> decided to <strong>in</strong>troduce <strong>the</strong> Tap Analysis Programme (TAP). The programme is aimed at<br />
<strong>in</strong>form<strong>in</strong>g consumers about <strong>the</strong> quality of water <strong>in</strong> <strong>the</strong>ir own homes.<br />
Monthly samples are taken by both <strong>in</strong>ternal (Rand <strong>Water</strong> staff) and external participants. These<br />
results have enabled Rand <strong>Water</strong> to build up a data base of tap water results for various regions<br />
with<strong>in</strong> Rand <strong>Water</strong>’s area of supply. In this way Rand <strong>Water</strong> is capable of monitor<strong>in</strong>g changes that<br />
may occur <strong>in</strong> <strong>the</strong> water quality form <strong>the</strong> purification works right up to <strong>the</strong> end po<strong>in</strong>t. The data allows<br />
for effective ma<strong>in</strong>tenance programmes to be put <strong>in</strong> place.<br />
INTRODUCTION<br />
Rand <strong>Water</strong><br />
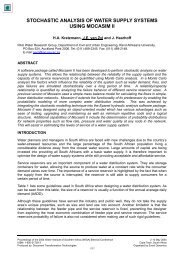
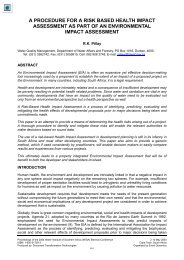
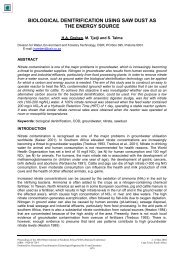
For <strong>the</strong> last century Rand <strong>Water</strong> has been <strong>the</strong> bulk potable water supplier <strong>in</strong> an area of<br />
approximately 18 000km 2 which extends <strong>in</strong>to five prov<strong>in</strong>ces (Figure1). Rand <strong>Water</strong> draws its raw<br />
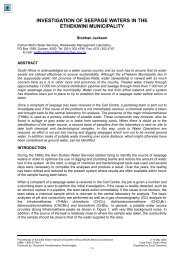
water from <strong>the</strong> Vaal Dam, once purified, this water is pumped to various reservoirs (55) located <strong>in</strong><br />
<strong>the</strong> area of supply. On average 3200 million litres of water is supplied to more than 12 million<br />
people and 50% of <strong>the</strong> countries <strong>in</strong>dustries on a daily basis.<br />
THE TAP ANALYSIS PROGRAMME (TAP)<br />
<strong>Consumer</strong>s are becom<strong>in</strong>g <strong>in</strong>creas<strong>in</strong>gly conscious of <strong>the</strong> quality of <strong>the</strong>ir tap water. This is due to an<br />
<strong>in</strong>crease <strong>in</strong> aggressive market<strong>in</strong>g of bottled water, home treatment devices and water quality<br />
issues <strong>in</strong> <strong>the</strong> media. There have been numerous articles compar<strong>in</strong>g tap water to bottled water<br />
which have heightened concerns of <strong>the</strong> consumer. Because of this Rand <strong>Water</strong> decided to<br />
<strong>in</strong>troduce <strong>the</strong> Tap Analysis Programme (TAP). This programme is aimed at ensur<strong>in</strong>g that dr<strong>in</strong>k<strong>in</strong>g<br />
water quality is ma<strong>in</strong>ta<strong>in</strong>ed to <strong>the</strong> po<strong>in</strong>t of consumption and at <strong>in</strong>form<strong>in</strong>g consumers about <strong>the</strong><br />
quality of water <strong>in</strong> <strong>the</strong>ir own homes, <strong>the</strong>reby creat<strong>in</strong>g awareness based on <strong>the</strong> correct <strong>in</strong>formation.<br />
TAP began <strong>in</strong> March 1998 and <strong>in</strong>volved Rand <strong>Water</strong> employees as well as a few external<br />
participants collect<strong>in</strong>g samples, on a regular basis, from <strong>the</strong>ir taps at home. These samples were<br />
submitted to a laboratory (<strong>in</strong>itially Rand <strong>Water</strong>’s laboratory and later to an external laboratory as a<br />
self audit process) for both chemical and microbiological test<strong>in</strong>g. The participants br<strong>in</strong>g <strong>in</strong> samples<br />
on a voluntary basis and all <strong>in</strong>terpreted results of <strong>the</strong> analysis are given to <strong>the</strong>m.<br />
The exist<strong>in</strong>g TAP programme supplies valuable <strong>in</strong>formation perta<strong>in</strong><strong>in</strong>g to water quality of Rand<br />
<strong>Water</strong> and <strong>the</strong> end consumer. Rand <strong>Water</strong> has <strong>the</strong> data to prove that <strong>the</strong> water supplied to <strong>the</strong><br />
municipalities is of an excellent standard. The data collected through <strong>the</strong> TAP programme <strong>in</strong>dicates<br />
whe<strong>the</strong>r or not <strong>the</strong> standard is ma<strong>in</strong>ta<strong>in</strong>ed through out <strong>the</strong> system, while simultaneously monitor<strong>in</strong>g<br />
<strong>the</strong> effectiveness of <strong>the</strong> municipalities’ <strong>in</strong>frastructure.<br />
Proceed<strong>in</strong>gs of <strong>the</strong> 2004 <strong>Water</strong> Institute of Sou<strong>the</strong>rn Africa (WISA) Biennial Conference 2 –6 May 2004<br />
ISBN: 1-920-01728-3 Cape Town, South Africa<br />
Produced by: Document Transformation Technologies Organised by Event Dynamics
Figure 1. Rand <strong>Water</strong>s area of supply.<br />
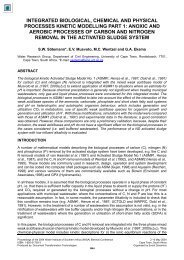
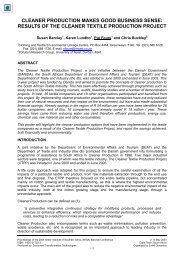
Figure 2. <strong>Water</strong> supply route.<br />
Rand <strong>Water</strong> supplies potable water to 16 municipal areas. The programme currently concentrates<br />
on <strong>the</strong> more densely populated regions where <strong>the</strong> bulk of potable water is consumed. There are<br />
plans to <strong>in</strong>clude <strong>the</strong> o<strong>the</strong>r municipal area <strong>in</strong>to <strong>the</strong> programme, however, <strong>the</strong> rout<strong>in</strong>e sampl<strong>in</strong>g is<br />
dependent on <strong>the</strong> <strong>in</strong>terest of <strong>the</strong> participant.<br />
Table 1. Municipal areas/ Current number of TAP participants.<br />
Municipal Area Current Number of Municipal Area Current Number of<br />
TAP Participants<br />
TAP Participants<br />
Delmas NONE Midvaal 3<br />
Ekurhuleni 9 Mogale NONE<br />
Emfuleni 3 Ngwa<strong>the</strong> NONE<br />
Highveld East NONE Randfontien NONE<br />
Johannesburg 12 Rustenburg NONE<br />
Kungw<strong>in</strong>i NONE Tshwane 3<br />
Lesedi NONE Westonaria NONE<br />
Metsimaholo NONE
RESULTS<br />
All samples taken for <strong>the</strong> TAP programme are analysed by an accredited laboratory. Twenty five<br />
variables are monitored on a monthly basis, <strong>the</strong>se variables <strong>in</strong>clude:<br />
• Chemical and Physical properties<br />
Alkal<strong>in</strong>ity, Colour, Conductivity, Turbidity, Hardness, pH, pHs and Calcium Carbonate<br />
Precipitation Potential(CCPP).<br />
• Micro Elements<br />
Cadmium and Lead<br />
• Macro Elements and Miscellaneous Determ<strong>in</strong>ants<br />
Alum<strong>in</strong>ium, Manganese, Calcium, Copper, Fluoride, Magnesium, Iron, Nitrate, Sulphate and<br />
Z<strong>in</strong>c.<br />
• Microbiological<br />
Total Chlor<strong>in</strong>e, Standard Plate Count, Total Coliforms, Faecal Coliforms and Confirmed E.coli.<br />
Of <strong>the</strong> twenty five variables monitored Alkal<strong>in</strong>ity, Hardness, pHs, CCPP and Total Chlor<strong>in</strong>e do NOT<br />
have specified standards set out <strong>in</strong> <strong>the</strong> SABS 241:2001 recommended dr<strong>in</strong>k<strong>in</strong>g water standards.<br />
These variables are measured aga<strong>in</strong>st <strong>in</strong>ternal standards, however, due to <strong>the</strong> fact that <strong>the</strong>re are<br />
no external standards <strong>the</strong>y will not be discussed fur<strong>the</strong>r.<br />
All but three of <strong>the</strong> rema<strong>in</strong><strong>in</strong>g twenty variables comply with SABS standards, <strong>the</strong> three that have<br />
not complied with <strong>the</strong> standards dur<strong>in</strong>g 2003 are discussed <strong>in</strong> more detail below.<br />
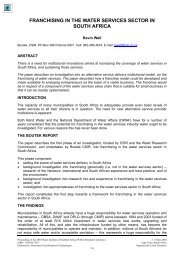
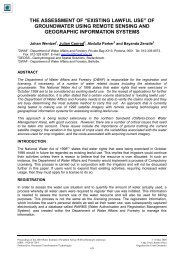
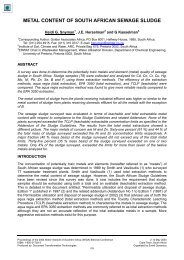
Turbidity<br />
Accord<strong>in</strong>g to <strong>the</strong> SABS standards <strong>the</strong> recommended value for turbidity should be less than 1 NTU<br />
for 95% of <strong>the</strong> time to comply with class 1. The results below show that <strong>the</strong> water <strong>in</strong> Rand <strong>Water</strong>s<br />
distribution network (Distribution) complies with this standard completely. The water tested at <strong>the</strong><br />
end consumer (TAP) does not always comply with <strong>the</strong> recommended standard.<br />
Figure 3. Compliance level of turbidity.<br />
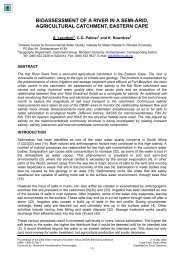
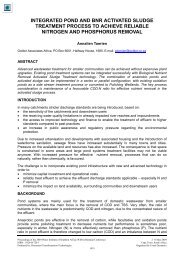
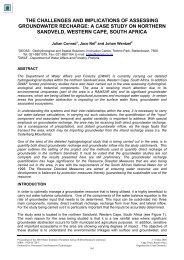
Iron<br />
The SABS standards recommend that <strong>the</strong> iron value be less than 0.2 mg/ℓ for 95% of <strong>the</strong> time to<br />
comply with class 1. It is clearly illustrated <strong>in</strong> <strong>the</strong> graph below that <strong>the</strong> water <strong>in</strong> <strong>the</strong> distribution<br />
network fully complies with <strong>the</strong> recommended standard. Although <strong>the</strong> iron values for <strong>the</strong> samples<br />
taken at <strong>the</strong> end consumer comply with <strong>the</strong> standard for <strong>the</strong> most part it is clearly seen that <strong>the</strong> iron<br />
content <strong>in</strong> <strong>the</strong> water can change quite considerably from <strong>the</strong> purification station to <strong>the</strong> end<br />
consumer.
Figure 4. Compliance level of iron.<br />
Standard Plate Counts<br />
The SABS standards state that <strong>the</strong> number of Heterotrophic Bacteria per 1mℓ (cfu per 1ℓ) should<br />
not exceed 1000 for 96% of <strong>the</strong> time to comply with <strong>the</strong> class 1 standard. The water monitored <strong>in</strong><br />
<strong>the</strong> distribution network complies with this completely, however, <strong>the</strong> water monitored at <strong>the</strong> end<br />
consumer shows a decrease <strong>in</strong> bacteriological quality.<br />
CONCLUSION<br />
Figure 5. Compliance level of <strong>the</strong> standard plate count.<br />
The results of <strong>the</strong> monthly samples taken <strong>in</strong>dicate that <strong>the</strong> water that reaches <strong>the</strong> end consumer is<br />
still of potable quality. The three variables that do show deterioration do not have a negative health<br />
impact. The <strong>in</strong>crease <strong>in</strong> turbidity could <strong>in</strong>dicate <strong>the</strong> need to clean <strong>the</strong> municipal reservoirs <strong>in</strong> certa<strong>in</strong><br />
areas. In <strong>the</strong> past Rand <strong>Water</strong> used <strong>the</strong> turbidity values to determ<strong>in</strong>e <strong>the</strong> need for clean<strong>in</strong>g <strong>the</strong><br />
reservoirs, <strong>the</strong> <strong>in</strong>formation that is collected through this programme could be used by <strong>the</strong><br />
municipalities to develop <strong>the</strong>ir reservoir ma<strong>in</strong>tenance programmes. The <strong>in</strong>crease <strong>in</strong> iron values<br />
gives an <strong>in</strong>dication of deterioration of pipe l<strong>in</strong>es, this may also be useful <strong>in</strong>formation to consider<br />
when pipel<strong>in</strong>e renovation programmes are implemented. Although <strong>the</strong>re is a remarkable <strong>in</strong>crease<br />
<strong>in</strong> <strong>the</strong> SPC results at <strong>the</strong> end consumer, <strong>the</strong>re is still no <strong>in</strong>dication that <strong>the</strong> water quality is worse as<br />
no total or faecal coliforms are detected. The SPC values could be lowered by decentralised<br />
dos<strong>in</strong>g with chlor<strong>in</strong>e with<strong>in</strong> <strong>the</strong> municipal distribution networks. This would fur<strong>the</strong>r ensure that<br />
chlor<strong>in</strong>e related taste and odour compla<strong>in</strong>ts are limited.