Download PDF - Springer
Download PDF - Springer
Download PDF - Springer

You also want an ePaper? Increase the reach of your titles
YUMPU automatically turns print PDFs into web optimized ePapers that Google loves.
Eur Radiol (2008) 18: 2498–2511<br />
DOI 10.1007/s00330-008-1018-6 GASTROINTESTINAL<br />
Wytze Laméris<br />
Adrienne van Randen<br />
Shandra Bipat<br />
Patrick M. M. Bossuyt<br />
Marja A. Boermeester<br />
Jaap Stoker<br />
Received: 30 November 2007<br />
Accepted: 22 March 2008<br />
Published online: 4 June 2008<br />
# The Author(s) 2008<br />
The Dutch Organisation for Health Research<br />
and Development, Health Care Efficiency<br />
Research programme, funded the study<br />
(ZonMw, grant number 945-04-308).<br />
W. Laméris . M. A. Boermeester<br />
Department of Surgery,<br />
Academic Medical Center,<br />
University of Amsterdam,<br />
Amsterdam, The Netherlands<br />
A. van Randen . S. Bipat . J. Stoker<br />
Department of Radiology,<br />
Academic Medical Center,<br />
University of Amsterdam,<br />
Amsterdam, The Netherlands<br />
P. M. M. Bossuyt<br />
Department of Clinical Epidemiology,<br />
Biostatistics and Bioinformatics,<br />
Academic Medical Center,<br />
University of Amsterdam,<br />
Amsterdam, The Netherlands<br />
Introduction<br />
In the Western elderly population acute colonic diverticulitis<br />
(ACD) is a common disease of the gastrointestinal<br />
tract. The prevalence of diverticulosis, the<br />
underlying pathological condition, ranges from 10% in<br />
people under 40 years to as high as 60% in people older<br />
Graded compression ultrasonography<br />
and computed tomography in acute colonic<br />
diverticulitis: Meta-analysis of test accuracy<br />
W. Laméris (*)<br />
Department of Surgery<br />
(suite G4–130), Academic<br />
Medical Center,<br />
Meibergdreef 9,<br />
1105 AZ Amsterdam, The Netherlands<br />
e-mail: W.Lameris@amc.uva.nl<br />
Tel.: +31-205-663405<br />
Fax: +31-205-69243<br />
Abstract The purpose was to investigate<br />
the diagnostic accuracy of<br />
graded compression ultrasonography<br />
(US) and computed tomography (CT)<br />
in diagnosing acute colonic diverticulitis<br />
(ACD) in suspected patients. We<br />
performed a systematic review and<br />
meta-analysis of the accuracy of CT<br />
and US in diagnosing ACD. Study<br />
quality was assessed with the<br />
QUADAS tool. Summary estimates of<br />
sensitivity and specificity were calculated<br />
using a bivariate random effects<br />
model. Six US studies evaluated 630<br />
patients, and eight CT studies evaluated<br />
684 patients. Overall, their quality<br />
was moderate. We did not identify<br />
meaningful sources of heterogeneity<br />
in the study results. Summary sensitivity<br />
estimates were 92% (95% CI:<br />
80%-97%) for US versus 94% (95%<br />
CI: 87%-97%) for CT (p=0.65).<br />
Summary specificity estimates were<br />
90% (95%CI: 82%-95%) for US<br />
versus 99% (95%CI: 90%-100%) for<br />
CT (p=0.07). For the identification of<br />
alternative diseases sensitivity ranged<br />
between 33% and 78% for US and<br />
between 50% and 100% for CT. The<br />
currently best available evidence<br />
shows no statistically significant difference<br />
in accuracy of US and CT in<br />
diagnosing ACD. Therefore, both US<br />
and CT can be used as initial diagnostic<br />
tool until new evidence is<br />
brought forward. However, CT is<br />
more likely to identify alternative<br />
diseases.<br />
Keywords Diverticulitis .<br />
Ultrasonography . Tomography .<br />
X-ray computed . Sensitivity and<br />
specificity . Meta-analysis<br />
than 80 years. Approximately 10% to 20% of affected<br />
people will develop one or more episodes of ACD<br />
[1, 2].<br />
A widely shared view nowadays is that imaging is<br />
mandatory in the initial assessment of patients suspected of<br />
ACD [3–5] to cope with clinical misdiagnosis rates, the<br />
discrepancy between clinical presentation and the extent of
ACD, and the possibility that other diseases mimicking<br />
ACD are missed.<br />
Ultrasonography (US) and computed tomography (CT)<br />
are used in daily practice to complement clinical assessment<br />
and physical examination in diagnosing ACD. Those<br />
in favour of US stress its lower costs, wider availability,<br />
and the lack of radiation exposure and use of contrast<br />
material. CT imaging is embraced by others because they<br />
claim CT is less operator dependent than US in obtaining<br />
high diagnostic accuracy, generates fewer inconclusive<br />
results, and is able to assist in surgical planning when<br />
intervention is needed [2, 5, 6].<br />
Reported sensitivities and specificities vary, both for US<br />
and CT [5, 7]. A systematic review of prospective studies<br />
may be able to summarise the diagnostic accuracy of both<br />
investigations, providing estimates with greater precision.<br />
Ideally, this analysis would merely include studies<br />
investigating the diagnostic accuracy of US and CT in<br />
the same population (head-to-head comparison). Since<br />
such comparative studies are scarce, we performed a<br />
systematic review and meta-analysis of prospective<br />
comparative studies, as well as prospective studies<br />
investigating US or CT separately.<br />
Methods<br />
Search strategy and study eligibility<br />
We performed a literature search to identify studies<br />
investigating the diagnostic accuracy of US and CT in<br />
human subjects suspected of ACD. We searched MEDLINE<br />
and EMBASE databases for papers published between<br />
January 1966 and January 2007, using the following<br />
keywords: [“Diverticulitis”(MeSH) OR “Diverticulitis, Colonic”(MeSH)]<br />
AND [“Radiography”[MeSH] OR “radiography”(Subheading)<br />
OR “Radiography, Thoracic”(MeSH)<br />
OR “Radiography, Abdominal”(MeSH) OR “Tomography,<br />
X-Ray Computed”(MeSH) OR “Tomography Scanners,<br />
X-Ray Computed”(MeSH) OR “Tomography, Spiral Computed”(MeSH)<br />
OR “Ultrasonography” (MeSH) OR “ultrasonography”(Subheading)].<br />
CINAHL database was also checked for relevant studies<br />
with the following keywords: [diverticulitis (MeSH) and<br />
(Ultrasonography (MeSH) or Echography (MeSH) or<br />
Radiography (MeSH) or Computed tomography (MeSH)<br />
or Computer-Assisted Tomography (MeSH))]. The Cochrane<br />
database of Systematic Reviews was searched with<br />
the following words: Diverticulitis AND (ultrasonography<br />
OR computed tomography).<br />
Studies were eligible if they addressed the diagnostic<br />
accuracy of US, CT, or both, in patients with suspected<br />
ACD. No age, date or language restrictions were applied. If<br />
studies were judged potentially eligible, full-text versions<br />
of the papers in which they had been reported were<br />
retrieved. We crosschecked the references.<br />
Study selection<br />
Two reviewers (WL and AvR) independently evaluated the<br />
obtained literature for relevance. Studies were included if<br />
they met the following criteria: (1) prospective (data<br />
collection) study design; (2) CT and/or US criteria for the<br />
presence of diverticulitis were given; (3) graded compression<br />
US was performed; (4) reference standard was defined;<br />
(5) diverticulitis was located in the large bowel; (6) the<br />
number of true positives (TP), true negatives (TN), false<br />
positives (FP) and false negatives (FN) was reported or<br />
could be extracted from the study report.<br />
Study and patient characteristics<br />
2499<br />
Two reviewers independently evaluated the included<br />
studies and extracted the data for each included study.<br />
Disagreement between the reviewers was solved by<br />
discussion among all authors. Data on study design and<br />
patient group, technical specifications, and diagnostic<br />
accuracy of CT and US were collected using a standardised<br />
case record form for each included study.<br />
Study design characteristics The ‘Quality assessment for<br />
diagnostic accuracy studies’ (QUADAS) tool was used<br />
for evaluation of study quality [8]. In addition to the<br />
inclusion criteria the following characteristics were<br />
recorded: (1) department of the first author; (2) design<br />
of the study (single- or multicentre); (3) description of<br />
patient population, including sample size, age, malefemale<br />
distribution, the prevalence of ACD and complicated<br />
ACD, and study setting (hospitalised patients,<br />
outpatients or in-hospital referrals to the radiology<br />
department); (4) if US and CT results were independently<br />
obtained (head-to-head comparative studies); (5) if US<br />
and CT were interpreted independently from clinical<br />
information; (6) if a description of US and CT criteria for<br />
the presence of acute diverticulitis was given; (7)<br />
experience of observers; (8) time interval between US<br />
and CT (head-to-head comparative studies); (9) time<br />
interval between imaging and reference standard; (10) if<br />
interpretation of reference standard was done without<br />
information on US and CT findings; (11) if the execution<br />
of the reference standard was described. If multiple<br />
reference standards had been used, we tried to extract<br />
data on the number of patients undergoing each standard<br />
and the selection criteria.<br />
US characteristics Recorded were, if available: (1) type of<br />
probe; (2) frequency of probe; (3) type of scanning<br />
(conventional grey scale, pulsed, colour or power Doppler,<br />
graded compression); (4) criteria for the presence of ACD.<br />
CT characteristics The following CT features, if available,<br />
were recorded: (1) type of scanner [non-helical, helical
2500<br />
(single- or multislice CT)]; (2) slice thickness or collimation<br />
used; (3) use of contrast agents (oral, intravenous and/<br />
or rectal contrast) and, if so, the amount; (4) criteria for the<br />
presence of ACD.<br />
Data synthesis and analysis<br />
We constructed a 2×2 contingency table for US and CT<br />
compared to the reference standard. From these raw data<br />
we calculated sensitivity as TP/(FN + TP) and specificity as<br />
TN/(FP + TN) for each modality in every included study.<br />
Individual study sensitivity and specificity results were<br />
plotted in a forest plot and plot in a receiver-operating<br />
characteristics (ROC) space to explore inter-study heterogeneity<br />
in test performance. The Cochran Q-test and I 2 -test<br />
statistics were used to statistically detect and quantify<br />
heterogeneity. The Q-test examines the null hypothesis that<br />
the results of the investigated studies are homogeneous. A<br />
statistically significant result of the Q-test, with a p-value<br />
less than 0.05, was assumed to indicate substantial<br />
heterogeneity. For quantification of heterogeneity the I 2 -<br />
test statistic with 95% confidence intervals was used. The<br />
I 2 -test is a measure of inconsistency describing the<br />
percentage of total variation across studies that is due to<br />
heterogeneity rather than chance. This statistic is a<br />
percentage, with larger percentages indicating more heterogeneity<br />
[9, 10].<br />
Several statistical models (random, fixed, or mixed<br />
effects models) are available when performing a metaanalysis.<br />
The Akaike Information Criterion value [11], a<br />
global measure of goodness of fit of a statistical model,<br />
was used to compare the fit of each available model. It<br />
showed that the bivariate random effects model had the<br />
best fit and this model was therefore used for metaanalysis.<br />
The bivariate random effects model [12, 13]<br />
will produce a weighted average of sensitivity and<br />
specificity (also called the mean summary estimates of<br />
sensitivity and specificity) with corresponding confidence<br />
intervals based on the individual study results. In<br />
the bivariate random effects model, the logit-transformed<br />
sensitivities and logit-transformed specificities are assumed<br />
to follow a bivariate normal distribution across<br />
studies around a mean logit-sensitivity and mean logitspecificity.<br />
The mean logit-sensitivity and mean logitspecificity<br />
and the corresponding standard errors were<br />
used to obtain the summary estimates of sensitivity and<br />
specificity with corresponding confidence intervals after<br />
antilogit transformation. The summary estimates of<br />
sensitivity and specificity were used to calculate the<br />
positive summary likelihood ratio (LR+) as (sensitivity/1-specificity)<br />
and the negative summary likelihood<br />
ratio (LR-) as (1-sensitivity/specificity). Summary likelihood<br />
ratios were calculated with corresponding confidence<br />
intervals for each imaging modality. The LR+ is<br />
the ratio of the percentage of patients with ACD and a<br />
positive test result and the percentage of patients without<br />
ACD with a positive test result. A diagnostic test with a<br />
LR+ of 10 and a LR- of 0.01 is generally considered as a<br />
test with good diagnostic performance.<br />
Identification of alternative diagnoses<br />
The number of patients with an alternative diagnosis in<br />
each study will be recorded. The number of these<br />
alternative diagnoses that were detected by US and/or<br />
CT will be used to calculate and compare the sensitivity<br />
for the identification of alternative diagnosis of both<br />
investigations.<br />
Head-to-head comparative studies<br />
Due to the superiority in methodology, we will highlight<br />
the results of the head-to-head comparative studies in our<br />
results. In these studies data regarding the ability of both<br />
investigations to detect the same radiological abnormalities<br />
will be extracted. The agreement between US and CT<br />
findings, for example for the detection of peri-colic fat<br />
inflammation, will be expressed as the kappa statistic.<br />
According to Landis and Koch [14] kappa (κ) values can<br />
be divided into the following levels of agreement, κ
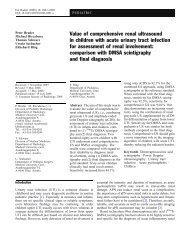
Medline, Embase,<br />
Cinahl<br />
n= 1689<br />
Potentially<br />
relevant<br />
n= 26<br />
Included for metaanalysis<br />
n= 12<br />
Study characteristics<br />
Excluded based<br />
on title and<br />
abstract<br />
n= 1663<br />
Not eligible<br />
n= 14<br />
Fig. 1 Flow chart of search strategy and study selection<br />
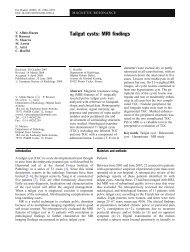
Study quality assessment using the QUADAS tool revealed<br />
a number of methodological shortcomings. Although all<br />
studies investigated patients with suspected ACD, specific<br />
inclusion criteria were defined in only 50% of studies<br />
(QUADAS question 2). The time interval between<br />
execution of the reference standard and the index tests<br />
was unclear in nearly all studies (QUADAS question 4). A<br />
vague description of the execution of the reference standard<br />
was given in slightly more then half of the studies<br />
(QUADAS question 8b). Some studies, for example, did<br />
not report on the length of follow-up in conservatively<br />
treated patients. Three US studies [29–31] defined the<br />
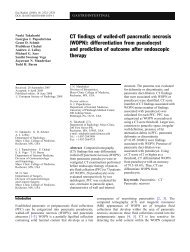
Fig. 2 The QUADAS scores of<br />
the included studies are summed<br />
up per item and presented in a<br />
bar chart<br />
1. Representative population<br />
2. Selection criteria specified<br />
3. Accurate verification<br />
4. Time interval verification<br />
5. Complete sample verification<br />
6. Uniform verification<br />
7. Reference standard independent of the test result<br />
8a. Description of the test<br />
8b. Description of the reference standard<br />
9a. Test interpreted without the reference standard<br />
9b. Reference standard interpreted without test result<br />
10. Clinical data available at test evaluation<br />
11. Uninterpretable test results reported<br />
12. Study withdrawals reported<br />
13. Data collection after research question<br />
reference standard only for the patients with ACD as<br />
reference diagnosis (QUADAS question 5). The methods<br />
of two of these three studies report that for the verification<br />
of the test results all available clinical data, laboratory and<br />
radiological investigations, and operative and histology<br />
reports were used. However, in their results they do not<br />
provide the type of verification for patients with a final<br />
diagnosis other than diverticulitis. In all studies the index<br />
test results were incorporated in the reference standard<br />
(QUADAS question 9b). Only one study [31] reported its<br />
inconclusive test results (QUADAS question 11). Severe<br />
abdominal pain, too much bowel gas, and too much<br />
abdominal fat were the reasons given for six inconclusive<br />
US results. For QUADAS questions 3, 4 and 10 the<br />
underreporting of methodological details resulted in a high<br />
percentage of “unclear” responses. Figure 2 shows the<br />
responses to each question of the QUADAS tool. Based on<br />
this assessment we conclude that the overall study quality<br />
is moderate (but not poor) and that methodological study<br />
details were often underreported. In the appendix the<br />
QUADAS items are reported in detail.<br />
Other study design characteristics<br />
All studies were single-centre studies initiated by the<br />
departments of radiology (n=8), surgery (n=3), or internal<br />
medicine (n=1). Two studies were methodologically<br />
superior to the other studies since they had performed a<br />
head-to-head comparative study of US and CT [32, 33],<br />
while the other ten studies investigated the diagnostic<br />
accuracy of one investigation only (4 US, 6 CT) [28–31,<br />
34–40]. Study characteristics are presented in Table 1.<br />
The mean age of the patients in the included studies was<br />
61 years for US and 63 years for CT. The total number of<br />
included patients was 630 for US and 684 for CT.<br />
Prevalence of ACD varied in both US and CT studies,<br />
ranging from 36% to 68%. The mean prevalence of<br />
0% 20% 40% 60% 80% 100%<br />
Percentage of studies<br />
Yes<br />
Unclear<br />
No<br />
2501
2502<br />
Table 1 Study characteristics<br />
Study/year Country No. of Inclusion criteria Reference standard<br />
patients<br />
(no. of patients)<br />
complicated ACD was not significantly different, 22% in<br />
US studies and 24% in CT studies. Other patient population<br />
characteristics are presented in Table 2.<br />
Different types of reference standards were applied,<br />
including surgery combined with histopathology, clinical<br />
follow-up, and other diagnostic investigations, such as<br />
barium enema and endoscopy. The number of patients<br />
undergoing each type of reference standard is summarised<br />
in Table 1. Most patients (n=555) had been treated<br />
conservatively, and clinical follow-up was applied as the<br />
Observer<br />
experience<br />
Ultrasound<br />
Verbanck, 1989 a [30] Belgium 123 Suspected d<br />
Surgery e (10), endoscopy (5), Not specified<br />
contrast enema (43)<br />
Schwerk, 1993 a [29] Germany 161 Suspected d<br />
Surgery e (24), clinical<br />
follow-up f (50)<br />
Experienced g<br />
Zielke, 1997 a [31] Germany 143 Suspected d<br />
Surgery e (32), clinical<br />
follow-up f (42)<br />
> 3 months h<br />
Garcia-Aguayo, 2002 [34] Spain 76 Pain in LLQ with fever Surgery<br />
and/or leucocytosis<br />
e (10), clinical<br />
follow-up f Experienced<br />
(66)<br />
g<br />
Computed tomography<br />
Cho, 1990 [35] USA 56 Pain in LLQ with fever Surgery<br />
and/or leucocytosis<br />
e (22), clinical<br />
follow-up f Not specified<br />
(34)<br />
Doringer, 1990 [36] Germany 33 Lower abdominal pain, Surgery<br />
leucocytosis and an<br />
elevated sedimentation rate<br />
e (9), clinical<br />
follow-up f Not specified<br />
(24)<br />
Stefansson, 1997 [37] Sweden 88 Pain in LLQ or lower Surgery<br />
abdomen<br />
e (30), clinical<br />
follow-up f Experienced<br />
(58)<br />
l<br />
Rao, 1998 [38] USA 150 Suspected d<br />
Histopathology b (41),<br />
clinical follow-up i Staff member or<br />
(109) fellow j<br />
Werner, 2003 [39] Germany 120 Suspected d<br />
Surgery e (49), clinical<br />
follow-up k (71)<br />
Experienced l<br />
Tack, 2005 [40] Belgium 110 Pain in LLQ
Table 2 Patient characteristics<br />
Study/year No. of Clinical<br />
patients setting<br />
but was judged as a negative test result in four other studies<br />
if the presence of diverticula was not additionally visualised.<br />
The diagnostic criteria for the presence of ACD as<br />
well as other characteristics of US and CT are presented in<br />
Tables 3, 4 and 5. Multi-slice helical CT was used in four<br />
CT studies, single-slice helical CT in one and conventional<br />
CT in three. The use of contrast agents, slice thickness and<br />
Women (%) a Mean age (range) c Prevalence % (n) d Complicated<br />
diverticulitis % e<br />
Ultrasound<br />
Verbanck, 1989 [30] 123 N.A. f<br />
N.A N.A 43 (52) 16 (8/52)<br />
Schwerk, 1993 [29] 161 N.A. f<br />
52 57 (22–88) g<br />
46 (74) 27 (20/74)<br />
Zielke, 1997 [31] 143 Hospitalised 55 56 (20–89) 52 (74) 15 (11/74)<br />
Garcia-Aguayo, 2002 [34] 76 N.A. f<br />
Computed tomography<br />
47 58 (24–83) 68 (52) 10 (5/52)<br />
Cho, 1990 [35] 56 Hospitalised 66 63 (28–98) 48 (27) 60 (16/27)<br />
Doringer, 1990 [36] 33 N.A. f<br />
60 71 (40–84) 64 (21) 10 (2/21)<br />
Stefansson, 1997 [37] 88 N.A. f<br />
72 63 (29–91) g<br />
59 (52) 12 (6/52)<br />
Rao, 1998 [38] 150 Emergency dept. b 61 59 (19–92) 43 (64) 20 (13/64)<br />
Werner, 2003 [39] 120 N.A. f<br />
54 62 (21–88) 56 (67) 16 (11/67)<br />
Tack, 2005 [40] 110 N.A. f<br />
Ultrasound vs. Computed tomography<br />
64 57 (30–82) 36 (39) 36 (14/39)<br />
Pradel, 1997 [32] 64 N.A. f<br />
N.A. 64 (38–87) 52 (33) 27 (9/33)<br />
Farag Soliman, 2004 [33] 63 Hospitalised N.A. 61.8 e<br />
N.A. not available<br />
a<br />
Percentage of women included<br />
68 (43) 47 (20/43)<br />
b<br />
Patients suspected of divertulitis at the emergency department<br />
c<br />
Mean age and range between parenthesis<br />
d<br />
Prevalence of diverticulitis as diagnosed by reference standard<br />
e<br />
Percentage of complicated diverticulits on all patients with diverticulitis<br />
f<br />
Clinical setting not specified<br />
g<br />
Median age instead of mean age<br />
interval differed among studies. Intravenous and rectal<br />
contrast was administered in the majority of CT studies.<br />
The two head-to-head comparative studies in our metaanalysis<br />
performed US and CT blinded to each others result<br />
and within 24 h of each other. Similar US and CT criteria<br />
for the presence of ACD were used.<br />
Table 3 US features in the included studies<br />
Study/year Type of probe Probe frequency (MHz) Type of scanning Diagnostic criteria for diverticulitis<br />
Verbanck, 1989 [30] Linear and curved 3.5–5 Graded compression Bowel wall thickening a<br />
Schwerk, 1993 [29] Linear and curved 5 Graded compression Peri-colic fat inflammation<br />
with bowel wall thickening b<br />
Zielke, 1997 [31] Linear and curved 3.5–5 Graded compression Bowel wall thickening b with<br />
decreased peristalsis<br />
Pradel, 1997 [32] Linear and curved 5–10 and 2–4 Graded compression Peri-colic fat inflammation<br />
with bowel wall thickening b<br />
Garcia-Aguayo, 2002 [34] Linear and curved 3.7–7.5 and 3.7–7.5 Graded compression Peri-colic fat inflammation<br />
with bowel wall thickening b<br />
Farag Soliman, 2004 [33] Linear and curved 6–10 and 3.5–6 Graded compression Peri-colic fat inflammation<br />
with bowel wall thickening b<br />
N.A. not available<br />
a >4 mm at least 5 cm long<br />
b >4–5 mm<br />
2503
2504<br />
Table 4 CT features in the included studies<br />
Study/year Type of<br />
scanner<br />
Sensitivity and specificity<br />
CT protocol, slice<br />
thickness/interval<br />
Inter-study heterogeneity in diagnostic performance is<br />
shownintheROCplot(Fig.3). Individual sensitivities<br />
and specificities with corresponding confidence intervals<br />
of US and CT with the results of the Q- and I 2 -test are<br />
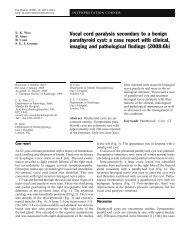
presented in Figs. 4 and 5. Mean summary sensitivity<br />
estimates of US and CT were not significantly different:<br />
92% (95% CI: 80% to 97%) for US versus 94% (95%<br />
CI: 87% to 97%) for CT (p=0.65). Mean summary<br />
specificity estimates were 90% (95% CI: 82% to 95%)<br />
for US and 99% (95% CI: 90% to 100%) for CT and<br />
not significantly different (p=0.07).<br />
Using the Q-test, we found significant heterogeneity in<br />
both the sensitivities and the specificities of US and CT<br />
studies. The I 2 for the sensitivities of US was 57% (95%<br />
CI: 0% to 83%) and for the specificities 64% (95%CI: 13%<br />
to 85%). In Fig. 4 one outlying sensitivity value of CT [37]<br />
Contrast agents (amount) Diagnostic criteria for diverticulitis<br />
Cho, 1990 [35] Non-helical Lower abdomen: 10×10 mm a<br />
I.v. in 50% of patients Peri-colic fat inflammation with bowel<br />
wall thickening b<br />
Standard oral and rectal<br />
contrast<br />
Air insufflation in 77%<br />
of patients<br />
Doringer, 1990 Non-helical N.A. I.v. and rectal<br />
Peri-colic fat inflammation with bowel<br />
[36]<br />
(not specified)<br />
wall thickening b and diverticula<br />
Pradel, 1997 [32] Non-helical Upper abdomen: 8×12–16 mm Intravenous in 88%<br />
patients (2 l/kg)<br />
Bowel wall thickening b or diverticula<br />
with either peri-colic fat inflammation<br />
or abscess<br />
Lower abdomen: 8×8 mm Oral in 64% of patients<br />
(800 mL) c<br />
Stefansson, 1997 Helical, Upper abdomen: 8×12 mm I.v. (100 ml) Peri-colic fat inflammation with bowel<br />
[37]<br />
multi-slice<br />
wall thickening b and diverticula<br />
Lower abdomen: 8×8 mm Oral (800 ml)<br />
Rectal air insufflation<br />
Rao, 1998 [38] Helical Abdominal: 5×7.5 mm I.v. in 2% of patients Peri-colic fat inflammation with bowel<br />
wall thickening b Rectal (1000 ml)<br />
and diverticula<br />
Werner, 2003 [39] Helical, Pelvic floor to lower liver edge: I.v. (1.3 ml/kg) Peri-colic fat inflammation with bowel<br />
multi-slice 4×2.5 mm<br />
wall thickening b Rectal (1000 ml)<br />
and diverticula<br />
Farag Soliman, Helical, Abdominal: 5×7 mm and I.v. (100 ml) Rectal (1000 ml) Peri-colic fat inflammation with bowel<br />
2004 [33] multi-slice 5×5 mm<br />
wall thickening b<br />
Tack, 2005 [40] Helical, Abdominal: 4×2.5 mm I.v. (120 ml) Peri-colic fat inflammation with bowel<br />
multi-slice<br />
wall thickening b<br />
N.A. not available<br />
a<br />
Without signs of ACD in the lower abdomen scanning was proceeded to the upper abdomen<br />
b<br />
>4–5 mm<br />
c<br />
Rectal air or contrast was used when standard CT was not satisfactory<br />
and two outlying specificity values [32, 36] responsible for<br />
the heterogeneity are easy to identify. The low sensitivity of<br />
CT reported by Stefansson was possibly due to a diagnostic<br />
laparoscopy rate of 38% in the patients with diverticulitis<br />
as these laparoscopies revealed false-negative CT results.<br />
These diagnostic laparoscopies were performed routinely<br />
as part of the study in the second half of the study<br />
period. Removal of the outliers reduced the I 2 percentage<br />
from 76% (95% CI: 52% to 88%) to 0% (95% CI: 0% to<br />
79%) for the sensitivities of the CT studies and from<br />
73% (95% CI: 44% to 87%) to 0% (95% CI: 0% to<br />
79%) for the specificities of the CT studies. Disregarding<br />
the outliers resulted in a summary sensitivity estimate for<br />
CT of 96% (95%CI: 92% to 98%) and a summary<br />
specificity estimate of 99% (95%CI: 97% to 100%). In<br />
other words, the observed heterogeneity in CT results<br />
had no significant influence on the summary estimates of<br />
CT accuracy.
Table 5 Test accuracy of US studies<br />
Study/year Patients<br />
with<br />
diverticulitis<br />
Although the Verbanck study (ref) used barium enema as<br />
a reference standard, it did not result in an outlying<br />
sensitivity and specificity of US. Excluding this study from<br />
the meta-analysis would not significantly change the<br />
summary estimates and would result in a summary<br />
sensitivity estimate for US of 93% (95% CI: 79% to<br />
98%) and summary specificity for US of 92% (95% CI:<br />
88% to 95%).<br />
Likelihood ratio<br />
Calculated summary LR+ were 9.63 (95% CI: 4.98 to<br />
18.62) for US and 78.41 (95% CI: 8.70 to 706.58) for CT<br />
(p=0.07). Calculated summary LR- were 0.09 (95% CI:<br />
0.04 to 0.23) for US and 0.06 (95% CI: 0.03 to 0.13) for CT<br />
(p=0.53).<br />
Identification of alternative diseases<br />
Patients<br />
without<br />
diverticulitis<br />
TP FN TN FP<br />
Eight of the 12 studies reported on the sensitivity for the<br />
identification of alternative diseases. This sensitivity<br />
Sensitivity a<br />
Specificity a<br />
Positive likelihood<br />
ratio a<br />
ranged between 33% and 78% for the US studies and<br />
between 50% and 100% for the CT studies. Table 6<br />
presents the sensitivities for alternative diseases for the US<br />
and CT studies.<br />
Head-to-head comparative studies<br />
Negative likelihood<br />
ratio a<br />
Ultrasound<br />
Verbanck, 1989 [30] 44 8 57 14 0.85 (44/52) 0.80 (57/71) 4.3 (0.85/0.20) 0.19 (0.15/0.80)<br />
Schwerk, 1993 [29] 73 1 84 3 0.99 (73/74) 0.97 (84/87) 28.6 (0.99/0.03) 0.01 (0.01/0.97)<br />
Zielke, 1997 [31] 62 12 64 5 0.84 (62/74) 0.93 (64/69) 11.6 (0.84/0.07) 0.17 (0.16/0.93)<br />
Pradel, 1997 [32] 28 5 26 5 0.85 (28/33) 0.84 (26/31) 5.3 (0.85/0.16) 0.18 (0.15/0.84)<br />
Garcia-Aguayo, 2002 [34] 42 10 19 5 0.81 (42/52) 0.79 (42/52) 3.9 (0.81/0.20) 0.24 (0.19/0.79)<br />
Farag Soliman, 2004 [33] 43 0 20 0 1.00 (43/43) 1.00 (43/43) N.A. N.A.<br />
Summary estimate (95%CI) b<br />
0.92 (80–97) 0.90 (82–95)<br />
Summary likelihood ratio (95%CI) b<br />
9.6 (5.0–18.6) 0.09 (0.04–0.23)<br />
Computed tomography<br />
Cho, 1990 [35] 25 2 29 0 0.93 (25/27) 1.00 (29/29) N.A. 0.07 (0.07/1.00)<br />
Doringer, 1990 [36] 20 1 9 3 0.95 (20/21) 0.75 (9/12) 3.8 (0.95/0.25) 0.06 (0.05/0.75)<br />
Pradel, 1997 [32] 30 3 24 7 0.91 (30/33) 0.77 (24/31) 4.0 (0.91/0.23) 0.12 (0.09/0.77)<br />
Stefansson, 1997 [37] 36 16 36 0 0.69 (36/52) 1.00 (36/36) N.A. 0.31 (0.31/1.00)<br />
Rao, 1998 [38] 62 2 86 0 0.97 (62/64) 1.00 (86/86) N.A. 0.03 (0.03/1.00)<br />
Werner, 2003 [39] 65 2 52 1 0.97 (65/67) 0.98 (52/53) 51.4 (0.97/0.02) 0.03 (0.03/0.98)<br />
Farag Soliman, 2004 [33] 42 1 20 0 0.98 (42/43) 1.00 (20/20) N.A. 0.02 (0.02/1.00)<br />
Tack, 2005 [40] 36 3 70 1 0.92 (36/39) 0.99 (70/71) 65.5 (0.92/0.01) 0.08 (0.08/0.99)<br />
Summary estimate (95% CI) b<br />
0.94 (87–97) 0.99 (90–100)<br />
Summary likelihood ratio (95% CI) b<br />
N.A. not available<br />
78.4 (8.7–706.6) 0.06 (0.03–0.13)<br />
a<br />
Individual study sensitivity, specificity and the likelihoodratios were calculated from the raw data of the individual studies<br />
b<br />
Mean summary estimates of sensitivity, specificity and the summary likelihood ratios were calculated from the results of the bivariate<br />
random effects analysis<br />
2505<br />
Although the head-to-head comparative studies did not<br />
report a significant difference between the accuracy of US<br />
and CT, there was a difference in their individual accuracy<br />
results. Farag Soliman et al. [33] reported higher<br />
sensitivities (100% for US and 98% for CT) and<br />
specificities (100% for both US and CT) compared to the<br />
sensitivities (85% for US and 91% for CT) and specificities<br />
(84% for US and 77% for CT) of Pradel et al. [32]. The<br />
study by Farag Soliman et al. merely included hospitalised<br />
patients, in contrast to the study by Pradel et al. in which all<br />
patients with suspected ACD referred for US or CT were<br />
included. The percentage of complicated ACD was 47% in<br />
the study by Farag Soliman et al. compared to 27% in the<br />
study by Pradel et al. The difference in clinical setting and<br />
spectrum of disease could be the cause of differences in
2506<br />
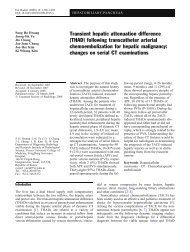
True positive rate (sensitivity)<br />
1<br />
0.8<br />
0.6<br />
0.4<br />
0.2<br />
reported accuracy values. Pradel et al. report good kappa<br />
agreement between US and CT findings. Kappa agreement<br />
was good for depicting peri-colic fat inflammation (κ=<br />
0.78), good for depicting bowel wall thickening (κ=0.69),<br />
and good for depicting peri-colic abscesses (κ=0.69).<br />
Discussion<br />
Ultrasound<br />
0<br />
0 0.2 0.4 0.6 0.8 1<br />
False positive rate (1-specificity)<br />
Computed tomography<br />
Fig. 3 Sensitivity and 1-specificity for US results (open square) and<br />
for CT results (closed triangle) per included study are shown in a<br />
ROC plot. For the two head-to-head comparative studies the open<br />
squares and closed triangles represent the individual results of the<br />
head-to-head comparative studies and are connected by a line. This<br />
is visible for only one pair; the other paired data points are located in<br />
the upper left corner in the ROC plot<br />
In this systematic review we found that diagnostic<br />
studies of US and CT in patients suspected of ACD are<br />
of moderate quality. No significant differences in the<br />
diagnostic accuracy of US and CT in diagnosing ACD<br />
were found. Calculated sensitivities, specificities, positive<br />
and negative likelihood ratios were all higher for<br />
CT, but none of these differences were significant. The<br />
range of the sensitivities for the identification of<br />
alternative diagnoses was higher for CT than US,<br />
suggesting that CT is more accurate for detecting<br />
alternative diagnoses.<br />
Although the two head-to-head comparative studies<br />
found different accuracy values for US and CT, they both<br />
concluded that the accuracy of US and CT was not<br />
significantly different. These two studies with the best<br />
methodological design, providing approximately 20% of<br />
our study population, support the result of our overall metaanalysis<br />
[32, 33].<br />
Heterogeneous results, reported by studies investigating<br />
the same effect, can lead to inaccurate and<br />
irrelevant summary point estimates when pooled for<br />
meta-analysis. For this reason we explored heterogeneity<br />
in the US and CT study results. In the US studies<br />
the heterogeneity was slightly above 50%, which can<br />
be considered as moderate heterogeneity [9], allowing<br />
the pooling of these results [9]. Although we found<br />
heterogeneity in CT study results [32, 36, 37], resulting<br />
in high I 2 values, exploring this heterogeneity showed<br />
that it did not influence the summary estimates of CT<br />
significantly.<br />
The studies investigating the diagnostic accuracy of<br />
US and CT in ACD were susceptible to bias because<br />
they applied differential verification. With US and CT<br />
results being part of the reference standards, an<br />
incorporation bias could lead to over-estimation of the<br />
diagnostic accuracy. Unlike histopathology, clinical<br />
follow-up is a reference standard open to subjective<br />
interpretation and is less likely to identify the correct<br />
reference diagnosis. Using a reference standard that is<br />
open to subjective interpretation can enhance the effect<br />
of over-estimation [41]. For example, a patient with a<br />
US *<br />
CT †<br />
Verbanck, 1989<br />
Schwerk, 1993<br />
Zielke, 1997<br />
Pradel, 1997<br />
Garcia-Aguayo, 2002<br />
Farag Soliman, 2004<br />
Summary sensitivity (US)<br />
Cho, 1990<br />
Doringer, 1990<br />
Pradel, 1997<br />
Stefansson, 1997<br />
Rao, 1998<br />
Werner, 2003<br />
Farag Soliman, 2004<br />
Tack, 2005<br />
Summary sensitivity (CT)<br />
0.0 0.2 0.4 0.6 0.8 1.0<br />
Sensitivity<br />
* Q-test of US sensitivities: 11.7 (p=0.04, Df=5), I 2 = 57% (95%CI: 0%-83%)<br />
† Q-test of CT sensivitities: 29 (p=0.001, Df= 7), I 2 = 76% (95%CI: 52%-82%)<br />
Fig. 4 Individual sensitivities and the summary sensitivity estimates<br />
of US and CT studies are shown with their corresponding 95%<br />
confidence intervals. Heterogeneity between study results is<br />
presented in the footnotes
US *<br />
CT †<br />
Verbanck, 1989<br />
Schwerk, 1993<br />
Zielke, 1997<br />
Pradel, 1997<br />
Garcia-Aguayo, 2002<br />
Farag Soliman, 2004<br />
Summary specificity (US)<br />
Cho, 1990<br />
Doringer, 1990<br />
Pradel, 1997<br />
Stefansson, 1997<br />
Rao, 1998<br />
Werner, 2003<br />
Farag Soliman, 2004<br />
Tack, 2005<br />
Summary specificity (CT)<br />
0.0 0.2 0.4 0.6 0.8 1.0<br />
Specificity<br />
* 2<br />
Q-test of US specificities: 13.9 (p=0.02, Df=5), I = 64% (95%CI: 13%-85%)<br />
† 2<br />
Q-test of CT specificities: 25.6 (p
2508<br />
studies were performed. In the unpaired data betweenstudy<br />
heterogeneity, i.e., between US and CT studies, is<br />
not to be avoided. In our results the between-study<br />
heterogeneity and methodological shortcomings in regard to<br />
patient selection, reference standard, experience of observer,<br />
imaging technique, and test interpretation are clearly<br />
presented. Facing heterogeneity and methodological shortcomings<br />
is almost inevitable when performing a metaanalysis<br />
of diagnostic accuracy studies. We reported and<br />
explored this in our results. For example, we reported on<br />
heterogeneity in patient selection, but exploration showed<br />
that the prevalence of ACD and complicated ACD nevertheless<br />
was comparable between US and CT populations.<br />
Complete reporting of all study characteristics and methodological<br />
shortcomings facilitates valid interpretation of the<br />
result of our meta-analysis.<br />
Reporting proper methodological details in diagnostic<br />
studies is a known problem. Without these details on<br />
methodology, results of studies reporting on diagnostic<br />
performance are hard to interpret. This error in reporting<br />
was also detected in some of the included studies during<br />
quality assessment using the QUADAS tool. Attempts are<br />
made to improve methodological reporting of diagnostic<br />
test accuracy studies with the Standards for Reporting of<br />
Diagnostic Accuracy (STARD) [42]. The STARD initiative<br />
provides a checklist with items that should be included in<br />
the report of a study of diagnostic accuracy.<br />
We tried to minimise bias in our meta-analysis by using<br />
two independent reviewers for data extraction, using<br />
specified inclusion criteria, and exploring heterogeneity<br />
between and within studies.<br />
Two surveys conducted under surgeons from the UK<br />
and the USA [3, 4] showed that the daily use of<br />
diagnostics in patients suspected of ACD varied<br />
significantly. Of the questioned surgeons from the UK<br />
who found imaging necessary at initial assessment, 42%<br />
favoured CT and 33% favoured US. In contrast, twothirds<br />
of the questioned surgeons from the USA<br />
favoured CT and less than 7% favoured US. So where<br />
US is used as a competitive initial diagnostic test in the<br />
UK, it seems that in the USA less value is rewarded to<br />
the diagnostic opportunities of US. This is illustrated by<br />
the appropriateness criteria for imaging in patients with<br />
left lower quadrant pain of the American College of<br />
Radiology [5], which state that CT is more appropriate<br />
than US, especially in older patients with a typical<br />
presentation of ACD. This preference for CT in the<br />
USA is reflected in this meta-analysis. All US studies in<br />
this meta-analysis concerned European studies, while<br />
CT studies originated both from the USA and Europe.<br />
In countries with a high prevalence of obesity<br />
physicians will favour CT, since the use of US is<br />
practically inappropriate in obese patients. With US<br />
being less frequently used in the USA, the performance<br />
of US by radiologists from the USA for the diagnosis of<br />
ACD might be lower. The preference for CT of many<br />
physicians is also based on the fact that CT is often<br />
regarded as a more credible test than US for the<br />
exclusion and identification of alternative diagnosis.<br />
The range of sensitivity for the identification of<br />
alternative diagnosis for CT and US shows that this is<br />
probably true. Unfortunately, the included study did not<br />
provide data that made it possible to compare the ability<br />
of US and CT to exclude alternative diagnoses.<br />
The use of magnetic resonance colonography for the<br />
diagnosis of ACD was investigated by Ajaj et al. [43]. This<br />
feasibility study reported a promising sensitivity of 86% and<br />
specificity of 92%. Although magnetic resonance colonography<br />
is not yet routinely applied in the acute setting in<br />
patients suspected of ACD in daily practice, the accuracy<br />
results seem promising and feasibility of this modality in the<br />
diagnostic work-up of these patients deserves attention.<br />
The practice parameters from 2006 by the American<br />
Society of Colon and Rectal Surgery [44] also advocate the<br />
use of CT in diagnosing ACD. They state that US can<br />
sometimes be useful to differentiate between a phlegmon and<br />
an abscess in ACD, but that US findings are often obscured<br />
by overlying bowel loops. Our study recorded only few<br />
inconclusive US investigations. Graded compression US<br />
possibly reduces the number of inconclusive findings due to<br />
overlying bowel loops. The two head-to-head comparative<br />
studies we included both used the same US and CT criteria<br />
for the presence of ACD. Their results show that next to<br />
differentiating between a phlegmon and an abscess US can<br />
accurately measure bowel wall thickness, show peri-colic fat<br />
inflammation and detect complications. Kappa agreement<br />
between US and CT findings was good for the above<br />
mentioned imaging features [32].<br />
This analysis of 16 years of published literature<br />
comprehends roughly the same amount of data for US<br />
and CT and provides detailed information on betweenstudy<br />
heterogeneity in both US and CT studies. In<br />
conclusion, diagnostic accuracy studies of US and CT in<br />
patients with suspected ACD are of moderate quality and<br />
there is a need for new methodologically solid studies. Our<br />
meta-analysis found no significant difference between the<br />
diagnostic accuracy of US and CT in diagnosing ACD. The<br />
best available evidence shows that both US and CT can be<br />
used as an initial diagnostic tool in the assessment of patients<br />
suspected of having ACD. However, in severely ill patients<br />
presenting with abdominal pain the use of CT is probably<br />
more suitable as CT images are more able than US to assist in<br />
planning of a radiological or surgical intervention, and CT<br />
images in contrast to US can be re-read at any time by any<br />
specialist involved in the treatment of severely ill patients.<br />
Moreover, reviewed data indicate that CT is more accurate<br />
for detecting alternative diagnoses than us.<br />
Open Access This article is distributed under the terms of the<br />
Creative Commons Attribution Noncommercial License which<br />
permits any noncommercial use, distribution, and reproduction in<br />
any medium, provided the original author(s) and source are credited.
Appendix<br />
Databases used<br />
– MEDLINE<br />
– EMBASE<br />
– CINAHL<br />
– Cochrane<br />
Databases NOT used<br />
– DARE (Cochrane)<br />
– SUMSEARCH/MEDSCAPE (also in Pubmed and<br />
Cochrane)<br />
Studies marked not relevant, exclusion based on title and<br />
abstract<br />
– Animal, laboratory studies<br />
– Other imaging: PET/Scintigraphy/Transvaginal US/<br />
Endoscopic ultrasonography/MRI/urography/CT colonography/enterocyclis/Barium<br />
enema/intraoperative<br />
ultrasonography<br />
– Comments/letters<br />
– Treatment, fine-needle aspiration<br />
– Case reports (
2510<br />
CINAHL: Search strategy yielded 24 articles<br />
COCHRANE<br />
[Searches Cochrane Database or Systematic Reviews (Cochrane<br />
Reviews), Database of Abstracts of Reviews of Effects (DARE), The<br />
Cochrane Central Register of Controlled Trials (CENTRAL), The<br />
Cochrane Database of Methodology Reviews (Methodology Reviews),<br />
The Cochrane Methodology Register (CMR), Health<br />
Technology Assessment Database (HTA), NHS Economic Evaluation<br />
Database (NHS EED)]<br />
AND<br />
Population “Acute diverticulitis”<br />
AND<br />
Diagnostic Ultrasonography OR Echography OR Radiography OR Computed<br />
tomography OR Computer-Assisted Tomography<br />
Search strategy Cochrane: No systematic reviews or clinical trials<br />
investigating the diagnostic accuracy of US and CT in diverticulitis<br />
were identified<br />
QUADAS questions*:<br />
(1) Was the spectrum of patients representative of the patients who will receive the test in practice?<br />
(2) Were selection criteria clearly described?<br />
(3) Is the reference standard likely to correctly classify the target condition?<br />
(4) Is the time period between surgery (histopathology) and index test short enough to be reasonably sure that the target condition did not<br />
change between the two tests?<br />
(5) Did the whole sample, or a random selection of the sample, receive verification using a reference standard of diagnosis?<br />
(6) Did patients receive the same reference standard regardless of the index test result?<br />
(7) Was the reference standard independent of the index test (i.e. the index test did not form part of the reference standard)?<br />
(8a) Was the execution of the index test described in sufficient detail to permit replication of the test?<br />
(8b) Was the execution of the reference standard described in sufficient detail to permit its replication?<br />
(9a) Were the index test results interpreted without knowledge of the results of the reference standard?<br />
(9b) Were the reference standard results interpreted without knowledge of the results of the index test?<br />
(10) Were the same clinical data available when test results were interpreted as would be available when the test is used in practice?<br />
(11) Were uninterpretable/intermediate test results reported?<br />
(12) Were withdrawals from the study explained?<br />
(13) Were the data collected after the research question was defined?<br />
*The answer can be yes, no, or unclear<br />
References<br />
1. Stollman N, Raskin JB (2004) Diverticular<br />
disease of the colon. Lancet<br />
363:631–639<br />
2. Ferzoco LB, Raptopoulos V, Silen W<br />
(1998) Acute diverticulitis. N Engl J<br />
Med 338:1521–1526<br />
3. Munikrishnan V, Helmy A, Elkhider H,<br />
Omer AA (2006) Management of<br />
Acute Diverticulitis in the East Anglian<br />
Region: Results of a United Kingdom<br />
Regional Survey. Dis Colon Rectum<br />
49:1332–1340<br />
4. Schechter S, Mulvey J, Eisenstat TE<br />
(1999) Management of Uncomplicated<br />
Acute Diverticulitis: Results of a survey.<br />
Dis Colon Rectum 42:470–476<br />
5. Balfe DM, Levine MS, Ralls PW<br />
(2000) Evaluation of left lower quadrant<br />
pain. American College of Radiology.<br />
ACR Appropriateness Criteria.<br />
Radiology 215(suppl):167–171<br />
6. Bruel JM (2003) Acute colonic diverticulitis:<br />
CT or ultrasound? Eur Radiol<br />
13:2557–2559<br />
7. Rhea JT (2000) CT evaluation of<br />
appendicitis and diverticulitis. Part II:<br />
Diverticulitis. Emergency Radiology<br />
7:237–244<br />
8. Whiting P, Rutjes AW, Reitsma JB,<br />
Bossuyt PM, Kleijnen J (2003) The<br />
development of QUADAS: a tool for<br />
the quality assessment of studies of<br />
diagnostic accuracy included in systematic<br />
reviews. BMC Medical Research<br />
Methodology 3:25<br />
9. Higgins JP, Thompson SG, Deeks JJ,<br />
Altman DG (2003) Measuring inconsistency<br />
in meta-analyses. BMJ<br />
327:557–560<br />
10. Higgins JP, Thompson SG (2002)<br />
Quantifying heterogeneity in a metaanalysis.<br />
Stat Med<br />
21:1539–1558
11. Akaike H (1974) A new look at<br />
Statistical Model Indentification. IEEE<br />
Transactions on Automatic Control<br />
19:716–723<br />
12. Reitsma JB, Glas AS, Rutjes AW,<br />
Scholten RJ, Bossuyt PM, Zwinderman<br />
AH (2005) Bivariate analysis of<br />
sensitivity and specificity produces<br />
informative summary measures in<br />
diagnostic reviews. J Clin Epidemiol<br />
58:982–990<br />
13. Harbord RM, Deeks JJ, Egger M,<br />
Whiting P, Sterne JA (2007) A unification<br />
of models for meta-analysis of<br />
diagnostic accuracy studies. Biostatistics<br />
8:239–251<br />
14. Landis JR, Koch GG (1977) The<br />
measurement of observer agreement for<br />
categorical data. Biometrics 33:159–<br />
174<br />
15. Ernst S, Wypior HJ, Stark V, Rath M<br />
(1996) [The computed tomography of<br />
acute sigmoid diverticulitis]. Rofo<br />
164:102–107<br />
16. Hulnick DH, Megibow AJ, Balthazar<br />
EJ (1984) Computed tomography in the<br />
evaluation of diverticulitis. Radiology<br />
152<br />
17. Kircher MF, Rhea JT, Kihiczak D,<br />
Novelline RA (2002) Frequency, sensitivity,<br />
and specificity of individual<br />
signs of diverticulitis on thin-section<br />
helical CT with colonic contrast material:<br />
Experience with 312 cases. Am J<br />
Roentgenol 178<br />
18. Ripolles T, Agramunt M, Martinez MJ,<br />
Costa S, Gomez-Abril SA, Richart J<br />
(2003) The role of ultrasound in the<br />
diagnosis, management and evolutive<br />
prognosis of acute left-sided colonic<br />
diverticulitis: a review of 208 patients.<br />
Eur Radiol 13:2587–2595<br />
19. Wilson SR, Toi A (1990) The value of<br />
sonography in the diagnosis of acute<br />
diverticulitis of the colon. AJR Am J<br />
Roentgenol 154:1199–1202<br />
20. Smith TR, Cho KC, Morehouse HT,<br />
Kratka PS (1990) Comparison of computed<br />
tomography and contrast enema<br />
evaluation of diverticulitis. Dis Colon<br />
Rectum 33<br />
21. Ambrosetti P, Jenny A, Becker C,<br />
Terrier F, Morel P (2000) Acute left<br />
colonic diverticulitis - Compared performance<br />
of computed tomography and<br />
water-soluble contrast enema: Prospective<br />
evaluation of 420 patients. Dis<br />
Colon Rectum. 43<br />
22. Ambrosetti P, Becker C, Terrier F<br />
(2002) Colonic diverticulitis: Impact of<br />
imaging on surgical management - A<br />
prospective study of 542 patients. Eur<br />
Radiol 12:01<br />
23. Eggesbo HB, Jacobsen T, Kolmannskog<br />
F, Bay D, Nygaard K (1998) Diagnosis<br />
of acute left-sided colonic diverticulitis<br />
by three radiological modalities. Acta<br />
Radiol 39:315–321<br />
24. Hachigian MP, Honickman S, Eisenstat<br />
TE, Rubin RJ, Salvati EP (1992)<br />
Computed tomography in the initial<br />
management of acute left-sided diverticulitis.<br />
Dis Colon Rectum 35<br />
25. Schwerk WB, Schwarz S, Rothmund M<br />
(1992) Sonography in acute colonic<br />
diverticulitis: A prospective study. Dis<br />
Colon Rectum 35<br />
26. Zielke A, Hasse C, Bandorski T, Sitter<br />
H, Wachsmuth P, Grobholz R,<br />
Rothmund M (1997) Diagnostic ultrasound<br />
of acute colonic diverticulitis by<br />
surgical residents. Surg Endosc<br />
11:1194–1197<br />
27. Hollerweger A, Macheiner P,<br />
Rettenbacher T, Brunner W, Gritzmann<br />
N (2001) Colonic diverticulitis:<br />
Diagnostic value and appearance of<br />
inflamed diverticula-sonographic<br />
evaluation. Eur Radiol 11<br />
28. Moll R, Mittelkotter U, Reith H-B,<br />
Schindler G, Thiede A (2002) Which<br />
imaging in case of sigmoid diverticulitis?<br />
The value of ultrasound (conventional<br />
B-mode in combination with<br />
hydrocolonsonography and colour flow<br />
doppler) in comparison to the wellestablished<br />
modalities like contrast<br />
enema and helical computertomography.<br />
Zent bl Chir 127<br />
29. Schwerk WB, Schwarz S, Rothmund<br />
M, Arnold R (1993) [Colon diverticulitis:<br />
imaging diagnosis with ultrasound–a<br />
prospective study].<br />
Z Gastroenterol 31:294–300<br />
30. Verbanck J, Lambrecht S, Rutgeerts L,<br />
Ghillebert G, Buyse T, Naesens M,<br />
Tytgat H (1989) Can sonography diagnose<br />
acute colonic diverticulitis in<br />
patients with acute intestinal inflammation?<br />
A prospective study. J Clin<br />
Ultrasound 17<br />
31. Zielke A, Hasse C, Nies C, Kisker O,<br />
Voss M, Sitter H, Rothmund M (1997)<br />
Prospective evaluation of ultrasonography<br />
in acute colonic diverticulitis. Br<br />
J Surg 84<br />
32. Pradel JA, Adell J-F, Taourel P, Djafari<br />
M, Monnin-Delhom E, Bruel J (1997)<br />
Acute colonic diverticulitis: Prospective<br />
comparative evaluation with US<br />
and CT. Radiology 205<br />
33. Farag SM, Wustner M, Sturm J,<br />
Werner A, Diehl SJ, Duber C, Post S<br />
(2004) Primary diagnostics of acute<br />
diverticulitis of the sigmoid. Sonography<br />
versus computed tomography: A<br />
prospective study. Ultraschall in der<br />
Med 25<br />
2511<br />
34. Garcia-Aguayo FJ, Gil PM (2002)<br />
Acute diverticulitis of the sigmoid<br />
colon: Value of ultrasound as an initial<br />
diagnostic test. Radiologia 44<br />
35. Cho KC, Morehouse HT, Alterman<br />
DD, Thornhill BA (1990) Sigmoid<br />
diverticulitis: Diagnostic role of CT -<br />
Comparison with barium enema<br />
studies. Radiology 176<br />
36. Doringer E, Ferner R (1990) CT of<br />
colonic diverticulitis. Rofo Fortschritte<br />
auf dem Gebiete der Rontgenstrahlen<br />
und der Neuen Bildgebenden Verfahren<br />
152<br />
37. Stefansson T, Nyman R, Nilsson S,<br />
Ekbom A, Pahlman L (1997) Diverticulitis<br />
of the sigmoid colon. A<br />
comparison of CT, colonic enema and<br />
laparoscopy. Acta Radiol 38:313–319<br />
38. Rao PM, Rhea JT, Novelline RA,<br />
Dobbins JM, Lawrason JN, Sacknoff R,<br />
Stuk JL (1998) Helical CT with only<br />
colonic contrast material for diagnosing<br />
diverticulitis: prospective evaluation of<br />
150 patients. AJR Am J Roentgenol<br />
170:1445–1449<br />
39. Werner A, Diehl SJ, Farag-Soliman M,<br />
Duber C (2003) Multi-slice spiral CT in<br />
routine diagnosis of suspected acute<br />
left-sided colonic diverticulitis: A prospective<br />
study of 120 patients. Eur<br />
Radiol 13<br />
40. Tack D, Bohy P, Perlot I, De M, V,<br />
Alkellani O, Sourtzis S, Gevenois PA<br />
(2005) Suspected acute colon diverticulitis:<br />
Imaging with low-dose unenhanced<br />
multi-detector row CT.<br />
Radiology 237<br />
41. Rutjes AW, Reitsma JB, Di NM, Smidt<br />
N, van Rijn JC, Bossuyt PM (2006)<br />
Evidence of bias and variation in<br />
diagnostic accuracy studies. CMAJ<br />
174:469–476<br />
42. Bossuyt PM, Reitsma JB, Bruns DE,<br />
Gatsonis CA, Glasziou PP, Irwig LM,<br />
Lijmer JG, Moher D, Rennie D, de Vet<br />
HC (2003) Towards complete and<br />
accurate reporting of studies of diagnostic<br />
accuracy: The STARD Initiative.<br />
Radiology 226:24–28<br />
43. Ajaj W, Ruehm SG, Lauenstein T,<br />
Goehde S, Kuehle C, Herborn CU,<br />
Langhorst J, Zoepf T, Gerken G, Goyen<br />
M (2005) Dark-lumen magnetic resonance<br />
colonography in patients with<br />
suspected sigmoid diverticulitis: a feasibility<br />
study. Eur Radiol 15:2316–2322<br />
44. Rafferty J, Shellito P, Hyman NH, Buie<br />
WD (2006) Practice parameters for<br />
sigmoid diverticulitis. Dis Colon<br />
Rectum 49:939–944