Lyme borreliosis in Europe: influences of climate and climate ...
Lyme borreliosis in Europe: influences of climate and climate ...
Lyme borreliosis in Europe: influences of climate and climate ...

You also want an ePaper? Increase the reach of your titles
YUMPU automatically turns print PDFs into web optimized ePapers that Google loves.
<strong>Lyme</strong> <strong>borreliosis</strong> <strong>in</strong> <strong>Europe</strong><br />
Page 18<br />
4) with, <strong>in</strong> some cases, <strong>in</strong>creased exposures <strong>of</strong> humans to ticks <strong>and</strong>, <strong>in</strong> others, decreased<br />
encounters between humans <strong>and</strong> disease vectors.<br />
5. Observed effects <strong>of</strong> recent <strong>climate</strong> variations <strong>in</strong> <strong>Europe</strong><br />
S<strong>in</strong>ce 1950, night-time temperatures (i.e. m<strong>in</strong>imum temperatures) have risen proportionally more<br />
<strong>in</strong> the northern hemisphere than daytime temperatures (Easterl<strong>in</strong>g et al., 1997; Beniston & Tol,<br />
1998; IPCC, 2001). W<strong>in</strong>ter temperatures have <strong>in</strong>creased more than other seasons, particularly at<br />
higher latitudes (Easterl<strong>in</strong>g et al., 1997; Beniston & Tol 1998). In <strong>Europe</strong>, the spr<strong>in</strong>g now starts<br />
two weeks earlier than it did before the 1980s <strong>and</strong> the length <strong>of</strong> the vegetation season has<br />
<strong>in</strong>creased (IPCC, 2001). These are all factors <strong>of</strong> importance for tick vectors <strong>and</strong> LB risk.<br />
Early signs <strong>of</strong> effects from changes <strong>in</strong> <strong>climate</strong> are more easily recognized <strong>in</strong> areas located close<br />
to the geographical distribution limits (latitud<strong>in</strong>al or altitud<strong>in</strong>al) <strong>of</strong> an organism. Latitud<strong>in</strong>al<br />
changes <strong>in</strong> tick distribution between the early 1980s <strong>and</strong> mid-1990s have been reported from<br />
northern Sweden (Jaenson et al., 1994; Tällekl<strong>in</strong>t & Jaenson, 1998), (Fig. 6). Spatial <strong>and</strong><br />
temporal analyses showed that these distribution shifts were correlated to changes <strong>in</strong> daily<br />
seasonal <strong>climate</strong> (L<strong>in</strong>dgren et al., 2000). The establishment <strong>of</strong> new tick populations at the highest<br />
latitudes was related to less severe w<strong>in</strong>ter temperatures <strong>and</strong> <strong>in</strong>creased number <strong>of</strong> days with<br />
temperatures vital for tick reproduction (i.e. >10 ºC) (L<strong>in</strong>dgren et al., 2000). Increases <strong>in</strong> tick<br />
population density <strong>in</strong> the central parts <strong>of</strong> Sweden were significantly correlated to “accumulated<br />
temperature days” that represented milder w<strong>in</strong>ters, earlier start <strong>of</strong> the tick activity period <strong>in</strong><br />
spr<strong>in</strong>g (i.e. >4 ºC), <strong>and</strong> prolonged autumn seasons over a consecutive number <strong>of</strong> years (L<strong>in</strong>dgren<br />
et al., 2000).<br />
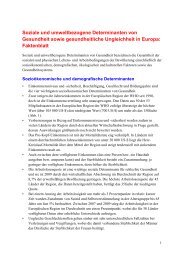
Figure 6. Differences <strong>in</strong> tick prevalence <strong>in</strong> central <strong>and</strong> northern Sweden (southern<br />
parts not <strong>in</strong>cluded).<br />
The left map illustrates conditions before 1980 <strong>and</strong> the right map illustrates tick distribution after the mid 1990s.<br />
Source: L<strong>in</strong>dgren et al., 2000.<br />
Mounta<strong>in</strong> studies on I. ric<strong>in</strong>us populations have been performed <strong>in</strong> the same locations <strong>in</strong> the<br />
Czech Republic <strong>in</strong> 1957, 1979–1980 <strong>and</strong> 2001–2002. A shift <strong>in</strong> the upper altitude boundary <strong>of</strong><br />
permanent tick population from 700 m to 1100 m a.s.l. has been observed (Daniel et al., 2003).<br />
Specifically, tick surveys (on permanently resident dogs <strong>and</strong> by flagg<strong>in</strong>g) were carried out<br />
between 2001 <strong>and</strong> 2002 at altitudes between 700 m <strong>and</strong> 1200 m a.s.l. <strong>in</strong> the Sumava mounta<strong>in</strong>s.