

Power Statistics - 2010 Edition - Full Report - Eurelectric
Power Statistics - 2010 Edition - Full Report - Eurelectric
Power Statistics - 2010 Edition - Full Report - Eurelectric

You also want an ePaper? Increase the reach of your titles
YUMPU automatically turns print PDFs into web optimized ePapers that Google loves.
Outlook up to 2030<br />
Gross domestic product trends<br />
Although economic growth is expected to resume from <strong>2010</strong><br />
onwards, the recent recession will have a long-term impact even<br />
beyond 2015. It will be difficult to recover the important losses in<br />
gross domestic product (GDP) across Europe in the near future.<br />
Average EU growth prospects for 2011 and 2012 are indicated to<br />
be around 1 %. A further increase in GDP across Europe is to be<br />
expected from 2013 onwards.<br />
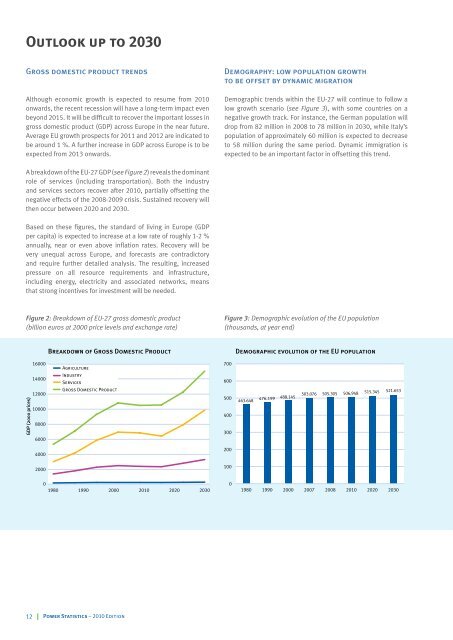
A breakdown of the EU-27 GDP (see Figure 2) reveals the dominant<br />
role of services (including transportation). Both the industry<br />
and services sectors recover after <strong>2010</strong>, partially offsetting the<br />
negative effects of the 2008-2009 crisis. Sustained recovery will<br />
then occur between 2020 and 2030.<br />
Based on these figures, the standard of living in Europe (GDP<br />
per capita) is expected to increase at a low rate of roughly 1-2 %<br />
annually, near or even above inflation rates. Recovery will be<br />
very unequal across Europe, and forecasts are contradictory<br />
and require further detailed analysis. The resulting, increased<br />
pressure on all resource requirements and infrastructure,<br />
including energy, electricity and associated networks, means<br />
that strong incentives for investment will be needed.<br />
Figure 2: Breakdown of EU-27 gross domestic product<br />
(billion euros at 2000 price levels and exchange rate)<br />
GDP (2000 prices)<br />
16000<br />
14000<br />
12000<br />
10000<br />
8000<br />
6000<br />
4000<br />
2000<br />
Breakdown of Gross Domestic Product<br />
Agriculture<br />
Industry<br />
Services<br />
Gross Domestic Product<br />
0<br />
1980 1990 2000 <strong>2010</strong> 2020 2030<br />
12 <strong>Power</strong> <strong>Statistics</strong> – <strong>2010</strong> <strong>Edition</strong><br />
Demography: low population growth<br />
to be offset by dynamic migration<br />
Demographic trends within the EU-27 will continue to follow a<br />
low growth scenario (see Figure 3), with some countries on a<br />
negative growth track. For instance, the German population will<br />
drop from 82 million in 2008 to 78 million in 2030, while Italy’s<br />
population of approximately 60 million is expected to decrease<br />
to 58 million during the same period. Dynamic immigration is<br />
expected to be an important factor in offsetting this trend.<br />
Figure 3: Demographic evolution of the EU population<br />
(thousands, at year end)<br />
700<br />
600<br />
500<br />
400<br />
300<br />
200<br />
100<br />
0<br />
Demographic evolution of the EU population<br />
463.648<br />
476.199 488.145<br />
503.076 505.305 506.948 515.345 521.653<br />
1980 1990 2000 2007 2008 <strong>2010</strong> 2020 2030


