MODELING CHAR OXIDATION AS A FUNCTION OF PRESSURE ...
MODELING CHAR OXIDATION AS A FUNCTION OF PRESSURE ...
MODELING CHAR OXIDATION AS A FUNCTION OF PRESSURE ...

You also want an ePaper? Increase the reach of your titles
YUMPU automatically turns print PDFs into web optimized ePapers that Google loves.
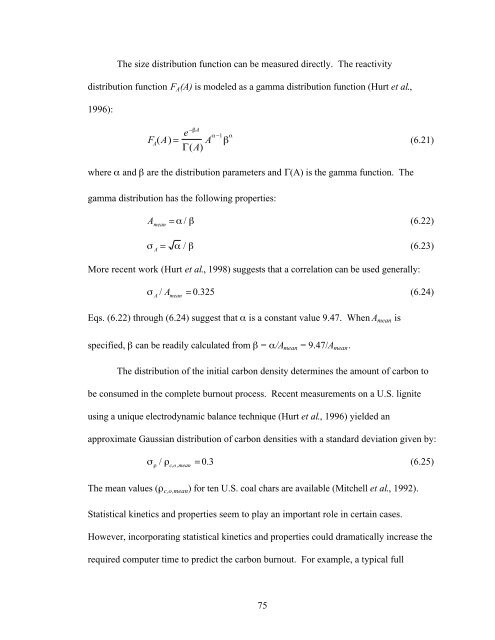
The size distribution function can be measured directly. The reactivity<br />
distribution function F A(A) is modeled as a gamma distribution function (Hurt et al.,<br />
1996):<br />
e − A<br />
−1<br />
FA(A) = A<br />
Γ(A)<br />
where and are the distribution parameters and Γ(A) is the gamma function. The<br />
gamma distribution has the following properties:<br />
75<br />
(6.21)<br />
A mean = / (6.22)<br />
A<br />
= / (6.23)<br />
More recent work (Hurt et al., 1998) suggests that a correlation can be used generally:<br />
A / A mean<br />
= 0.325 (6.24)<br />
Eqs. (6.22) through (6.24) suggest that is a constant value 9.47. When A mean is<br />
specified, can be readily calculated from = /A mean = 9.47/A mean.<br />
The distribution of the initial carbon density determines the amount of carbon to<br />
be consumed in the complete burnout process. Recent measurements on a U.S. lignite<br />
using a unique electrodynamic balance technique (Hurt et al., 1996) yielded an<br />
approximate Gaussian distribution of carbon densities with a standard deviation given by:<br />
/ c,o ,mean<br />
= 0.3 (6.25)<br />
The mean values ( c,o,mean) for ten U.S. coal chars are available (Mitchell et al., 1992).<br />
Statistical kinetics and properties seem to play an important role in certain cases.<br />
However, incorporating statistical kinetics and properties could dramatically increase the<br />
required computer time to predict the carbon burnout. For example, a typical full