Evaluation Method for Ion Migration Using Dew Cycle Test (Part 2)
Evaluation Method for Ion Migration Using Dew Cycle Test (Part 2)
Evaluation Method for Ion Migration Using Dew Cycle Test (Part 2)

You also want an ePaper? Increase the reach of your titles
YUMPU automatically turns print PDFs into web optimized ePapers that Google loves.
Report 2<br />
<strong>Evaluation</strong> <strong>Method</strong> <strong>for</strong> <strong>Ion</strong> <strong>Migration</strong><br />
<strong>Using</strong> <strong>Dew</strong> <strong>Cycle</strong> <strong>Test</strong> (<strong>Part</strong> 2)<br />
Yuuichi Aoki *1 /Hirokazu Tanaka *1 /Shigeharu Yamamoto *1 /Osamu Obata *2 /Yoshiki Saito *2<br />
<strong>Dew</strong> condensation has become a nemesis of the electronics field. It causes a<br />
number of problems, from ion migration to malfunction and breakdown of<br />
electronic equipment. Because of this, evaluation through dew cycle test has<br />
become indispensable <strong>for</strong> parts and products.<br />
In the <strong>Part</strong> 1, we reported on stability and reproducibility in dew condensing test<br />
with the dew cycle test chamber. In this report (<strong>Part</strong> 2), we shall discuss how the test<br />
chamber has made possible abruptly raising the temperature from a normal temperature<br />
range (hereafter called low temperature) to a higher range of temperature and humidity<br />
(hereafter called high temperature). The test chamber has also made possible greater<br />
fidelity in reproducing the market environment in tests.<br />
In addition, we have confirmed the relationship between the speed at which ion<br />
migration <strong>for</strong>ms and the quantity of dew condensation <strong>for</strong>ming in the test chamber when<br />
temperature and humidity conditions are changed.<br />
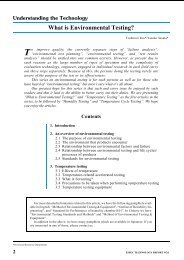
1. Introduction<br />
Currently no standardized testing method exists <strong>for</strong><br />
dew cycle test. Different companies use a variety of testing<br />
methods. The lone exception to this lack of standardization<br />
are the JASO vehicle standards, which<br />
establish that the temperature and humidity conditions<br />
in which a vehicle is operated be considered in dew condensing<br />
test. Temperature and humidity conditions need<br />
to be set in accordance with the temperature and humidity<br />
encountered in each specific field <strong>for</strong> the specimen<br />
being evaluated.<br />
Measurement can be made using one of two methods.<br />
In one, current is passed through the specimen, then the<br />
electricity is shut off and the specimen checked <strong>for</strong> evidence<br />
of ion migration. In the other, an external signal<br />
terminal is used to send current to operate the specimen<br />
while continuously monitoring and recording consumption<br />
of electricity. Continuous measurement during the<br />
test period is required because intermittent defective operation<br />
caused by dew condensation cannot be confirmed<br />
by a measurement that requires interrupting the<br />
test.<br />
<strong>Dew</strong> cycle test can be carried out under a wide range<br />
of temperature and humidity conditions, depending on<br />
the type of equipment and the variety of environmental<br />
conditions in which the equipment is being used. Because<br />
of this, we shall report on testing per<strong>for</strong>med to determine<br />
dew condensing quantity under a variety of<br />
temperature and humidity conditions.<br />
*1 Environmental <strong>Test</strong> Technology Center<br />
*2 Product Design Department<br />
Photo 1 <strong>Dew</strong> cycle test chamber<br />
ESPEC TECHNOLOGY REPORT No.1 23
2. Determining <strong>Dew</strong> Condensing Quantity Through Differences in Temperature<br />
and Humidity Conditions<br />
The transition over time of the quantity of dew condensation<br />
<strong>for</strong>ming, as we announced in the report part 1,<br />
can be postulated as in Fig. 1. We defined total dew condensing<br />
quantity as the integral value of the dew condensing<br />
time and quantity <strong>for</strong>ming at rate time, then we<br />
measured quantity and duration of dew condensation.<br />
The equipment used in testing is as follows.<br />
<strong>Test</strong> equipment:<br />
<strong>Dew</strong> cycle test chamber DCTH-70, made by<br />
Tabai Espec<br />
2-1 Measuring <strong>Dew</strong> Condensing Quantity<br />
2-1-1 <strong>Method</strong> of Evaluating <strong>Dew</strong> Condensing<br />
Quantity<br />
We measured dew condensing quantity relatively<br />
from current leakage during dew <strong>for</strong>mation. We used<br />
teflon to prevent the substrate board from absorbing humidity<br />
and plated the electrodes with gold to make it as<br />
difficult as possible <strong>for</strong> migration to <strong>for</strong>m.<br />
Then we applied alternating current. The resulting<br />
wave<strong>for</strong>m of current leakage is not stable, but the peak<br />
value of current leakage showed the conditions to be reproducible.<br />
Taking this peak value as a representative<br />
characteristic of dew condensing quantity, we investigated<br />
the relationship between the peak value and each<br />
of the conditions, which we shall define. The method of<br />
measuring and the specifications of the substrate board<br />
are given in Table 1.<br />
2-1-2 Analysis of the Effect of the Temperature Difference<br />
(DT)<br />
Because we felt that the quantity of dew condensation<br />
would change in relation to the temperature difference<br />
(DT), we examined the dew condensing quantity<br />
from the perspective of the temperature difference. We<br />
set the low temperature at a uni<strong>for</strong>m +5°C and progressively<br />
changed the high temperature settings <strong>for</strong> humidity<br />
and temperature. Results are shown in Fig. 2.<br />
The results show a temporary relationship between<br />
the temperature difference and the peak current leakage.<br />
2-1-3 Analysis of the Effect of the Difference in Temperature<br />
Settings<br />
With the temperature difference (DT) between low<br />
temperature and high temperature set to a uni<strong>for</strong>m 20°C,<br />
we looked <strong>for</strong> changes in dew condensing quantity when<br />
the temperature settings were changed. In addition, we<br />
set the high temperature relative humidity to a uni<strong>for</strong>m<br />
90%RH. Fig. 3 shows the results. The quantity of dew<br />
condensation varies in response to the temperature setting<br />
range. We were able to confirm that the higher the<br />
temperature range, the greater the quantity of dew condensation.<br />
This can be postulated as due to the higher<br />
the temperature range, the greater the saturation quantity<br />
of steam in the air, even when the temperature difference<br />
remains the same. (Refer to Fig. 2 and 3.)<br />
<strong>Dew</strong>drop<br />
quantity<br />
Substrate board<br />
specifications<br />
Prior processing<br />
Measurement<br />
method<br />
Total<br />
dewdrop<br />
quantity<br />
<strong>Dew</strong>drop time<br />
Fig. 1 Change in dew condensing quantity<br />
Table 1 Specimen specifications, prior processing, and<br />
method of measuring current leakage<br />
Current Leakage (mA)<br />
Current Leakage (mA)<br />
Current leakage (mA)<br />
Current Leakage (mA)<br />
20<br />
18<br />
16<br />
14<br />
12<br />
10<br />
8<br />
6<br />
4<br />
2<br />
0<br />
90%RH<br />
80%RH<br />
70%RH<br />
60%RH<br />
Board material: teflon. Tandem<br />
compound gold-plated electrodes<br />
corresponding to JIS type 2<br />
First clean in alcohol (IPA) with<br />
ultrasonic wave, then hand wash in<br />
alcohol.<br />
Apply 5V AC and measure the<br />
average peak value of current leakage.<br />
20 25 30 35 40 45<br />
Temperature Gap difference DT ( C) DT (°C)<br />
Fig. 2 Temperature difference (D)<br />
vs current leakage characteristics<br />
30<br />
25<br />
20<br />
15<br />
10 All settings All settings in the in high the high temperature<br />
5<br />
range range are at are 90%RH at 90 RH relative<br />
humidity<br />
0<br />
5°C–25°C 5-25 15°C–35°C 15-35 25°C–45°C 25-45 35°C–55°C 35-55 45°C–65°C 45-65 55-75 55°C–75°C<br />
Temperature setting range<br />
Fig. 3 Temperature setting range vs current<br />
leakage characteristics<br />
24 ESPEC TECHNOLOGY REPORT No.1
2-2 Measuring <strong>Dew</strong> Condensing Time<br />
Fig. 4 shows changes in specimen temperature occurring<br />
in the dew cycle test. The range (t0 ® t1) of temperature<br />
equilibrium at which dew condensation <strong>for</strong>ms<br />
on the specimen shows wet-bulb temperature. In the<br />
next range (t1® t2), that of transit ion from wet-bulb<br />
temperature to dry-bulb temperature, the surface of the<br />
specimen can be assumed to be drying regionally. Because<br />
of this, we measured the time (t0 ®t1) charted <strong>for</strong><br />
wet-bulb temperature of the specimen and used it to represent<br />
dew condensing time. Because this time varies<br />
according to the thermal capacity of the specimen, we<br />
used a 10 mm diameter steel ball as the standard specimen<br />
<strong>for</strong> this series of tests. The ball has dew condensation<br />
<strong>for</strong> at least half the high temperature exposure and<br />
dries within the time period.<br />
<strong>Dew</strong> condensing time can be postulated as t0 ®t2, but<br />
since the condition is uncertain in t1 ®t2, we measured<br />
t0 ®t1 during which time the dew <strong>for</strong>mation on the<br />
specimen can be assumed to be uni<strong>for</strong>m.<br />
2-2-1 <strong>Method</strong> of Measuring<br />
First, we measured the surface temperature of the<br />
steel ball. Next, through reciprocal comparison between<br />
the steel ball surface temperature and the time charted<br />
<strong>for</strong> the wet-bulb temperature in the chamber, we examined<br />
the changes in dew condensing time caused by humidity,<br />
temperature, and wind speed.<br />
Table 2 shows test conditions. We set the temperature<br />
difference (DT) to a uni<strong>for</strong>m 20°C <strong>for</strong> the temperature<br />
and humidity conditions, which we changed by<br />
10°C at a time.<br />
2-2-2 <strong>Test</strong> Results<br />
Fig. 5 shows test results. When a uni<strong>for</strong>m temperature<br />
difference was maintained, the higher the temperature<br />
setting, the shorter the dew condensing time. In<br />
addition, the higher the wind speed, the shorter the dew<br />
condensing time. Both these results and the dew condensing<br />
quantity results in item 2-1-3 show that the dew<br />
condensing quantity increases at the high temperature<br />
conditions, and drying can also be assumed to be faster.<br />
We can also assume that the higher the wind speed, the<br />
faster the drying time.<br />
Dry-bulb<br />
temperature<br />
Wet-bulb<br />
temperature<br />
Table 2 Temperature and humidity conditions<br />
and wind speed <strong>for</strong> measuring dew<br />
condensing time (O : indicates condition<br />
en<strong>for</strong>ced)<br />
Temperature and humidity<br />
conditions<br />
High temperature<br />
exposure<br />
<strong>Dew</strong> <strong>for</strong>ming Drying<br />
t 0 t 1 t 2<br />
5°C 90%RH«25°C 90%RH<br />
(20 minutes each)<br />
15°C 90%RH«35°C 90%RH<br />
(20 minutes each)<br />
25°C 90%RH«45°C 90%RH<br />
(20 minutes each)<br />
MIN.<br />
(0.9m/s)<br />
Low temperature<br />
exposure<br />
Change in ambient<br />
temperature<br />
Change in specimen<br />
surface temperature<br />
Fig. 4 Specimen temperature change in the<br />
dew cycle test<br />
<strong>Dew</strong>drop time (minutes)<br />
(Wet-bulb temperature charted time)<br />
20<br />
19<br />
18<br />
17<br />
16<br />
15<br />
14<br />
13<br />
12<br />
11<br />
10<br />
9<br />
8<br />
7<br />
6<br />
5°C–25°C<br />
90%RH<br />
15°C–35°C<br />
90%RH<br />
Temperature setting range<br />
Wind speed<br />
MID.<br />
(1.4m/s)<br />
MAX.<br />
(1.9m/s)<br />
<br />
<br />
<br />
Wind speed 0.9m/s<br />
Wind speed 1.4m/s<br />
Wind speed 1.9m/s<br />
25°C–45°C<br />
90%RH<br />
Fig. 5 Steel ball dew condensing time<br />
characteristics<br />
ESPEC TECHNOLOGY REPORT No.1 25
3. The Relationship Between Temperature/Humidity Conditions and <strong>Migration</strong><br />
3-1 <strong>Test</strong> <strong>Method</strong><br />
The main conditions influencing the speed at which<br />
migration occurs are temperature, humidity, and electrical<br />
field. We can also report that <strong>for</strong> dew condensation,<br />
ion shift time varies according to the way drops of water<br />
adhere. However, the relationship between migration<br />
and temperature and humidity conditions in the dew cycle<br />
test is not well understood, so we examined migration<br />
occurring in response to each of the temperature<br />
and humidity conditions.<br />
Table 3 shows test conditions.<br />
3-2 <strong>Test</strong> Results<br />
Fig. 6 shows test results. Photo 2 shows the migration<br />
that <strong>for</strong>med. The higher the range of the temperature setting,<br />
the more quickly migration <strong>for</strong>med and the less<br />
time elapsed be<strong>for</strong>e failure. The results, as seen in Fig.<br />
7, indicate that the speed at which migration <strong>for</strong>ms is<br />
more strongly related to dew condensing quantity than<br />
to dew condensing time.<br />
F(t) (%)<br />
Photo 2 <strong>Migration</strong> <strong>for</strong>med in the dew cycle test<br />
99.9<br />
99.8<br />
99.0<br />
95.0<br />
90.0<br />
80.0<br />
70.0<br />
60.0<br />
50.0<br />
40.0<br />
30.0<br />
25.0<br />
20.0<br />
15.0<br />
10.0<br />
5.0<br />
4.0<br />
3.0<br />
2.0<br />
1.5<br />
1.0<br />
0.5<br />
0.4<br />
0.3<br />
0.2<br />
0.15<br />
15°C/35°C 90%RH m=1.1<br />
5°C/25°C 90%RH m=1.2<br />
Temperature<br />
and humidity<br />
conditions<br />
<strong>Test</strong> cycles<br />
Specimen<br />
Prior<br />
processing<br />
Bias<br />
Measuring<br />
method<br />
Judgment<br />
method<br />
25°C/45°C 90%RH m=1.2<br />
Table 3 <strong>Dew</strong> cycle test conditions <strong>for</strong><br />
confirming migration<br />
<strong>Dew</strong>drop quantity<br />
(1) 5°C«25°C 90%RH (20 minutes each)<br />
(2) 15°C«35°C 90%RH (20 minutes each)<br />
(3) 25°C«45°C 90%RH (20 minutes each)<br />
80 cycles<br />
Material Glass epoxy substrate board<br />
Pattern Tandem compound<br />
electrodes corresponding to<br />
JIS type 2 (spacing 0.318 mm)<br />
Sample number n = 15<br />
Substrate board 50 mm x 120 mm<br />
dimensions<br />
No coatings such as flux or resist<br />
Ultrasonic cleaning in alcohol (IPA)<br />
DC 5V applied<br />
0.1<br />
0.1 0.2 0.3 0.4 0.5 0.6 0.7 0.8 0.9 1.0 2.0 3.0 4.0 5.0 6.0 7.0 8.0 9.0 10.0<br />
5 10 50 100<br />
External observation by intermittent removal<br />
each 10 cycles<br />
Even one occurrence of migration in pattern<br />
results in failure<br />
<strong>Cycle</strong><br />
Fig. 6 Weibull probability plot data on dew cycle test results <strong>for</strong> migration<br />
Greatest effect on migration<br />
<strong>for</strong>ming speed<br />
Time<br />
<strong>Dew</strong>drop quantity changes in high temperature/humidity range<br />
<strong>Dew</strong>drop quantity changes in low temperature/humidity range<br />
Fig. 7 The relationship between dew<br />
condensing time and quantity<br />
26 ESPEC TECHNOLOGY REPORT No.1
3-3 Examining migration caused by dew<br />
condensation<br />
At temperature and humidity conditions with a uni<strong>for</strong>m<br />
temperature difference, the profile parameters all<br />
resulted in similar values (m = 1.2) regardless of conditions<br />
set. Failure caused by ion migration can be postulated<br />
to be the same at the various temperature and<br />
humidity conditions at which these tests were per<strong>for</strong>med.<br />
The average life was approximately proporational<br />
to the temperature range set. We surmise that this<br />
is due to the strong influence of the different saturation<br />
level of steam in each temperature range.<br />
In this type of dew cycle test with changes in conditions<br />
set, the difference in dew condensing quantity due<br />
to the different saturation level of steam <strong>for</strong> each temperature<br />
can be postulated to increase the speed at which<br />
migration <strong>for</strong>ms. However, when evaluating marketplace<br />
products, we must keep in mind that materials<br />
come in a variety of shapes <strong>for</strong> both high temperature<br />
and low temperature use, making the causes more complex.<br />
There<strong>for</strong>e, we must consider more than the dew<br />
condensation. We need to create tests that account <strong>for</strong><br />
changes in materials. Accordingly, we must take great<br />
care to examine and select the characteristics of the test<br />
specimen.<br />
[Reference Bibliography]<br />
1) Tsuneo Ajiki:<br />
“Reliability Technology of Semiconductor Devices” Union of<br />
Japanese Scientists and Engineers (1988)<br />
2) Kiyoshige Echikawa:<br />
“Reliability <strong>Test</strong> of Electronics Components” Union of Japanese<br />
Scientists and Engineers (1985)<br />
3) Yuko Kanai/Shizuhiko Okiyama/Hideo Yamada/Satoshi<br />
Kobayashi/Ikuo Watarai:<br />
“A Study on a <strong>Method</strong> of <strong>Test</strong>ing <strong>Ion</strong> <strong>Migration</strong>” Proceedings of the<br />
24th. Union of Japanese Scientists and Engineers Symposium on<br />
Reliability and Maintainability (1994)<br />
4) Yuuichi Aoki/Hirokazu Tanaka/Shigeharu Yamamoto/Osamu Obata:<br />
“<strong>Evaluation</strong> <strong>Method</strong>s of <strong>Ion</strong> <strong>Migration</strong> by <strong>Dew</strong> Condensation <strong>Cycle</strong><br />
<strong>Test</strong>” Proceedings of the 24th. Union of Japanese Scientists and<br />
Engineers Symposium on Reliability and Maintainability (1994)<br />
4. Summary<br />
These tests revealed the following points.<br />
1. The greater the temperature difference (DT) in the<br />
dew cycle test, the greater the quantity of dew condensation.<br />
2. When the temperature difference (DT) is uni<strong>for</strong>m in<br />
the dew cycle test, higher temperature also produced<br />
more dew condensation, but duration is shorter.<br />
3. The greater the wind speed, the shorter the dew condensing<br />
time.<br />
4. <strong>Migration</strong> <strong>for</strong>ming speed is strongly related to the<br />
peak time of dew condensing quantity and is influenced<br />
by the saturation steam quantity of the setting<br />
temperature.<br />
The next tests that need to be carried out are an examination<br />
of the relationship between cycle acceleration<br />
characteristics and failure reproducibility in market<br />
products.<br />
In addition, recently cases involving the use of specialized<br />
insulation resistance measurement systems<br />
have been increasing. This type of measurement method<br />
makes it possible to continuously monitor changes in insulation<br />
resistance. This seems as if it would be an effective<br />
method <strong>for</strong> collecting data <strong>for</strong> the dew cycle test.<br />
5. Acknowledgments<br />
We would like to take this opportunity to express our<br />
gratitude <strong>for</strong> the advice in putting together this report<br />
that we received from everyone in the Quality Assurance<br />
Group, Quality Management Department at Matsushita<br />
Communication Industrial Co., Ltd.<br />
5) Yuuichi Aoki/Hirokazu Tanaka/Shigeharu Yamamoto:<br />
“<strong>Evaluation</strong> <strong>Method</strong> <strong>Using</strong> Condensation Cyclic <strong>Test</strong> Chamber”<br />
Seminar Text of Japan Institute <strong>for</strong> Interconnecting and Packaging<br />
Electronic Circuits Japan Institute <strong>for</strong> Interconnecting and Packaging<br />
Electronic Circuits (1995)<br />
6) Hirokazu Tanaka/Yuuichi Aoki/Shigeharu Yamamoto/Kunikazu Ishii:<br />
“A Study on Reliability <strong>Evaluation</strong> of Electronic <strong>Part</strong>s” Proceedings<br />
of the 25th. Union of Japanese Scientists and Engineers Symposium<br />
on Reliability and Maintainability (1995)<br />
7) Yuuichi Aoki/Hirokazu Tanaka/Shigeharu Yamamoto/Osamu<br />
Obata/Yoshiki Saito:<br />
“<strong>Evaluation</strong> <strong>Method</strong>s of <strong>Ion</strong> <strong>Migration</strong> by <strong>Dew</strong> Condensation <strong>Cycle</strong><br />
<strong>Test</strong>, <strong>Part</strong> 2” Proceedings of the 25th. Union of Japanese Scientists<br />
and Engineers Symposium on Reliability and Maintainability (1995)<br />
ESPEC TECHNOLOGY REPORT No.1 27