download
download download
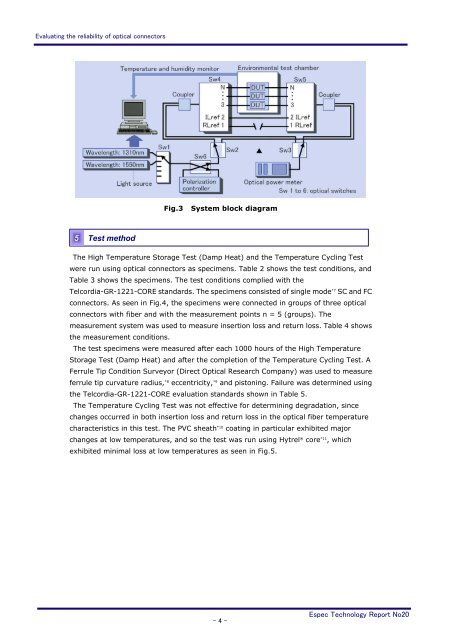
Evaluating the reliability of optical connectors Fig.2 Structure of optical connectors and factors affecting their reliability 4 Environmental test system for optical components An environmental test system for optical components was developed to be used in this research for testing the reliability of passive optical components. Photo 2 shows the system, and Fig.3 shows a block diagram of the system. This measurement system selects the light source wavelength using an optical switch selector, and is capable of measuring a maximum of 170 channels simultaneously for multiple specimens during environmental testing. This capability puts the system in conformance to the requirements of the Telcordia standards. The system is capable of measuring insertion loss, *4 return loss, *5 and PDL (Polarization Dependent Loss). *6 Photo 2 Environmental Test System - 3 - Espec Technology Report No20
Evaluating the reliability of optical connectors 5 Test method Fig.3 System block diagram The High Temperature Storage Test (Damp Heat) and the Temperature Cycling Test were run using optical connectors as specimens. Table 2 shows the test conditions, and Table 3 shows the specimens. The test conditions complied with the Telcordia-GR-1221-CORE standards. The specimens consisted of single mode *7 SC and FC connectors. As seen in Fig.4, the specimens were connected in groups of three optical connectors with fiber and with the measurement points n = 5 (groups). The measurement system was used to measure insertion loss and return loss. Table 4 shows the measurement conditions. The test specimens were measured after each 1000 hours of the High Temperature Storage Test (Damp Heat) and after the completion of the Temperature Cycling Test. A Ferrule Tip Condition Surveyor (Direct Optical Research Company) was used to measure ferrule tip curvature radius, *8 eccentricity, *9 and pistoning. Failure was determined using the Telcordia-GR-1221-CORE evaluation standards shown in Table 5. The Temperature Cycling Test was not effective for determining degradation, since changes occurred in both insertion loss and return loss in the optical fiber temperature characteristics in this test. The PVC sheath *10 coating in particular exhibited major changes at low temperatures, and so the test was run using Hytrel ® core *11 , which exhibited minimal loss at low temperatures as seen in Fig.5. - 4 - Espec Technology Report No20
- Page 2 and 3: Evaluating the reliability of optic
- Page 6 and 7: Evaluating the reliability of optic
- Page 8 and 9: Evaluating the reliability of optic
- Page 10 and 11: Evaluating the reliability of optic
- Page 12 and 13: Evaluating the reliability of optic
- Page 14 and 15: Measuring conductivity of proton co
- Page 16 and 17: Measuring conductivity of proton co
- Page 18 and 19: Measuring conductivity of proton co
- Page 20 and 21: Measuring conductivity of proton co
- Page 22 and 23: New product focus: Ultra View Tempe
- Page 24 and 25: New product focus: Ultra View Tempe
- Page 26 and 27: New product focus: Ultra View Tempe
- Page 28 and 29: New product focus: Ultra View Tempe
- Page 30: New product focus: Ultra View Tempe
Evaluating the reliability of optical connectors<br />
5<br />
Test method<br />
Fig.3 System block diagram<br />
The High Temperature Storage Test (Damp Heat) and the Temperature Cycling Test<br />
were run using optical connectors as specimens. Table 2 shows the test conditions, and<br />
Table 3 shows the specimens. The test conditions complied with the<br />
Telcordia-GR-1221-CORE standards. The specimens consisted of single mode *7 SC and FC<br />
connectors. As seen in Fig.4, the specimens were connected in groups of three optical<br />
connectors with fiber and with the measurement points n = 5 (groups). The<br />
measurement system was used to measure insertion loss and return loss. Table 4 shows<br />
the measurement conditions.<br />
The test specimens were measured after each 1000 hours of the High Temperature<br />
Storage Test (Damp Heat) and after the completion of the Temperature Cycling Test. A<br />
Ferrule Tip Condition Surveyor (Direct Optical Research Company) was used to measure<br />
ferrule tip curvature radius, *8 eccentricity, *9 and pistoning. Failure was determined using<br />
the Telcordia-GR-1221-CORE evaluation standards shown in Table 5.<br />
The Temperature Cycling Test was not effective for determining degradation, since<br />
changes occurred in both insertion loss and return loss in the optical fiber temperature<br />
characteristics in this test. The PVC sheath *10 coating in particular exhibited major<br />
changes at low temperatures, and so the test was run using Hytrel ® core *11 , which<br />
exhibited minimal loss at low temperatures as seen in Fig.5.<br />
- 4 -<br />
Espec Technology Report No20


