download
download
download

You also want an ePaper? Increase the reach of your titles
YUMPU automatically turns print PDFs into web optimized ePapers that Google loves.
Evaluating the reliability of optical connectors<br />
Report 1<br />
Evaluating the reliability of optical connectors<br />
Yuichi Aoki Technical Development Headquarters, Reliability Research Section<br />
Kishichi Sasaki Reliability Center for Electronic Components of Japan, Environmental Testing Laboratory<br />
Kiyoyuki Mutaguchi Japan Aviation Electronics Industry, Limited, Connector Division<br />
W<br />
e performed the High Temperature Storage Test (Damp Heat) and the<br />
Temperature Cycling Test on optical connectors in conformance to<br />
the Telcordia standards. During these reliability tests, automatic<br />
measurements of the optical characteristics of the specimens were carried<br />
out and physical changes were compared. During the evaluation following<br />
the tests, we checked for physical changes in the tips of the optical connectors.<br />
We found pistoning changes occurring on the tips of the connectors, especially<br />
during the Temperature Cycling Test. However, these pistoning changes caused<br />
almost no perceptible changes in optical characteristics. The ferrule tips were<br />
distorted after 2000 hours at 85°C and 85 percent relative humidity, exhibited<br />
flattening distortion.<br />
1<br />
Introduction<br />
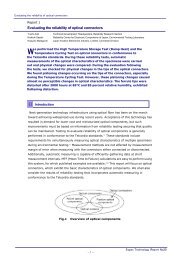
Next-generation technology infrastructure using optical fiber has been on the march<br />
toward achieving widespread use during recent years. Acceptance of this technology has<br />
resulted in demand for lower cost and miniaturized optical components, but such<br />
improvements must be based on information from reliability testing assuring that quality<br />
can be maintained. Testing to evaluate reliability of optical components is generally<br />
performed in conformance to the Telcordia standards. *1 These standards include<br />
requirements for simultaneously measuring optical characteristics of multiple specimens<br />
during environmental testing. 1) Measurement methods are not affected by measurement<br />
margin of error when measuring with the connectors either connected or disconnected.<br />
Additionally, automatic measuring is capable of efficiently gathering data at short<br />
measurement intervals. MTF (Mean Time to Failure) calculations are easy to perform using<br />
this system, for which published examples are available. 2,3) This report will focus on optical<br />
connectors, which exhibit the basic characteristics of optical components. We shall also<br />
consider the results of reliability testing that incorporates automatic measuring in<br />
conformance to the Telcordia standards.<br />
Fig.1 Overview of optical components<br />
- 1 -<br />
Espec Technology Report No20
Evaluating the reliability of optical connectors<br />
2<br />
The Telcordia standards that require simultaneously measuring optical characteristics of<br />
multiple specimens are mainly concerned with passive optical components. In this report<br />
the term "passive optical components" refers to such items as fiber, connectors,<br />
switches, couplers, attenuators, and all types of filters. Table 1 shows reliability tests for<br />
typical optical components.<br />
3<br />
Test standards for passive optical components<br />
Table 1 Telcordia test standards<br />
Standard Title<br />
GR-326-CORE<br />
Generic Requirements for Single-Mode Optical Connectors and<br />
Jumper Assemblies<br />
GR-1209-CORE Generic Requirements for Passive Optical Components<br />
GR-1221-CORE<br />
Generic Reliability Assurance Requirements for Passive Optical<br />
Components<br />
Structure of optical connectors and factors affecting their reliability<br />
Optical connectors are<br />
used to connect optical<br />
fiber. Photo 1 shows<br />
some typical<br />
connectors. Fig.2<br />
shows the composition<br />
of the optical<br />
connectors used in these tests.<br />
The fiber is inserted into the housing, which is called a zirconia ferrule, and the fiber is<br />
held in place with a hardening epoxy adhesive. The adhesive used for the connectors is<br />
Epo-Tek353ND (Epoxy Technology, Inc.). The degradation of this adhesive is a crucial<br />
element leading to the loss of the reliability of the optical connectors. A major factor<br />
producing degradation is the absorption of humidity, which causes degradation to occur<br />
over time. 1~5) Photo 1 Optical connectors<br />
The High Temperature Storage Test (Damp Heat) is used to evaluate<br />
humidity-induced degradation. As Fig.2 shows, adhesive degradation resulted in<br />
pistoning changes to the ferrule tip on the end of the optical connectors. A significant<br />
amount of pistoning causes such problems as an increase in air layers and an increase in<br />
leakage of insertion light. These problems result in an increase in optical loss.<br />
The Temperature Cycling Test was also run to evaluate the progression of cracking<br />
caused by micro-cracks in the fiber.<br />
- 2 -<br />
Espec Technology Report No20
Evaluating the reliability of optical connectors<br />
Fig.2 Structure of optical connectors and factors affecting their reliability<br />
4<br />
Environmental test system for optical components<br />
An environmental test system for optical components was developed to be used in this<br />
research for testing the reliability of passive optical components. Photo 2 shows the<br />
system, and Fig.3 shows a block diagram of the system.<br />
This measurement system selects the light source wavelength using an optical switch<br />
selector, and is capable of measuring a maximum of 170 channels simultaneously for<br />
multiple specimens during environmental testing. This capability puts the system in<br />
conformance to the requirements of the Telcordia standards. The system is capable of<br />
measuring insertion loss, *4 return loss, *5 and PDL (Polarization Dependent Loss). *6<br />
Photo 2 Environmental Test System<br />
- 3 -<br />
Espec Technology Report No20
Evaluating the reliability of optical connectors<br />
5<br />
Test method<br />
Fig.3 System block diagram<br />
The High Temperature Storage Test (Damp Heat) and the Temperature Cycling Test<br />
were run using optical connectors as specimens. Table 2 shows the test conditions, and<br />
Table 3 shows the specimens. The test conditions complied with the<br />
Telcordia-GR-1221-CORE standards. The specimens consisted of single mode *7 SC and FC<br />
connectors. As seen in Fig.4, the specimens were connected in groups of three optical<br />
connectors with fiber and with the measurement points n = 5 (groups). The<br />
measurement system was used to measure insertion loss and return loss. Table 4 shows<br />
the measurement conditions.<br />
The test specimens were measured after each 1000 hours of the High Temperature<br />
Storage Test (Damp Heat) and after the completion of the Temperature Cycling Test. A<br />
Ferrule Tip Condition Surveyor (Direct Optical Research Company) was used to measure<br />
ferrule tip curvature radius, *8 eccentricity, *9 and pistoning. Failure was determined using<br />
the Telcordia-GR-1221-CORE evaluation standards shown in Table 5.<br />
The Temperature Cycling Test was not effective for determining degradation, since<br />
changes occurred in both insertion loss and return loss in the optical fiber temperature<br />
characteristics in this test. The PVC sheath *10 coating in particular exhibited major<br />
changes at low temperatures, and so the test was run using Hytrel ® core *11 , which<br />
exhibited minimal loss at low temperatures as seen in Fig.5.<br />
- 4 -<br />
Espec Technology Report No20
Evaluating the reliability of optical connectors<br />
Table 2 Reliability test conditions<br />
Test items Test Conditions<br />
High<br />
Temperature<br />
Storage Test<br />
(Damp Heat)<br />
Temperature<br />
Cycling Test<br />
85°C, 85%rh,<br />
2000 h<br />
-40°C ←→ 85°C,<br />
1 hour each, 500<br />
cycles<br />
Fig.4 Test method<br />
Table 4 Measurement conditions<br />
Items Details<br />
Measurement items<br />
Insertion loss and<br />
return loss<br />
Light source<br />
wavelength<br />
1310 nm, 1550 nm<br />
Light source power 1 mW<br />
6<br />
Measurement<br />
intervals<br />
Test results<br />
Every 10 to 15 min.<br />
Specimens<br />
No. of<br />
specimens<br />
Evaluation<br />
method<br />
- 5 -<br />
Table 3 Specimens<br />
FC connectors, SC connectors<br />
(single mode)<br />
n = 5<br />
Insertion loss and return loss<br />
(optical component<br />
environmental test system)<br />
Tip condition measurement<br />
(pistoning, eccentricity, and<br />
curvature radius)<br />
Fig.5 Fiber temperature<br />
characteristics<br />
Table 5 Evaluation standards<br />
(from Telcordia GR-1221-CORE)<br />
Requirement Objective<br />
Insertion<br />
loss<br />
change<br />
0.3dB 0.2dB<br />
Return<br />
loss<br />
change<br />
6-1 Test results from the High Temperature Storage Test (Damp Heat)<br />
5dB 2dB<br />
Fig.6 shows the measurement results for the light source wavelength of 1310 nm for the<br />
first 1000 hours of the 2000-hour High Temperature Storage Test (Damp Heat). After<br />
1000 hours and again after 2000 hours, we verified that fluctuation did not exceed any<br />
evaluation standards. In addition, identical trends were exhibited for both light source<br />
wavelengths, 1310 nm and 1550 nm. No major difference was seen between the FC<br />
connectors and the SC connectors.<br />
Espec Technology Report No20
Evaluating the reliability of optical connectors<br />
Test time (h)<br />
(a) SC connector insertion loss<br />
Test time (h)<br />
(c) FC connector insertion loss<br />
- 6 -<br />
Test time (h)<br />
(b) SC connector return loss<br />
Test time (h)<br />
(d) FC connector return loss<br />
Fig.6 Results of the High Temperature Storage Test (Damp Heat)<br />
(light source wavelength: 1310 nm)<br />
6-2 Results of the Temperature Cycling Test<br />
Almost no differences were seen between the FC connectors and the SC connectors in<br />
the Temperature Cycling Test. Fig.7 shows partial measurement results for the SC<br />
connectors. Some insertion loss change and return loss change was seen following<br />
temperature changes in the temperature chamber during the Temperature Cycling Test,<br />
but these changes did not exceed the evaluation standard limits. The changes included<br />
insertion loss occurring at low temperatures, but no major fluctuation was seen at high<br />
temperatures. Return loss, however, tended to increase at high temperatures. Looking at<br />
the return loss changes over the long term confirms that as soon as return loss increases,<br />
the fluctuation stabilizes. This is thought to indicate that return loss quality stabilizes due<br />
to the adhesion of the connectors over time.<br />
Espec Technology Report No20
Evaluating the reliability of optical connectors<br />
(a) Insertion loss<br />
(b) Return loss<br />
Fig.7 Results of the Temperature Cycling Test<br />
(SC connectors; light source wavelength, 1310 nm)<br />
6-3 Pistoning measurement results<br />
Measurement results for the ferrule tip surfaces did not indicate major changes in<br />
eccentricity and curvature radius, but the measurements confirmed that changes<br />
occurred in pistoning compared to the initial values.<br />
Fig.8 shows pistoning measurements after 1000 and 2000 hours of the High<br />
Temperature Storage Test (Damp Heat), and after 500 cycles of the Temperature Cycling<br />
Test. This report represents the direction of pistoning as a negative value. In the IEC, the<br />
standard for tolerance is recommended as -50 to 100 nm, and this level is exceeded, but<br />
the insertion loss and return loss measurements did not exhibit conspicuous fluctuation.<br />
On the other hand, optical connectors with powerful insertion light may be subject to<br />
influence by pistoning. Because of this, we face the challenge of investigating the<br />
relationship between pistoning and optical characteristics in such areas as manufacturing<br />
conditions.<br />
In this research, more pistoning occurred in the Temperature Cycling Test than in the<br />
High Temperature Storage Test (Damp Heat), regardless of whether the type of fiber<br />
coating included Hytrel ® core or the PVC sheath. The cause for the increased pistoning is<br />
thought to include stress in the direction of the pistoning from contraction and peeling of<br />
the adhesive. This, in turn, is thought to be possibly caused by the effects of humidity and<br />
the re-hardening of the adhesive at the test temperature (85°C) for reliability testing.<br />
- 7 -<br />
Espec Technology Report No20
Evaluating the reliability of optical connectors<br />
Test time (h)<br />
(85°C, 85%rh, PVC sheath coating)<br />
Test cycles<br />
(-40/85°C, 1 hour each, PVC sheath coating)<br />
Test cycles<br />
(-40/85°C, 1 hour each, Hytrel ® core)<br />
Fig.8 Changes in pistoning<br />
- 8 -<br />
Espec Technology Report No20
Evaluating the reliability of optical connectors<br />
6-4 Observation of the tip shape<br />
Fig.9 shows the results of observations made on the shape of the ferrule tip before and<br />
after the High Temperature Storage Test (Damp Heat). After 2000 hours at 85°C and 85<br />
percent relative humidity, the surface of the ferrule tip showed signs of pitting and was<br />
rougher than before testing. This roughness did not appear on the surface of the tip after<br />
the Temperature Cycling Test, leading to the conclusion that the roughness was caused<br />
by humidity. Fig.10 shows a three-dimensional computer graphics rendition of the shape<br />
of the tip. After 2000 hours at 85°C and 85 percent relative humidity, the ferrule tip<br />
exhibited flattening distortion. However, pistoning measurements with the Ferrule Tip<br />
Condition Surveyor measured the position of the apex of the tip from the sphericity of the<br />
ferrule tip, and, using that position as a standard, calculated the amount of pistoning.<br />
Accordingly, if the position of the tip section differs from these measurements, the<br />
amount of pistoning could be greater than that calculated.<br />
(a) Initial period<br />
(b) After testing<br />
Fig.9 Ferrule tip observation (85°C, 85%rh, 2000 h)<br />
(Initial period) (-40 /85°C, 500 cycles) (85°C, 85%rh, 2000 h)<br />
Fig.10 Three-dimensional shape of the ferrule tip<br />
- 9 -<br />
Espec Technology Report No20
Evaluating the reliability of optical connectors<br />
7<br />
The optical characteristics of the optical connectors reviewed for this study were<br />
automatically measured during the High Temperature Storage Test (Damp Heat) (at<br />
85°C and 85 percent relative humidity for 1000 hours) and the Temperature Cycling Test<br />
(at 85°C / -40°C for 500 cycles of one hour each). We obtained the following results.<br />
(1)No changes occurred in optical characteristics, but pistoning increased in the<br />
connectors.<br />
(2)Increased pistoning of the ferrule tips was observed in both the Temperature Cycling<br />
Test and the High Temperature Storage Test (Damp Heat), but the major changes<br />
occurred in the Temperature Cycling Test.<br />
(3)The post-test condition of the ferrule tips after testing at 85°C and 85 percent relative<br />
humidity for 2000 hours exhibited flattening distortion. This result could indicate that<br />
the actual pistoning was greater than the calculated amount.<br />
8<br />
Conclusion<br />
Topics for future discussion<br />
Many aspects of the relationship between pistoning and optical characteristics have yet<br />
to be confirmed, and topics such as manufacturing conditions also require research.<br />
[Terminology]<br />
*1.Telcordia<br />
The breakup of the American communications giant AT&T (Bell Telephone) created<br />
seven regional telephone providers (the so-called "Baby Bells") and established a<br />
research and development company initially called Bellcore. Later, when this<br />
subsidiary was sold to a company unrelated to the original Bell, the company became<br />
known as Telcordia Technologies. In the field of communications in the U.S., the<br />
Telcordia standards are widely referenced as the baseline standards for this field.<br />
*2.SC connectors, and *3. FC connectors<br />
Both of these optical connectors are zirconia ferrule (refer to Fig.2 above) connectors<br />
developed in Japan that are widely used throughout the world. The stationary part of<br />
the SC connector is made of plastic, and can be connected by merely being pressed<br />
on. The stationary part of the FC connector, though, is made of metal and must be<br />
attached with screws.<br />
*4.Insertion loss<br />
The transmission loss occurring when light passes through the part. This value<br />
compares the insertion light with the outgoing light, and is expressed in decibels.<br />
*5.Return loss<br />
This value compares the insertion light power and the reflected light power of the<br />
reflected light returning inside the part. This value is expressed in decibels.<br />
- 10 -<br />
Espec Technology Report No20
Evaluating the reliability of optical connectors<br />
*6. PDL (Polarization Dependent Loss)<br />
The PDL value measures the change occurring in insertion loss caused by<br />
polarization. Polarization is a condition of deviation in the vibrational direction of<br />
light.<br />
*7. Single mode<br />
Single mode is a condition which provides light with a single pathway of propagation.<br />
This mode contrasts with multi-mode, which consists of multiple pathways of light<br />
propagation. Due to the mode-dispersed loss occurring in multi-mode, single mode<br />
is used for long-distance transmission.<br />
*8. Curvature radius<br />
The length (in mm) of the radius of a circle from a circumference projected from a<br />
curved surface.<br />
*9. Eccentricity<br />
The length (in µm) of the deviation between the center of the ferrule and the center<br />
of the core of the optical fiber.<br />
*10.PVC sheath<br />
This polyvinyl chloride (PVC) sheath, referred to as optical fiber cable, has a<br />
protective fiber coating. This type of sheath is mainly used indoors.<br />
*11.Hytrel ® core<br />
Hytrel ® is a polyester elastomer made of thermoplastic resin that was developed by<br />
the Dupont Corporation. This substance is an engineering plastic with superb<br />
features such as strength and heat characteristics. Hytrel ® core is a fiber optic<br />
stranded conductor coated with this elastomer.<br />
[Bibliography]<br />
1) "Generic Reliability Assurance Requirements for Passive Optical Components",<br />
Telcordia GR-1221-CORE Issue 2, 1999<br />
2) T. Tomasi, I. De Munari, V. Lista, L. Gherardi, A. Righetti, M. Villa: "Passive optical<br />
components: from degradation data to reliability assessment-preliminary results",<br />
Microelectronics Reliability 42, p.1333-1338, 2002<br />
3) A. Piccirillo, G. Zaffiro, T. Tambosso, G. Gallo: "Reliability of Optical Branching<br />
Devices", IEEE (Institute of Electrical and Electronics Engineers), Journal of Selected<br />
Topics in Quantum Electronics, Vol.5 No.5, 1999<br />
4) F. Caloz, D. Ernst, P. Rossini, L. Gherardi, L. Grassi, J. Arnaud: "Reliability of optical<br />
connectors - Humidity behavior of the adhesive", Microelectronics Reliability 42,<br />
p.1323-1328, 2002<br />
5) Tetso Kumazawa, Makoto Shimaoka, Kazuyuki Fukuda: "Moisture Absorbency of<br />
Optical Components Resin Adhesive" Journal of Japan Institute of Electronics<br />
Packaging, Vol.4, No.7, p.621- 624, 2001<br />
- 11 -<br />
Espec Technology Report No20
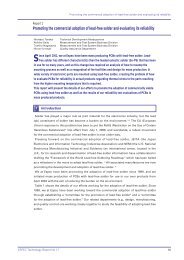
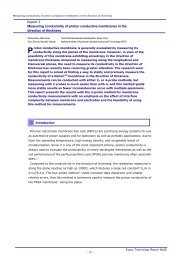
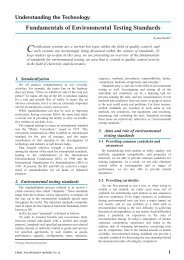
Measuring conductivity of proton conductive membranes in the direction of thickness<br />
Report 2<br />
Measuring conductivity of proton conductive membranes in the<br />
direction of thickness<br />
Shuhua Ma, Akiko Kuse Technical Development Headquarters, Espec Corp.<br />
Zyun Siroma, Kazuaki Yasuda National Institute of Advanced Industrial Science and Technology (AIST)<br />
P<br />
roton conductive membrane is generally evaluated by measuring its<br />
conductivity along the planes of the membrane. However, in view of the<br />
possibility of this membrane exhibiting anisotropy in the direction of<br />
membrane thickness compared to measuring along the longitudinal and<br />
transversal planes, the need to measure its conductivity in the direction of<br />
thickness has recently been receiving greater attention. The research work<br />
for this report is aimed at finding a way to stably and precisely measure the<br />
conductivity of a Nafion ®1) membrane in the direction of thickness.<br />
Measurements can be conducted with either 2- or 4-probe methods, but<br />
measuring with 2 probes is much easier than with 4, and this method yields<br />
more stable results as fewer inconsistencies occur with multiple specimens.<br />
This report presents the results with the 2-probe method for membrane<br />
conductivity measurements with an emphasis on the effect of interface<br />
complexity between membrane and electrodes and the feasibility of using<br />
this method for measurements.<br />
1<br />
Polymer electrolyte membrane fuel cells (PEFCs) are promising energy systems for use<br />
as automotive power supplies and for stationary as well as portable applications, due to<br />
their low operating temperature, high energy density, and acceptable levels of<br />
miniaturization. Since it is one of the most important criteria, proton conductivity is<br />
always used to evaluate the practicability of newly-developed membranes as well as the<br />
cell performance of the perfluorosulfonic acid (PFSA) polymer membrane often used with<br />
PEFC. 2)<br />
Introduction<br />
Compared to the conductivity in the direction of thickness, the resistance measured in<br />
along the plane reaches as high as 1000Ω, which features a large cell constant *1 (L/A in<br />
σ=L/(R·A)). The four-probe method *2 yields narrower data dispersion and smaller<br />
relative errors, thus this method is commonly used to measure the proton conductivity of<br />
the PFSA membrane *3 along the plane.<br />
- 12 -<br />
Espec Technology Report No20
Measuring conductivity of proton conductive membranes in the direction of thickness<br />
However, it is highly likely that treatments the membrane undergoes in the<br />
manufacturing and processing processes, such as stretching and hot-press, will change<br />
not only its crystalline structure and dimensional stability in the longitudinal, transverse,<br />
and thickness directions but also exert some influence on its proton conductivity. There<br />
is a high probability of anisotropy3) in the proton conductivity of the membrane. On the<br />
other hand, PFSA membranes are being used in the direction of thickness for the solid<br />
polymer electrolyte fuel cells, and an anisotropically conductive membrane that was<br />
newly-developed must also be evaluated in various directions. Therefore, a reliable<br />
measuring technique with high stability, reproducibility and accuracy is required to<br />
evaluate proton conductivity in the direction of thickness of the membrane. The research<br />
for this report focuses on developing a stable and precise method of measuring<br />
conductivity in the direction of thickness for the proton-conductive polymer electrolyte<br />
membrane. 4)<br />
Measurements in the direction of thickness can be conducted with 2-probe *4 and<br />
4-probe methods, but measuring with two probes is much easier than with four, and<br />
results are more stable as there are fewer inconsistencies with multiple specimens. This<br />
report presents the results obtained using the 2-probe method for conductivity<br />
measurements of ion exchange membranes.<br />
2<br />
Experimental method<br />
2-1 Equipment and materials<br />
Table 1 lists the equipment and materials used in this research.<br />
Table 1 Equipment and materials<br />
Equipment/materials Manufacturer<br />
Impedance gain/phase<br />
analyzer<br />
- 13 -<br />
Model/registered<br />
product name<br />
Solartron Instruments SI 1260<br />
Electrochemical interface Solartron Instruments SI 1287<br />
Temperature & humidity<br />
chamber<br />
Ion exchange membrane<br />
ESPEC Corporation PL-1KPH<br />
E. I. du Pont de Nemours<br />
and Company<br />
Nafion ® 117<br />
Espec Technology Report No20
Measuring conductivity of proton conductive membranes in the direction of thickness<br />
2-2 Specimen preparation<br />
MEA specimens were made by hot-pressing electrodes to a Nafion ® 117 membrane. In a<br />
preliminary test, measurements were made with two kinds of MEAs. One type of MEA<br />
specimen was produced by hot-pressing two Pt foil electrodes, coated with Nafion ®<br />
solution on one side each, to a membrane. The other MEA specimen was produced by<br />
hot-pressing two Pt foil electrodes to a membrane without using the Nafion ® coatings.<br />
Results showed good reproducibility with the Nafion ® -coated specimen, therefore, in this<br />
report specimens were prepared by coating a Nafion ® solution onto one surface of the<br />
electrodes for voltage impression unless otherwise specified.<br />
For 2-probe measurements in the direction of thickness, specimens were prepared by<br />
hot-pressing a Nafion ® membrane sandwiched into electrodes consisting of two pieces of<br />
metal sheets (5 mm x 5 mm x 10 to 20µm) or carbon papers (5 mm x 5 mm x 190µm)<br />
situated opposite each other. On one face of the metal sheets, a coating was applied with<br />
5 µl of 5 wt. % Nafion ® dispersion solution in lower aliphatic alcohols followed by vacuum<br />
drying one hour at room temperature. No coating was used on the carbon paper<br />
electrodes. Photo 1 shows the configuration of the membrane/electrode assembly<br />
(MEA *5 ) used in this report for the 2-probe measurements in the direction of thickness.<br />
The assembly is made of platinized Pt black sheets and Nafion ® 117 membrane.<br />
Photo.1 MEA of Pt black/Nafion ® 117 for 2-probe measurements in<br />
the direction of thickness<br />
For 4-probe measurements in the direction of thickness, the specimens were prepared<br />
by sandwiching and hot-pressing platinum wire electrodes between three Nafion ®<br />
membranes and then, as with the specimens for the 2-probe measurements,<br />
hot-pressing metal sheets that had been coated with Nafion ® solution and vacuum-dried<br />
onto both outside faces of the assembly.<br />
- 14 -<br />
Espec Technology Report No20
Measuring conductivity of proton conductive membranes in the direction of thickness<br />
Since 4-probe measurements in the surface direction obtained results with better<br />
reproducibility, these measurements were used as comparison reference against the<br />
measurements in the direction of thickness of the membrane. The specimens for 4-probe<br />
surface direction measurements were prepared by press-fitting metal sheets to both<br />
ends of the Nafion ® membrane and vertically piercing into the membrane near the center<br />
with platinum wires.<br />
Fig. 1 (a) and (b) respectively show schematics of the specimens for the 2-probe and<br />
4-probe measurements in the direction of thickness, while (c) shows the same for the<br />
4-probe surface direction measurements.<br />
Fig.1 Sample arrangements for (a) the 2-probe method, (b) the 4-probe<br />
method in the direction of thickness, and (c) the 4-probe method in<br />
the surface direction<br />
2-3 Conductivity Measurements<br />
A specimen fixed to a measuring cell was placed inside a temperature and humidity<br />
chamber under constant temperature and humidity (80°C, 30 to 90% rh). AC impedance<br />
measurements were taken using a computer-controlled Solartron Instruments model<br />
1260 impedance gain/phase analyzer and a computer-controlled 1287 electrochemical<br />
interface, and Cole-Cole (Z’-Z’’) and Bode (log|Z|-log Frequency and theta-log<br />
Frequency) plots were obtained. The frequency limits of the sinusoidal signals were<br />
typically set between 5 MHz and 0.01 Hz, with an oscillation of 10 mV. Assuming a circuit<br />
equivalent to the one shown in Fig.3, a best-fitting curve was overlaid onto the<br />
measurements taken by the 2-probe method. Conductivity was calculated from the<br />
obtained membrane resistance, Rbulk, using the following formula.<br />
…(1)<br />
Where σ is conductivity (Scm-1 ), L is membrane thickness (cm), A is electrode area<br />
(cm2 ), and R is resistance (Ω).<br />
- 15 -<br />
Espec Technology Report No20
Measuring conductivity of proton conductive membranes in the direction of thickness<br />
Equipment connection for the impedance gain/phase analyzer (IGPA), the<br />
electrochemical interface (EI) and the membrane/electrode assembly (MEA) was shown<br />
in Fig. 2 for 2-probe conductivity measurements used in this report.<br />
3<br />
Fig.2 Connections for impedance measured by the 2-probe method, with an<br />
IGPA in combination with potentiostat/galvanostat (electrochemical<br />
interface) mode.<br />
Results and observations<br />
3-1 Humidity dependency of resistance and capacity components of impedance<br />
In the Cole-Cole plot obtained from the 2-probe measurements, two loops appeared.<br />
They were named loop 1 and loop 2 in order of descending frequency and were treated as<br />
RY parallel circuits. The resistance and capacity components obtained from the fit were<br />
R1, R2, Y1 and Y2 (Y is a constant phase element and substituted for the equivalent<br />
capacity component in the fitting process). Fig. 3 shows a diagram of the equivalent<br />
circuit.<br />
Fig.3 Equivalent circuit for the membrane/electrode interface studied<br />
- 16 -<br />
Espec Technology Report No20
Measuring conductivity of proton conductive membranes in the direction of thickness<br />
Measurements were taken at an ambient temperature of 80°C using 4 types of<br />
electrodes made of gold, platinum, platinum black and carbon paper. Fig. 4 shows the<br />
humidity dependency of Rbulk (membrane resistance), R1, Y1, R2, and Y2 using the various<br />
electrode materials.<br />
As ambient relative humidity during measuring increased, Rbulk, R1, and R2 decreased.<br />
This phenomenon indicates that the conductivity of proton-conductive polymer materials<br />
such as Nafion ® depend on their water content. In particular, minimum resistance was<br />
obtained for R1 and R2 when using the platinum black electrode with higher active<br />
surface area, suggesting that both loop 1 and loop 2 with R/Y parallel connections are<br />
strongly correlated to the interface between membrane and electrode. With capacitance<br />
components of Y1 and Y2, regular increases in electrical capacity were found to<br />
correspond to increases in ambient humidity. Increases in this electrical capacity can be<br />
considered to result from improved contact between membrane and electrode concurrent<br />
to the hygroscopic swelling of the moisture-absorbent membrane. Types and surface<br />
morphology of electrode materials also notably affect interface resistance and capacity<br />
due to their varied surface area and differences in membrane contact. However, with Rbulk<br />
membrane resistance, equivalent measurement values have been obtained for various<br />
electrode materials with no major influence based on material types found. Therefore, it<br />
can be concluded that membrane resistance (Rbulk) can be separated from interface<br />
elements (R1, Y1, R2, and Y2) regardless of electrode materials used, since the<br />
multi-layer complexity of contact of the interface between membrane and electrodes,<br />
e.g., multiple semicircles in Cole-Cole plot, can be removed by equivalent circuit fitting.<br />
- 17 -<br />
Espec Technology Report No20
Measuring conductivity of proton conductive membranes in the direction of thickness<br />
Fig. 4 Dependence on relative humidity of various electric elements in<br />
equivalent circuits at 80°C<br />
- 18 -<br />
Espec Technology Report No20
Measuring conductivity of proton conductive membranes in the direction of thickness<br />
3-2 Conductivity<br />
Conductivity was calculated using Rbulk from Fig. 4 (a) and formula 1. Fig. 5 shows the<br />
conductivity values measured at an ambient temperature of 80°C and various humidity<br />
levels. For comparison, the results from 4-probe measurements in surface direction were<br />
also plotted. As shown in Fig. 5, conductivity results using 2-probe measurements in the<br />
direction of thickness were similar to those using 4-probe measurements in the surface<br />
direction for all electrode materials, demonstrating the validity of using the 2-probe<br />
method in the direction of thickness.<br />
4<br />
Fig. 5 Comparison of conductivity results at 80°C using the 2-probe<br />
Method in the direction of thickness and the 4-probe method in<br />
the surface direction.<br />
Conclusions<br />
Conductivity of Nafion ® membranes in the direction of thickness was measured using the<br />
2-probe AC impedance method. These experiments confirm that equivalent circuit fitting<br />
can separate membrane resistance from the interface components. Moreover, good<br />
contact at the interface between the membrane and electrode can be attained by coating<br />
the electrode with Nafion ® solution, and conductivity results are similar to results using<br />
4-probe measurements in the surface direction. These experiments demonstrate the<br />
validity and feasibility of using the 2-probe method for measuring in the direction of<br />
thickness.<br />
- 19 -<br />
Espec Technology Report No20
Measuring conductivity of proton conductive membranes in the direction of thickness<br />
[Terminology]<br />
*1.Cell constant<br />
Typically, electrical conductivity of a material can be expressed as<br />
σ=L/(A·R)=k/R, where L is the length (cm) of the material in electronic flow, A is<br />
the sectional area (cm2 ) across the flow of the material, R is the measured resistance<br />
(Ω), and k=L/A, the proportionality factor, is called the cell constant. The electrical<br />
conductivity of the material is in direct proportion to the reciprocal of the measured<br />
resistance between the electrodes by the scale factor, k, which represents the<br />
influence of the dimensions of the measuring cell.<br />
*2.Conductivity measurement using the 4-probe method<br />
As one method for measuring the electrical conductivity of materials, the 4-probe<br />
method possesses much higher measurement precision than the 2-probe method.<br />
Two terminals are used to conduct a current through the sample, and another two<br />
terminals measure the potential drop across the sample.<br />
*3.Proton-conductive membrane<br />
When potential difference exists in a conductor, electrical charges move in the<br />
direction required to weaken the difference. The property of this conductor is called<br />
its electrical conduction. When protons exist in the conductor as the main current<br />
carriers, the material is referred to as proton conduction, and the quality or power of<br />
the conduction is called proton conductivity. Some membrane materials, typically<br />
consisting of such as inorganic compounds of ceramics and/or glass, organic<br />
polymer compounds, and inorganic/organic hybrid materials, exhibit high H + ion<br />
conduction. Proton exchange membranes based on fluorinated polymers as typified<br />
by Nafion ® have been widely used in solid polymer electrolyte fuel cells (PEFCs) due<br />
to their high proton conductivity (to 0.1 Scm-1 ) and chemical stability.<br />
*4.Conductivity measurement using the 2-probe method<br />
As the simplest and most straightforward method for measuring electrical<br />
conductivity, the 2-probe method uses only two terminals that share the functions<br />
of both introduction of current (I) and measurement of voltage (V) across the<br />
sample. The electrical conductivity of a specimen can be calculated with the formula<br />
of σ=(I·L)/(V·A), provided that sectional area (A) and length (L) of the specimen are<br />
measured.<br />
*5.Membrane electrode assembly (MEA)<br />
An electrode layer composed of platinum black or platinum-supporting carbon and a<br />
porous supporting collector layer composed of carbon paper or carbon cloth<br />
arranged in succession on both sides of a cation exchange membrane, with the<br />
assembly unified by hot-pressing, is called a membrane electrode assembly (MEA).<br />
[Bibliography]<br />
1)http://www.fuelcells.dupont.com/<br />
2)Y. Sone, et al., J. Electrochem. Soc., 143, p.1254, 1996<br />
3)K. M. Cable et al., Chem. Mater., 7, p.1601, 1995<br />
4)A. Kuse, S. Ma, A. Mizugaki, H. Okuda, Z. Siroma, T. Ioroi, K. Yasuda, Y. Miyazaki;<br />
11th FCDIC Fuel Cell Symposium Proceedings, p.262, 2004<br />
- 20 -<br />
Espec Technology Report No20
New product focus: Ultra View Temperature (& Humidity) Chamber<br />
Topic 1<br />
New product focus: Ultra View Temperature (& Humidity) Chamber<br />
Toshimi Ishida,<br />
Takehiko Umehara,<br />
1<br />
Introduction<br />
Environmental Test Business Headquarters, Business Control Department,<br />
Product Planning Group<br />
Environmental Test Business Headquarters, Development & Design Department,<br />
Product Development Group<br />
The Ultra View Temperature (& Humidity) Chamber is based on the overwhelmingly<br />
popular Espec Platinous K series of environmental test chambers that has become<br />
established as our flagship product line. The new chambers are equipped with large glass<br />
viewing windows that enable the user to visually inspect the condition of specimens<br />
during tests. We are pleased to offer these products that we have developed to meet this<br />
basic need of our customers.<br />
When large viewing glass windows were provided on temperature and humidity<br />
chambers in the past, the design imposed limits on product performance, but this new<br />
chamber utilizes multilayer deposit metal electro-coated (EC) glass panes, enabling these<br />
models to maintain performance at the highest level.<br />
Potential market applications for these chambers include testing a wide variety of<br />
products such as automotive parts, household appliances, display devices ranging from<br />
cellular telephones to LCD monitors, and all types of information technology equipment.<br />
Display devices in particular are now being rushed to market as quickly as possible.<br />
Providing the ability to visually confirm the changes induced by temperature and humidity<br />
to these products fills a basic need of our customers for visual observation and inspection.<br />
Naturally, this advantage is not limited to display devices, but can also be applied to a<br />
wide range of product testing.<br />
Photo 1 Ultra View Temperature (& Humidity) Chamber<br />
- 21 -<br />
Espec Technology Report No20
New product focus: Ultra View Temperature (& Humidity) Chamber<br />
2<br />
Product features<br />
The features offered with these new chambers include full visibility from a widely<br />
expanded viewing area, anti-fogging viewing window panes, markedly improved<br />
performance, improved reliability of the viewing glass, and greatly improved ease of use.<br />
2-1 Full visibility<br />
The glass viewing windows provide full visibility from a widely expanded viewing area,<br />
offering a better view of the chamber interior and maintaining adequate light.<br />
Table 1 Viewing window effective size<br />
New product Established Espec products<br />
Type 2 470×720 310×650<br />
Type 3 570×820 410×750<br />
Type 4 970×970 810×900<br />
Effective viewing dimensions W×H (mm)<br />
These new chambers use twin type fluorescent lighting attached to the upper section of<br />
the chamber door, maintaining good lighting inside the test area. Conventional halogen<br />
lighting gives off a yellow hue that provides an unnatural tint to the specimens from the<br />
lighting, but the twin type fluorescent lighting utilized in the new test chamber makes it<br />
possible to reproduce natural colors. As an additional benefit, replacement parts can be<br />
obtained at reasonable prices.<br />
Table 2 Twin type fluorescent bulbs<br />
(1 bulb for types 2 and 3; 2 bulbs for type 4)<br />
Type 3 Type 4<br />
Lighting at the center<br />
of the chamber<br />
650 lux 1000 lux<br />
<br />
In Japan, domestic regulations for safety and health require businesses to provide the<br />
following lighting levels for workers in the workplace (excluding special types of work).<br />
Table 3 Lighting and illumination standards<br />
Workplace Standard<br />
Fine work 300 lux min.<br />
Normal work 150 lux min.<br />
Simple rough work 70 lux min.<br />
- 22 -<br />
Espec Technology Report No20
New product focus: Ultra View Temperature (& Humidity) Chamber<br />
2-2 Anti-fogging viewing window panes<br />
Environmental test chamber not only requires interior lighting and the effective visibility<br />
noted on the previous page, the chamber must also prevent the glass panes from fogging<br />
up due to the temperature and humidity conditions inside the chamber. Fogging occurs<br />
when the moisture in the air condenses on the surface of the glass. The conventional<br />
method of preventing fogging was to install a heater to warm the surface of the glass, but<br />
this approach required maintaining the glass surface temperature above the dew-point<br />
temperature, which was not economical. Also, during tests using such conditions as high<br />
temperature and low humidity, a heater is not required to maintain the glass surface<br />
temperature above the dew-point temperature. These new chambers prevent fogging on<br />
the glass surface using a heater control inside the glass, so instead of merely applying<br />
constant heat to the glass, only the minimum amount of heat required is used, thus<br />
conserving energy. (Patent pending)<br />
Glass using conventional heat-reflecting film or incorporating heating wires required the<br />
chamber design to incorporate upper and lower heat limits that were suited to the<br />
thermal limits of the glass panes. When reach-in ports were added to provide a means of<br />
operating the specimens, the glass surface in the vicinity of the reach-in ports tended to<br />
fog up, and localized hot spots occurred. This fogging was caused by not being able to<br />
place heaters near the reach-in ports (due to the processing on the glass for the ports) so<br />
that the heater current did not flow near the reach-in ports, resulting in a difference in<br />
current density in the vicinity of the reach-in ports. These new chambers are designed so<br />
that the current density is the same in all areas of the glass, including the areas around<br />
the reach-in ports, with no unevenness in current. Even when reach-in ports must be<br />
provided, there is no fogging on the surface of the glass, and the specimens can be clearly<br />
observed and operated. (Fig.1) (Patent pending)<br />
<br />
Fig.1 Current flow with viewing window reach-in ports in glass doors<br />
- 23 -<br />
Espec Technology Report No20
New product focus: Ultra View Temperature (& Humidity) Chamber<br />
2-3 Markedly improved performance<br />
Using conventional heat-reflecting film or incorporating heating wires in the glass panes<br />
required design limits on the performance of the chambers, but by utilizing glass<br />
reinforced with layers of deposit metal film, performance can be markedly upgraded. This<br />
design permits a wide temperature range, from –40°C to +120°C.<br />
Table 4 Comparison of lowest and highest achievable temperatures<br />
Lowest achievable emperature Highest achievable temperature<br />
New chambers -40°C *1 +120°C *2<br />
Established chambers -20°C to -35°C +80°C to +100°C<br />
*1 This performance table conforms to JTM K01-1998.<br />
*2 With the optional “viewing window reach-in ports”, the limit is +100°C.<br />
Expanding this temperature range makes it possible to apply the following types of test<br />
conditions as well.<br />
<br />
(1)LCD device environmental tests<br />
Storage (at high temperature) test: +30 to +100°C<br />
Storage (at low temperature) test*: -50 to 0°C<br />
Damp heat, steady state test: +40°C, 93%rh to +85°C, 93%rh; 85°C, 85%rh<br />
Composite temperature/humidity cyclic test: +25°C, 93%rh to +65°C, 93%rh;<br />
-10°C<br />
Standards: IEC61747-5 (JIS C60068-2-38), EIAJ ED-2531A<br />
(2)Automotive parts environmental tests<br />
High Temperature, Low Temperature Test: +120°C to –40°C<br />
High Temperature Exposure Test: +120°C<br />
Low Temperature Exposure Test: -30°C<br />
Standards: JIS D 0204, 0208<br />
(3)PDP environmental tests<br />
High Temperature (storage): +30 to +100°C<br />
Low Temperature (storage)*: -50 to 0°C<br />
High Temperature, High Humidity (constant): +40 to +60°C, 85% or 93%rh<br />
Low Temperature Operation: -20 to 0°C<br />
(*The Ultra View Temperature (& Humidity) Chamber is compatible down to<br />
-40°C.)<br />
To meet the demand for these standards, Espec has utilized glass reinforced with deposit<br />
metal, broadly extending the temperature range from –40°C to +120°C.<br />
The new chambers offer a greatly extended range of control for humidity as well as for<br />
temperature.<br />
- 24 -<br />
Espec Technology Report No20
New product focus: Ultra View Temperature (& Humidity) Chamber<br />
Fig.2 Temperature and humidity control range<br />
The new chambers also offer improvement in the temperature heat-up time and<br />
pull-down time.<br />
Table 5 Comparison of temperature heat-up time and pull-down time<br />
New chambers<br />
Established<br />
chambers<br />
Temperature heat-up time Temperature pull-down time<br />
50 minute max.<br />
(-40°C to +120°C)<br />
100 minute max.<br />
(-35°C to +100°C)<br />
- 25 -<br />
60 minute max.<br />
(+20°C to –40°C)<br />
90 minute max.<br />
(+20°C to –35°C)<br />
2-4 Improved reliability of the viewing window glass<br />
Glass using heat reflective film suffers deterioration of the film with long-term use,<br />
resulting in impaired visibility. Glass incorporating heating wires can suffer wire breakage<br />
leading to fogging of the glass surface. Utilizing glass reinforced with deposit metal film<br />
has eliminated these defects, providing solidly improved reliability.<br />
2-5 Greatly improved ease of use<br />
Not only responding to the need for visual inspection, we at Espec have responded to the<br />
desire to touch, operate, and measure the specimens by offering optional “reach-in ports”<br />
on the viewing window (one each on the right and left sides, for a total of two ports).<br />
Conventional reach-in ports had screw-on covers, requiring extra time and effort to open<br />
and close. There was also a danger of scratching the glass around the reach-in ports when<br />
opening and closing the screw-on covers, and finding where the covers were put after<br />
they had been removed could cause problems for the operator.<br />
These new chambers have incorporated one-touch swing covers for the reach-in ports.<br />
These covers are easy to open and close, and the operator never has to look for the<br />
covers. (Photo 2)<br />
Espec Technology Report No20
New product focus: Ultra View Temperature (& Humidity) Chamber<br />
<br />
Photo 2 Opening and closing the reach-in port on the viewing window<br />
- 26 -<br />
Espec Technology Report No20
New product focus: Ultra View Temperature (& Humidity) Chamber<br />
When the job requires continual work using the hands inside the reach-in ports, the<br />
releasing hinges allow for completely removing the covers.<br />
→ →<br />
Photo 3 Removing the reach-in port covers on the viewing window<br />
Interior lighting (fluorescent) is built into the upper section of the door. The bulbs can be<br />
easily replaced with no halt in testing. A dew condensation tray is also built into the lower<br />
section of the door to prevent water dripping onto the floor when the door is opened.<br />
Photo 4 Removing the interior lighting cover<br />
- 27 -<br />
Espec Technology Report No20
New product focus: Ultra View Temperature (& Humidity) Chamber<br />
3<br />
Table 6 shows the main specifications of the new chambers.<br />
Table 6 Main specifications<br />
Model PWL-2KP PWL-3KP PWL-4KP PWU-2KP PWU-3KP PWU-4KP<br />
Power supply<br />
Temperature (& humidity)<br />
control system<br />
- 28 -<br />
200V AC 3Ф 3W 50/60Hz,<br />
220V AC 3Ф 3W 60Hz,<br />
380V AC 3Ф 4W 50 Hz<br />
Balanced temperature and humidity<br />
Balanced temperature control (BTC)<br />
control (BTHC)<br />
Working temperature range 0 to +40°C<br />
Temperature range -40 to +120°C<br />
Humidity range 20 to 98%rh ----------<br />
Temperature<br />
-40 to<br />
+100°C<br />
±0.3°C<br />
fluctuation +100.1 to<br />
+120°C<br />
±0.5°C<br />
Humidity fluctuation ±2.5%rh ----------<br />
Performance<br />
*1<br />
Temperature<br />
-40 to<br />
+100°C<br />
±0.5°C ±1.0°C ±0.5°C ±1.0°C<br />
uniformity +100.1 to<br />
+120°C<br />
±0.75°C ±1.5°C ±0.75°C ±1.5°C<br />
Humidity uniformity ±3.0%rh ±5.0%rh ----------<br />
Temperature<br />
heat-up time<br />
Within 50 min from -40 to +120°C<br />
Temperature<br />
pull-down time<br />
Within 60 min from +20 to -40°C<br />
Effective viewing dimensions<br />
(W×H mm)<br />
Dimension<br />
*2<br />
Specifications<br />
Test area dimensions<br />
(W×H×Dmm)<br />
Outer dimensions<br />
(W×H×D mm)<br />
470x720 570x820 970x970 470x720 570x820 970x970<br />
500×<br />
705×<br />
600<br />
910×<br />
1590×<br />
1039<br />
600×<br />
850×<br />
800<br />
1010×<br />
1690×<br />
1239<br />
1000×<br />
1000×<br />
800<br />
1410×<br />
1970×<br />
1239<br />
500×<br />
705×<br />
600<br />
910×<br />
1590×<br />
1039<br />
600×<br />
850×<br />
800<br />
1010×<br />
1690×<br />
1239<br />
1000×<br />
1000×<br />
800<br />
1410×<br />
1970×<br />
1239<br />
Loading capacity (L) 225 408 800 225 408 800<br />
Weight (kg) 310 370 560 300 360 550<br />
* 1:・Performance values are given for +23°C ambient temperature and no specimens<br />
inside chamber.<br />
・Temperature/Humidity fluctuation and uniformity are based on JTM (Standard of<br />
Testing Machinery Association of Japan) K 01-1998.<br />
・Loading capacity is given for an effective area up to 1/6 the distance from walls in<br />
all direction.<br />
* 2: Excluding projections.<br />
Espec Technology Report No20
New product focus: Ultra View Temperature (& Humidity) Chamber<br />
4<br />
Conclusion<br />
The new Ultra View Temperature (& Humidity) Chamber was designed to respond to the<br />
basic need during environmental tests and evaluation tests to see, touch, operate, and<br />
measure the specimens being tested.<br />
To meet the special needs presented by the current trend of increasingly complex<br />
functions combined with miniaturization, finer tolerances, lighter weight, and the<br />
environmentally friendly materials required by current products, all of which are impacted<br />
by the increasing demand for speeding up the product development cycle, we at Espec<br />
are committed to meeting our customers’ needs for all kinds of tests needed for<br />
development, evaluation and reliability for all our customers’ new products.<br />
・For further information<br />
Please feel free to contact the Espec International Operations Center or drop in to your<br />
nearest overseas dealer for further information or to request a catalog regarding the<br />
Ultra View Temperature (& Humidity) Chamber.<br />
- 29 -<br />
Espec Technology Report No20