Miniaturisation for chemistry, physics, biology, & bioengineering
Miniaturisation for chemistry, physics, biology, & bioengineering
Miniaturisation for chemistry, physics, biology, & bioengineering

Create successful ePaper yourself
Turn your PDF publications into a flip-book with our unique Google optimized e-Paper software.
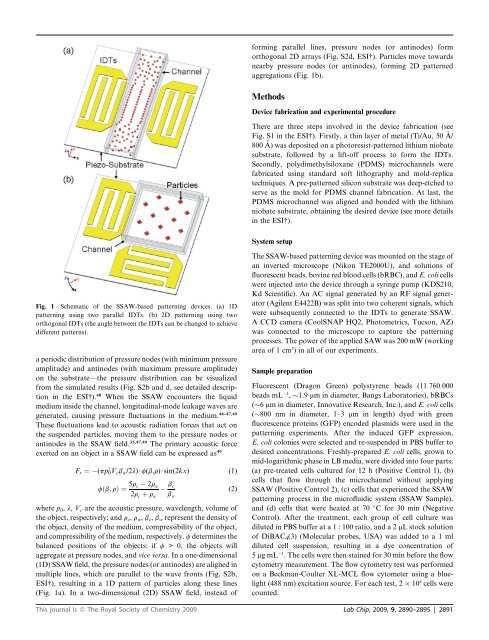
Fig. 1 Schematic of the SSAW-based patterning devices. (a) 1D<br />
patterning using two parallel IDTs. (b) 2D patterning using two<br />
orthogonal IDTs (the angle between the IDTs can be changed to achieve<br />
different patterns).<br />
a periodic distribution of pressure nodes (with minimum pressure<br />
amplitude) and antinodes (with maximum pressure amplitude)<br />
on the substrate—the pressure distribution can be visualized<br />
from the simulated results (Fig. S2b and d, see detailed description<br />
in the ESI†). 48 When the SSAW encounters the liquid<br />
medium inside the channel, longitudinal-mode leakage waves are<br />
generated, causing pressure fluctuations in the medium. 44–47,49<br />
These fluctuations lead to acoustic radiation <strong>for</strong>ces that act on<br />
the suspended particles, moving them to the pressure nodes or<br />
antinodes in the SSAW field. 35,47,49 The primary acoustic <strong>for</strong>ce<br />
exerted on an object in a SSAW field can be expressed as 49<br />
Fr ¼ (pp 2 0Vcbw/2l)$f(b,r)$sin(2kx) (1)<br />
fðb; rÞ ¼ 5rc 2rw bc (2)<br />
2rc þ rw bw where p0, l, Vc are the acoustic pressure, wavelength, volume of<br />
the object, respectively; and rc, rw, bc, bw represent the density of<br />
the object, density of the medium, compressibility of the object,<br />
and compressibility of the medium, respectively. f determines the<br />
balanced positions of the objects: if f > 0, the objects will<br />
aggregate at pressure nodes, and vice versa. In a one-dimensional<br />
(1D) SSAW field, the pressure nodes (or antinodes) are aligned in<br />
multiple lines, which are parallel to the wave fronts (Fig. S2b,<br />
ESI†), resulting in a 1D pattern of particles along these lines<br />
(Fig. 1a). In a two-dimensional (2D) SSAW field, instead of<br />
<strong>for</strong>ming parallel lines, pressure nodes (or antinodes) <strong>for</strong>m<br />
orthogonal 2D arrays (Fig. S2d, ESI†). Particles move towards<br />
nearby pressure nodes (or antinodes), <strong>for</strong>ming 2D patterned<br />
aggregations (Fig. 1b).<br />
Methods<br />
Device fabrication and experimental procedure<br />
There are three steps involved in the device fabrication (see<br />
Fig. S1 in the ESI†). Firstly, a thin layer of metal (Ti/Au, 50 A ˚ /<br />
800 A ˚ ) was deposited on a photoresist-patterned lithium niobate<br />
substrate, followed by a lift-off process to <strong>for</strong>m the IDTs.<br />
Secondly, polydimethylsiloxane (PDMS) microchannels were<br />
fabricated using standard soft lithography and mold-replica<br />
techniques. A pre-patterned silicon substrate was deep-etched to<br />
serve as the mold <strong>for</strong> PDMS channel fabrication. At last, the<br />
PDMS microchannel was aligned and bonded with the lithium<br />
niobate substrate, obtaining the desired device (see more details<br />
in the ESI†).<br />
System setup<br />
The SSAW-based patterning device was mounted on the stage of<br />
an inverted microscope (Nikon TE2000U), and solutions of<br />
fluorescent beads, bovine red blood cells (bRBC), and E. coli cells<br />
were injected into the device through a syringe pump (KDS210,<br />
Kd Scientific). An AC signal generated by an RF signal generator<br />
(Agilent E4422B) was split into two coherent signals, which<br />
were subsequently connected to the IDTs to generate SSAW.<br />
A CCD camera (CoolSNAP HQ2, Photometrics, Tucson, AZ)<br />
was connected to the microscope to capture the patterning<br />
processes. The power of the applied SAW was 200 mW (working<br />
area of 1 cm 2 ) in all of our experiments.<br />
Sample preparation<br />
Fluorescent (Dragon Green) polystyrene beads (11 760 000<br />
beads mL 1 , 1.9 mm in diameter, Bangs Laboratories), bRBCs<br />
( 6 mm in diameter, Innovative Research, Inc.), and E. coli cells<br />
( 800 nm in diameter, 1–3 mm in length) dyed with green<br />
fluorescence proteins (GFP) encoded plasmids were used in the<br />
patterning experiments. After the induced GFP expression,<br />
E. coli colonies were selected and re-suspended in PBS buffer to<br />
desired concentrations. Freshly-prepared E. coli cells, grown to<br />
mid-logarithmic phase in LB media, were divided into four parts:<br />
(a) pre-treated cells cultured <strong>for</strong> 12 h (Positive Control 1), (b)<br />
cells that flow through the microchannel without applying<br />
SSAW (Positive Control 2), (c) cells that experienced the SSAW<br />
patterning process in the microfluidic system (SSAW Sample),<br />
and (d) cells that were heated at 70 C <strong>for</strong> 30 min (Negative<br />
Control). After the treatment, each group of cell culture was<br />
diluted in PBS buffer at a 1 : 100 ratio, and a 2 mL stock solution<br />
of DiBAC 4(3) (Molecular probes, USA) was added to a 1 ml<br />
diluted cell suspension, resulting in a dye concentration of<br />
5 mgmL 1 . The cells were then stained <strong>for</strong> 30 min be<strong>for</strong>e the flow<br />
cytometry measurement. The flow cytometry test was per<strong>for</strong>med<br />
on a Beckman-Coulter XL-MCL flow cytometer using a bluelight<br />
(488 nm) excitation source. For each test, 2 10 4 cells were<br />
counted.<br />
This journal is ª The Royal Society of Chemistry 2009 Lab Chip, 2009, 9, 2890–2895 | 2891