

App G (VIA)part2 - Eskom
App G (VIA)part2 - Eskom
App G (VIA)part2 - Eskom

Create successful ePaper yourself
Turn your PDF publications into a flip-book with our unique Google optimized e-Paper software.
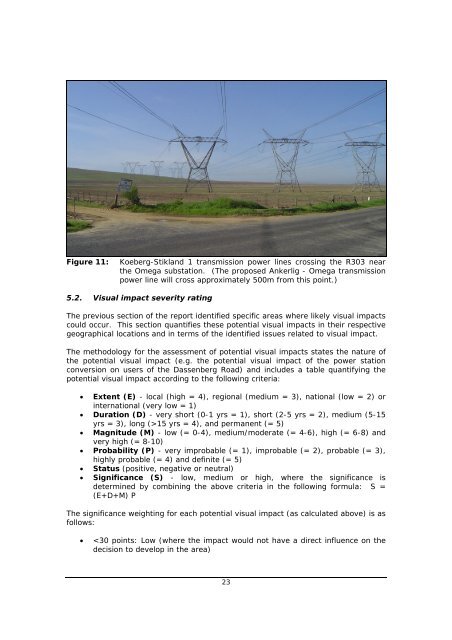
Figure 11: Koeberg-Stikland 1 transmission power lines crossing the R303 near<br />
the Omega substation. (The proposed Ankerlig - Omega transmission<br />
power line will cross approximately 500m from this point.)<br />
5.2. Visual impact severity rating<br />
The previous section of the report identified specific areas where likely visual impacts<br />
could occur. This section quantifies these potential visual impacts in their respective<br />
geographical locations and in terms of the identified issues related to visual impact.<br />
The methodology for the assessment of potential visual impacts states the nature of<br />
the potential visual impact (e.g. the potential visual impact of the power station<br />
conversion on users of the Dassenberg Road) and includes a table quantifying the<br />
potential visual impact according to the following criteria:<br />
• Extent (E) - local (high = 4), regional (medium = 3), national (low = 2) or<br />
international (very low = 1)<br />
• Duration (D) - very short (0-1 yrs = 1), short (2-5 yrs = 2), medium (5-15<br />
yrs = 3), long (>15 yrs = 4), and permanent (= 5)<br />
• Magnitude (M) - low (= 0-4), medium/moderate (= 4-6), high (= 6-8) and<br />
very high (= 8-10)<br />
• Probability (P) - very improbable (= 1), improbable (= 2), probable (= 3),<br />
highly probable (= 4) and definite (= 5)<br />
• Status (positive, negative or neutral)<br />
• Significance (S) - low, medium or high, where the significance is<br />
determined by combining the above criteria in the following formula: S =<br />
(E+D+M) P<br />
The significance weighting for each potential visual impact (as calculated above) is as<br />
follows:<br />
•


