

Part 1 Revenue Application: Multi-Year Price Determination ... - Eskom
Part 1 Revenue Application: Multi-Year Price Determination ... - Eskom
Part 1 Revenue Application: Multi-Year Price Determination ... - Eskom

Create successful ePaper yourself
Turn your PDF publications into a flip-book with our unique Google optimized e-Paper software.
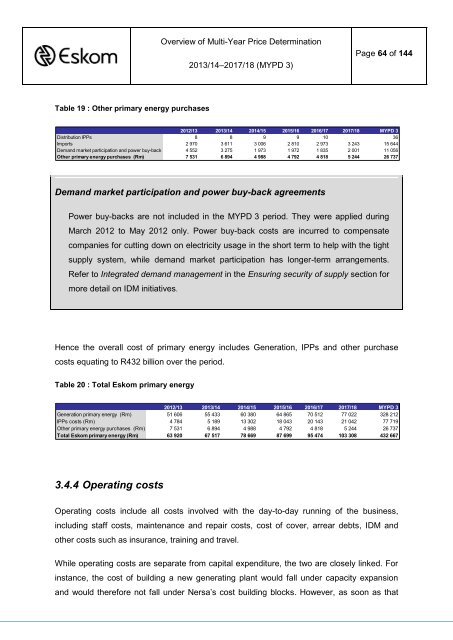
Table 19 : Other primary energy purchases<br />
Overview of <strong>Multi</strong>-<strong>Year</strong> <strong>Price</strong> <strong>Determination</strong><br />
2013/14–2017/18 (MYPD 3)<br />
Demand market participation and power buy-back agreements<br />
Page 64 of 144<br />
2012/13 2013/14 2014/15 2015/16 2016/17 2017/18 MYPD 3<br />
Distribution IPPs 8 8 9 9 10 36<br />
Imports 2 970 3 611 3 006 2 810 2 973 3 243 15 644<br />
Demand market participation and power buy-back 4 552 3 275 1 973 1 972 1 835 2 001 11 056<br />
Other primary energy purchases (Rm) 7 531 6 894 4 988 4 792 4 818 5 244 26 737<br />
Power buy-backs are not included in the MYPD 3 period. They were applied during<br />
March 2012 to May 2012 only. Power buy-back costs are incurred to compensate<br />
companies for cutting down on electricity usage in the short term to help with the tight<br />
supply system, while demand market participation has longer-term arrangements.<br />
Refer to Integrated demand management in the Ensuring security of supply section for<br />
more detail on IDM initiatives.<br />
Hence the overall cost of primary energy includes Generation, IPPs and other purchase<br />
costs equating to R432 billion over the period.<br />
Table 20 : Total <strong>Eskom</strong> primary energy<br />
2012/13 2013/14 2014/15 2015/16 2016/17 2017/18 MYPD 3<br />
Generation primary energy (Rm) 51 606 55 433 60 380 64 865 70 512 77 022 328 212<br />
IPPs costs (Rm) 4 784 5 189 13 302 18 043 20 143 21 042 77 719<br />
Other primary energy purchases (Rm) 7 531 6 894 4 988 4 792 4 818 5 244 26 737<br />
Total <strong>Eskom</strong> primary energy (Rm) 63 920 67 517 78 669 87 699 95 474 103 308 432 667<br />
3.4.4 Operating costs<br />
Operating costs include all costs involved with the day-to-day running of the business,<br />
including staff costs, maintenance and repair costs, cost of cover, arrear debts, IDM and<br />
other costs such as insurance, training and travel.<br />
While operating costs are separate from capital expenditure, the two are closely linked. For<br />
instance, the cost of building a new generating plant would fall under capacity expansion<br />
and would therefore not fall under Nersa‟s cost building blocks. However, as soon as that


