2003-2004 Technical Report - ESDS
2003-2004 Technical Report - ESDS
2003-2004 Technical Report - ESDS

You also want an ePaper? Increase the reach of your titles
YUMPU automatically turns print PDFs into web optimized ePapers that Google loves.
UK Data Archive Study Number 5340 - National Travel Survey, 2002-2010<br />
National Travel Survey<br />
<strong>2003</strong> & <strong>2004</strong><br />
<strong>Technical</strong> <strong>Report</strong><br />
Oliver Hayllar, Paul McDonnell,<br />
Christopher Mottau & Dorothy Salathiel
National Travel Survey<br />
<strong>2003</strong> and <strong>2004</strong><br />
Oliver Hayllar, Paul McDonnell,<br />
Christopher Mottau & Dorothy Salathiel<br />
Prepared for the Department for Transport<br />
October 2005<br />
P2320 and P2420
Contents<br />
KEY V<br />
ACKNOWLEDGEMENTS ..................................................................................................VI<br />
1 INTRODUCTION.......................................................................................1<br />
1.1 Background..............................................................................................1<br />
1.2 Uses of the NTS data ..............................................................................1<br />
1.3 Review of fieldwork sequence .................................................................2<br />
1.3.1 Sample selection ................................................................................. 3<br />
1.3.2 The interview ....................................................................................... 3<br />
1.3.3 Data input and editing.......................................................................... 4<br />
1.3.4 Data file protection............................................................................... 6<br />
1.4 Response.................................................................................................6<br />
2 SAMPLE SELECTION..............................................................................7<br />
2.1 Sample size and structure .......................................................................7<br />
2.2 Quasi-panel design..................................................................................7<br />
2.3 Selection of sample points.......................................................................8<br />
2.4 Oversampling of London........................................................................10<br />
2.5 Selection of addresses ..........................................................................10<br />
2.6 Allocation of PSUs .................................................................................10<br />
2.7 Selection of households at multi-household addresses.........................11<br />
2.8 Ineligible (deadwood) addresses ...........................................................11<br />
2.9 PSU level variables................................................................................12<br />
3 FIELDWORK PROCEDURES AND RESPONSE RATE........................15<br />
3.1 Introduction ............................................................................................15<br />
3.2 Interviewer briefings...............................................................................15<br />
3.3 Confidentiality ........................................................................................15<br />
3.4 Questionnaire and document despatch to interviewers.........................15<br />
3.5 Contacting respondents.........................................................................16<br />
3.6 Allocation of Travel Weeks ....................................................................17<br />
3.7 The placement interview........................................................................18<br />
3.7.1 The <strong>2003</strong> and <strong>2004</strong> NTS questionnaires........................................... 20<br />
3.7.2 Placing the travel record and other documents................................. 22<br />
The seven day travel record .............................................................. 23<br />
The long distance journey record ...................................................... 24<br />
The fuel and mileage chart ................................................................ 25<br />
3.7.3 Length of the placement call.............................................................. 25<br />
3.8 The reminder call ...................................................................................26<br />
3.9 The mid-week check call .......................................................................27<br />
3.10 The Pick-up call .....................................................................................28<br />
3.11 Outcome coding.....................................................................................29<br />
3.12 The £5 gift voucher incentive.................................................................31<br />
3.13 Response rates......................................................................................31<br />
3.14 The non-response survey ......................................................................35<br />
3.15 Back-checking and quality control .........................................................36<br />
4 DATA PROCESSING .............................................................................37
4.1 Diary coding and entry...........................................................................37<br />
4.2 Editing the travel record data.................................................................37<br />
4.3 Geocoding of address data....................................................................37<br />
4.4 Coding and editing the CAPI questionnaire data...................................38<br />
4.4.1 Examining notes ................................................................................ 38<br />
4.4.2 Back-coding other answers ............................................................... 38<br />
4.4.3 SOC & SIC coding............................................................................. 39<br />
4.4.4 Registration number checking ........................................................... 40<br />
4.4.5 Vehicle coding ................................................................................... 41<br />
4.4.6 Distance checks and area coding...................................................... 41<br />
4.4.7 Data conversion................................................................................. 42<br />
5 VARIABLES IN THE 2002/<strong>2003</strong> NTS DATABASE................................43<br />
5.1 Introduction ............................................................................................43<br />
5.2 List of main variables .............................................................................46<br />
5.3 PSU level variables................................................................................51<br />
5.4 Household variables ..............................................................................57<br />
5.5 Vehicle level variables ...........................................................................71<br />
5.6 Individual level variables........................................................................80<br />
5.7 Long distance trip variables .................................................................109<br />
5.8 Trip level variables...............................................................................116<br />
5.9 Stage level variables............................................................................129<br />
6 DEFINITIONS COMPARED WITH EARLIER SURVEYS.....................137<br />
6.1 Summary of differences for each NTS.................................................137<br />
6.2 Detailed list of changes in procedure and definitions ..........................141<br />
6.2.1 Definition of a journey/ trip............................................................... 141<br />
6.2.2 Trip purpose..................................................................................... 142<br />
6.2.3 Round trips ...................................................................................... 144<br />
6.2.4 Shopping trips.................................................................................. 144<br />
6.2.5 Walking jobs .................................................................................... 145<br />
6.2.6 Short walks ...................................................................................... 145<br />
6.2.7 Length of walk.................................................................................. 146<br />
6.2.8 Main mode of transport.................................................................... 147<br />
6.2.9 Mode of transport............................................................................. 148<br />
6.2.10 Trip start time and travelling time .................................................... 148<br />
6.2.11 Treatment of part miles.................................................................... 148<br />
6.2.12 Type of area..................................................................................... 149<br />
6.2.13 Population density ........................................................................... 150<br />
6.2.14 Household income........................................................................... 151<br />
6.2.15 Walking time to various facilities...................................................... 151<br />
6.2.16 Miscellaneous differences ............................................................... 152<br />
6.3 2002 Survey Year ................................................................................154<br />
6.4 <strong>2003</strong> Survey Year ................................................................................157<br />
6.5 <strong>2004</strong> Survey Year ................................................................................157<br />
7 COMPARISON OF NTS DATA WITH OTHER SOURCES ..................159<br />
7.1 Age and sex of NTS respondents........................................................159<br />
7.2 Region of residence of NTS respondents............................................163<br />
7.3 Vehicle stock of household 4-wheeled cars.........................................163<br />
7.4 Car mileage estimates .........................................................................164<br />
7.5 Household car availability ....................................................................167<br />
7.6 Travel to work ......................................................................................169<br />
7.7 Bicycle mileage....................................................................................171<br />
7.8 Bus boardings......................................................................................172<br />
7.9 Van mileage.........................................................................................173
7.10 Driving licence holding.........................................................................173<br />
8 SAMPLING ERRORS...........................................................................175<br />
8.1 Introduction ..........................................................................................175<br />
8.2 Sampling error calculations and tables................................................176<br />
9 PROGRESS ON IMPLEMENTING THE RECOMMENDATIONS OF THE<br />
NATIONAL STATISTICS QUALITY REVIEW ......................................191<br />
9.1 Introduction ..........................................................................................191<br />
9.2 Sample size and survey design ...........................................................191<br />
9.2.1 Sample size ..................................................................................... 191<br />
9.2.2 Stratification ..................................................................................... 191<br />
9.2.3 Quasi-panel design.......................................................................... 192<br />
9.2.4 Sample frame .................................................................................. 192<br />
9.3 Questionnaire topics ............................................................................192<br />
Household level ............................................................................... 192<br />
Individual level ................................................................................. 192<br />
Vehicle level..................................................................................... 192<br />
Rotated questions............................................................................ 193<br />
Questions added for <strong>2003</strong>-2005 ...................................................... 193<br />
9.4 Diary data ............................................................................................193<br />
9.4.1 Geocoding ....................................................................................... 193<br />
9.4.2 New technologies ............................................................................ 194<br />
9.5 Response rates....................................................................................194<br />
9.5.1 Incentives......................................................................................... 194<br />
9.6 Data processing...................................................................................194<br />
9.6.1 Weighting......................................................................................... 194<br />
9.6.2 Non-response survey ...................................................................... 195<br />
9.6.3 Partially responding households...................................................... 195<br />
9.6.4 Census-linked Study of survey non-response (CLS) ...................... 195<br />
9.6.5 Imputation ........................................................................................ 196<br />
9.6.6 Area classifications.......................................................................... 196<br />
9.6.7 Rolling three year data .................................................................... 196<br />
9.6.8 Tours database................................................................................ 196<br />
9.7 Data Access.........................................................................................196<br />
9.8 Other issues.........................................................................................196<br />
9.8.1 Local authority boosts...................................................................... 196<br />
9.9 Other changes from 2002 not covered in the Review..........................197<br />
9.9.1 Registration number ........................................................................ 197<br />
9.9.2 Coding ............................................................................................. 197<br />
9.9.3 Distance checks............................................................................... 197<br />
REPORTS AND PAPERS ON THE NATIONAL TRAVEL SURVEY ........................................199<br />
APPENDIX A QUESTIONNAIRE DOCUMENTATION <strong>2003</strong> AND <strong>2004</strong> ......................... 201<br />
APPENDIX B <strong>2003</strong> AND <strong>2004</strong> ALLOCATION OF PSUS TO QUOTA MONTHS............ 313<br />
APPENDIX C ALLOCATION OF PSUS TO QUOTA MONTHS....................................... 315<br />
APPENDIX D ADVANCE LETTERS ................................................................................ 317<br />
APPENDIX E QUESTIONS DELETED FROM THE NTS IN <strong>2003</strong> AND <strong>2004</strong>................. 319<br />
APPENDIX F SURVEY LEAFLET.................................................................................... 321<br />
APPENDIX G ADULT AND YOUNG PERSONS TRAVEL RECORDS ........................... 323
APPENDIX H MEMORY JOGGER................................................................................... 329<br />
APPENDIX I LONG DISTANCE JOURNEY RECORD................................................... 332<br />
APPENDIX J FUEL AND MILEAGE CHART................................................................... 337<br />
APPENDIX K ADDRESS RECORD FORM ..................................................................... 357<br />
APPENDIX L EXAMPLE TRAVEL WEEK ALLOCATION CARD .................................... 371<br />
APPENDIX M PROMISSORY NOTE................................................................................ 373
KEY<br />
Symbols and conventions<br />
National Centre for Social Research<br />
In tables where figures have been rounded to the nearest final digit, there may be an<br />
apparent slight discrepancy between the sum of the constituent items and the total<br />
shown.<br />
Symbols. The following symbols have been used throughout.<br />
.. = not available<br />
. = not applicable<br />
- = Negligible (less than half the final digit shown)<br />
0 = Nil<br />
v
ACKNOWLEDGEMENTS<br />
National Centre for Social Research<br />
We owe a great deal to the NTS team at the Department for Transport for their<br />
support and guidance. At NatCen, the NTS is very much a team effort, and thanks<br />
are due to the programmers, operations staff and interviewers who have worked so<br />
well together to make the survey a success. Particular thanks go to Michael Baxter,<br />
Spencer Broadley, Olivia Christophersen, Steven Elder, Simon Holroyd, Steve Kelly,<br />
Kevin Pickering, Sarah Tipping and Darren Williams. Finally, we are very grateful to<br />
all the respondents who gave their time to participate in the survey.<br />
vi
1 INTRODUCTION<br />
1.1 Background<br />
National Centre for Social Research<br />
The National Travel Survey (NTS) provides up-to-date and regular information about<br />
personal travel within Great Britain and monitors trends in travel behaviour. The<br />
Ministry of Transport commissioned the first NTS in 1965/1966, and it was repeated<br />
on an ad-hoc basis in 1972/1973, 1975/1976, 1978/1979, and 1985/1986. In 1988,<br />
the NTS became a continuous survey (i.e. fieldwork was conducted on a monthly<br />
basis) with an annual set sample size of 5040 addresses which had increased to<br />
5796 by 2001. In 2002 the annual set sample size increased to 15,048 addresses.<br />
Since January 2002, the Department for Transport (DfT) has commissioned the<br />
National Centre for Social Research (NatCen), an independent social research<br />
institute, as the contractor for the NTS. NatCen is responsible for questionnaire<br />
development, sample selection, data collection and editing, and data file production.<br />
The DfT is responsible for building the database and data analysis, publication and<br />
archiving.<br />
This report is a combined technical report which outlines both the <strong>2003</strong> and <strong>2004</strong><br />
NTS methodology for sample design, fieldwork procedures, data preparation and<br />
data provision. Differences between the two survey years are be noted where<br />
appropriate.<br />
Every three years an extended NTS <strong>Technical</strong> report is produced, giving more<br />
detailed information on the methodology as well as additional information on the<br />
variables collected, sampling errors, the impact of changes to the survey over time<br />
and comparisons of NTS data with data from other sources. The last extended report<br />
was the 2000 <strong>Technical</strong> <strong>Report</strong>. This combined <strong>2003</strong> and <strong>2004</strong> report is also an<br />
extended report.<br />
As this report is a combined report, chapters sometimes cover different time periods.<br />
In summary, chapters 1 to 4, 6, as well as the appendices (including the<br />
questionnaire documentation), cover the <strong>2003</strong> and <strong>2004</strong> survey years. Chapter 5<br />
gives details on key variables based on 2002/<strong>2003</strong> data and chapter 8 gives<br />
standard errors based on 2002/03 data; the data in these chapters is consistent with<br />
the latest detailed NTS publication , 'Focus on Personal Travel: 2005 Edition', which<br />
was based on 2002/03 data. Chapter 7 compares NTS data with other sources for<br />
the survey years 2002 to <strong>2004</strong>, although for some tables only data up to <strong>2003</strong> was<br />
available. Chapter 9 looks at progress in implementing the recommendations of the<br />
National Statistics Quality Review up until the current survey year (2005).<br />
1.2 Uses of the NTS data<br />
The NTS gathers information about several different aspects of travel including:<br />
purpose of travel, method of travel (walk, car, bus etc.), origin and destination of trips,<br />
time travelling and distance, as well as detailed information about individuals,<br />
vehicles and households.<br />
1
National Centre for Social Research<br />
DfT publishes the survey results. The findings and data are used by a variety of<br />
organisations including: Government departments (including DfT, HM Revenue and<br />
Customs, the Department for Trade and Industry, the Department for Education and<br />
Skills), the Transport Research Laboratory, the Highways Agency, Friends of the<br />
Earth, the Institute of Child Health, Help the Aged, Safe Routes to School, Transport<br />
2000, the AA and RAC, university academics and students, transport consultants and<br />
local councils (as background information for their local transport plans). DfT deposit<br />
the NTS dataset at the UK Data Archive at the University of Essex. Figure 1-1 shows<br />
examples of the uses of NTS data.<br />
Figure 1-1 Examples of the uses of NTS data<br />
NTS data has been used to:<br />
• Build up a picture of changes in personal travel over time<br />
• Examine travel among special groups in the population, such as children, elderly people, disabled<br />
people etc.<br />
• Understand the circumstances in which people will tend to use cars rather than public transport<br />
(or vice versa)<br />
• Understand how people travel to the shops or to school<br />
• Demonstrate the relationship between increased driving licence holding and falling bus use<br />
among pensioners<br />
• Identify the decline in the proportion of young people learning to drive<br />
• Assess the take-up of OAP concessionary fares<br />
• Understand how increased car ownership has led to increased driving among women<br />
• Study the use of buses by school children and how this has changed<br />
• Get guidance on the types of vehicle that cause the most pollution, by analysing fuel consumption<br />
and mileage levels<br />
• Monitor accident rates amongst different types of road users<br />
• Establish annual mileage for cars in order to advise on road and fuel tax<br />
• Help to monitor journey speeds<br />
• Examine car ownership levels and the accessibility of bus services in rural areas<br />
1.3 Review of fieldwork sequence<br />
The NTS uses two data collection methods: face to face interviewing using computer<br />
assisted personal interviewing (CAPI) and self-completion of a 7 day travel record.<br />
Figure 1-2 outlines the sequence of NTS tasks.<br />
2
National Centre for Social Research<br />
Figure 1-2 The sequence of NTS tasks<br />
Sample Selection from PAF<br />
u<br />
Questionnaire development<br />
u<br />
Sampled addresses issued to interviewers<br />
u<br />
Placement and Pick up interviews<br />
u<br />
Data transmission and documents returned by interviewers<br />
u<br />
In-house data input and editing<br />
u<br />
Quality checking<br />
u<br />
Data checking using SPSS<br />
u<br />
Data file production and delivery to DfT<br />
u<br />
Variable derivation and imputation, and data analysis and<br />
reporting by DfT<br />
1.3.1 Sample selection<br />
Both the <strong>2003</strong> and <strong>2004</strong> NTS were based on a random sample of 15,048 private<br />
households, drawn from the Postcode Address File (PAF). The sample was designed<br />
to ensure that the addresses for each quarter were representative of the total GB<br />
population (see Chapter 2).<br />
1.3.2 The interview<br />
Interviewers were instructed to begin fieldwork at the beginning of the quota month.<br />
Travel Week start dates were allocated within quota months, which ran from midmonth<br />
to mid-month. The field work procedure is outlined in figure 1-3 and began<br />
with the interviewer sending advance letters to the sampled addresses. These<br />
letters briefly explained the purpose of the NTS, and mentioned that an interviewer<br />
would contact them. It also stated that each respondent would receive a £5 gift<br />
voucher if all household members completed every section of the survey. From June<br />
<strong>2004</strong> onwards, a book of six first-class stamps was also included with the advance<br />
letter.<br />
Interviewers followed up the advance letter by making face-to-face contact with the<br />
household to make arrangements for the placement interview. The placement<br />
interview generally took place before the Travel Week started. This interview was<br />
3
National Centre for Social Research<br />
conducted with all the household members and gathered information about the<br />
household, its individual members, household vehicles and long distance journeys<br />
that the household members had recently made. At the end of this interview the<br />
interviewer explained and placed the 7 day travel diaries with all household<br />
members.<br />
If there was a gap of more than a few days between the placement interview and the<br />
start of the Travel Week, interviewers made a reminder call or sent a reminder card<br />
to the household to remind them that their Travel Week was about to start. This was<br />
followed by a mid week check call (either by telephone or face-to-face) during the<br />
Travel Week which checked on the household’s progress in completing their diaries.<br />
Within 6 days after the end of the Travel Week a pick up interview was conducted<br />
and the diaries were collected and checked. The pick up interview was used to<br />
complete any outstanding sections of the placement interview and to also check<br />
whether anything, such as a respondent’s possession of various types of travel card,<br />
had changed since placement.<br />
1.3.3 Data input and editing<br />
Usually the day after the pick up call, CAPI data was transmitted back to the NatCen<br />
operations department and all paper documents were returned by post. Once the<br />
documents had been received, a team of NTS coders booked the diaries into the<br />
control system, and coded, keyed and edited thetravel record information using the<br />
Diary Entry System. The contents of the CAPI questionnaire were edited and<br />
checked, and all interviewer notes examined. During this process the interviewers<br />
were contacted if there were any queries that could not be resolved by the coders. If<br />
necessary, the interviewer re-contacted respondents to resolve any issues.<br />
Interviewers’ progress was monitored on a weekly basis. The in-office deadline for<br />
fieldwork completion was approximately 8 weeks after the start of the first Travel<br />
Week for the quota month in question. For example, the cut off deadline for the<br />
January quotas was around 10th March. Quality checks were also made on selected<br />
interviewers on a rota basis and ten percent of addresses were back-checked 1 .<br />
1 Back-checking involves contacting participating households by telephone to ensure that they were<br />
happy with the way that the interview was conducted.<br />
4
Figure 1-3 NTS fieldwork procedures<br />
National Centre for Social Research<br />
Post advance letters<br />
u<br />
Make contact<br />
u<br />
Placement interview<br />
u<br />
Reminder call/card<br />
u<br />
Travel Week starts<br />
u<br />
Mid week check call<br />
u<br />
Travel Week ends<br />
u<br />
Pick-up interview<br />
u<br />
Return work & transmit data<br />
5
National Centre for Social Research<br />
1.3.4 Data file protection<br />
The data were organised into nine record types and delivered to DfT. The nine record<br />
types consisted of households, individuals (two records), vehicles, long distance<br />
journeys made in the three weeks before the Travel Week (two records), days within<br />
the Travel Week, journeys made during the Travel Week, and the stages of these<br />
journeys. Lastly, NatCen provided DfT with PSU-level variables associated with each<br />
household - data which were not collected directly from households. See section 2.10<br />
for a detailed description of PSU-level variables.<br />
1.4 Response<br />
Only households classed as ‘fully co-operating’ 2 are included in the response<br />
calculations. A national response rate of 60% was achieved in <strong>2003</strong> and in <strong>2004</strong>.<br />
This is equivalent to an achieved sample rate (ASR) of 54% in <strong>2003</strong> and 53% in<br />
<strong>2004</strong>. The ASR includes those households classified as ineligible in the denominator.<br />
2<br />
See Section 3.11 for a definition of ‘fully co-operating’ and for full response details for both <strong>2003</strong> and<br />
<strong>2004</strong>.<br />
6
2 SAMPLE SELECTION<br />
2.1 Sample size and structure<br />
National Centre for Social Research<br />
The samples for <strong>2003</strong> and <strong>2004</strong> were designed to provide a representative sample of<br />
households in Great Britain for each survey year. The annual issued sample size in<br />
both years was the same as 2002 at 15,048 addresses. This is over two and a half<br />
times the sample size for 2000 and 2001, and three times that for 1998 and 1999.<br />
The sample size was increased in 2002 to provide the degree of precision required<br />
by DfT with just one year’s data. Previously, it had been necessary to combine three<br />
years’ data for most analyses.<br />
The NTS is based on a stratified two-stage random probability sample of private<br />
households in Great Britain. The sampling frame is the ‘small user’ Postcode<br />
Address File (PAF), a list of all addresses (delivery points) in the country which<br />
receive less than 25 items of mail per day. For practical reasons, the Scottish islands<br />
and the Isles of Scilly were excluded from the sampling frame. This excludes 2.2% of<br />
addresses in Scotland and 0.2% in Great Britain.<br />
Each sample was drawn firstly by selecting the Primary Sampling Units (PSUs), and<br />
then by selecting addresses within PSUs. The sample design employs postcode<br />
sectors as PSUs. There were 684 PSUs in <strong>2003</strong> and <strong>2004</strong>.<br />
2.2 Quasi-panel design<br />
Following a review of the NTS methodology 3 , it was decided that the NTS should<br />
introduce a quasi-panel design from 2002 onwards. According to this design, half the<br />
PSUs in a given year’s sample are retained for the next year’s sample and the other<br />
half are replaced. This has the effect of reducing the variance of estimates of yearon-year<br />
change. Hence 342 of the PSUs selected for the 2002 sample were retained<br />
for the <strong>2003</strong> sample, supplemented with 342 new PSUs. The PSUs carried over from<br />
the 2002 sample for inclusion in <strong>2003</strong> were excluded from the <strong>2003</strong> sample frame, so<br />
they could not appear twice in the sample. The dropped PSUs from 2002 were<br />
included in the sample frame. The same procedure of dropping PSUs was carried out<br />
to create the <strong>2004</strong> sample.<br />
Whilst the same PSU sectors might appear in different survey years, no single<br />
addresses were allowed to be in more than one year. The PSUs which were carried<br />
over each year had different addresses selected to those selected in the same PSU<br />
in the previous year. Each year, NatCen provided the sampling company with a list of<br />
the addresses selected for the previous year’s survey. These addresses were<br />
excluded from the sampling frame before either the <strong>2003</strong> or <strong>2004</strong> addresses were<br />
selected. This meant respondents to the previous year’s survey in the PSUs which<br />
were carried over could not be contacted again.<br />
3<br />
Elliott, D. (2000) ONS Quality Review of the National Travel Survey: Some Aspects of Design and<br />
Estimation Methods.<br />
7
2.3 Selection of sample points<br />
National Centre for Social Research<br />
A list of all postcode sectors in Great Britain was generated, excluding those in the<br />
Scottish Islands and the Isles of Scilly. Sectors carried over from each year were also<br />
excluded. Sectors south of the Caledonian Canal with less than 500 delivery points<br />
and sectors north of the Caledonian Canal with less than 250 delivery points were<br />
grouped with an adjacent sector. Grouped sectors were then treated as one PSU. On<br />
average each PSU contained about 2,900 delivery points.<br />
This list of postcode sectors in Great Britain was stratified using a regional variable,<br />
car ownership and population density. This is done in order to increase the precision<br />
of the sample and to ensure that the different strata in the population are correctly<br />
represented. Random samples of PSUs were then selected within each stratum.<br />
The regional strata for Great Britain are based on the NUTS2 areas, grouped in a few<br />
cases where single areas are too small. NUTS or Nomenclature of Units for<br />
Territorial Statistics is a European-wide geographical classification developed by the<br />
European Office for Statistics (Eurostat). NUTS2 roughly relates to counties or<br />
groups of counties in England, and groups of unitary authorities or council areas in<br />
Scotland and Wales. The 40 regional strata for the survey are shown in Figure 2-1.<br />
Within each region, postcode sectors were listed in increasing order of the proportion<br />
of households with no car (according to the 1991 Census). Cut-off points were then<br />
drawn approximately one third and two thirds (in terms of delivery points) down the<br />
ordered list, to create three roughly equal-sized bands. Within each of the 120 bands<br />
thus created (40x3), sectors were listed in order of population density (people per<br />
hectare). 342 postcode sectors were then systematically selected with probability<br />
proportional to delivery point count 4 . Differential sampling fractions were used in<br />
Inner London, Outer London and the rest of Great Britain in order to oversample<br />
London (see section 2.4 for further details). These sectors were then added to the<br />
342 sectors carried over from the previous year’s survey to make the final sample of<br />
684 sectors for each year.<br />
4 after expansion by the Multiple Occupancy Indicator (MOI) in Scotland (see Section 2.7).<br />
8
National Centre for Social Research<br />
Figure 2-1 NTS regional stratification variable<br />
England GOR code<br />
1 Inner London – East 7 Greater London<br />
2 Inner London – West 7 Greater London<br />
3 Outer London – East and North East 7 Greater London<br />
4 Outer London – South 7 Greater London<br />
5 Outer London West and North West 7 Greater London<br />
6 Devon and Cornwall 9 South West<br />
7 North Somerset, North East Somerset, Bath,<br />
Somerset and Dorset<br />
9 South West<br />
8 Bristol, South Gloucestershire, Gloucestershire<br />
and Wiltshire<br />
9 South West<br />
9 Oxfordshire, Buckinghamshire and Berkshire 8 South East<br />
10 Hampshire and Isle of Wight 8 South East<br />
11 Kent 8 South East<br />
12 West Sussex and East Sussex 8 South East<br />
13 Surrey 8 South East<br />
14 Essex 6 Eastern<br />
15 Cambridgeshire, Suffolk and Norfolk 6 Eastern<br />
16 Hertfordshire and Bedfordshire 6 Eastern<br />
17 Leicestershire, Lincolnshire and<br />
Northamptonshire<br />
4 East Midlands<br />
18 Warwickshire and Hereford & Worcester 5 West Midlands<br />
19 West Midlands 5 West Midlands<br />
20 Shropshire and Staffordshire 5 West Midlands<br />
21 Nottinghamshire and Derbyshire 4 East Midlands<br />
22 Cheshire 2 North West and Merseyside<br />
23 Merseyside 2 North West and Merseyside<br />
24 Greater Manchester 2 North West and Merseyside<br />
25 Lancashire and Cumbria 2 North West and Merseyside<br />
26 South Yorkshire 3 Yorkshire and Humberside<br />
27 West Yorkshire 3 Yorkshire and Humberside<br />
28 North Yorkshire and Humberside 3 Yorkshire and Humberside<br />
29 Cleveland, County Durham and<br />
Northumberland<br />
1 North East<br />
30 Tyne & Wear 1 North East<br />
9
National Centre for Social Research<br />
Figure 2-1 NTS regional stratification variable (continued)<br />
Wales GOR code<br />
31 Anglesey, Gwynedd, Conwy, Denbighshire, 11 Wales<br />
Flintshire, Wrexham, Powys, Ceredigion<br />
32 Carmarthenshire, Neath Port Talbot,<br />
Pembrokeshire, Swansea<br />
11 Wales<br />
33 Blaenau Gwent, Caerphilly, Monmouthshire,<br />
Newport, Torfaen<br />
11 Wales<br />
34 Bridgend, Cardiff, Merthyr Tydfil, Rhondda<br />
Cynon Taff, Vale of Glamorgan<br />
11 Wales<br />
Scotland GOR code<br />
35 Grampian, Highland, Argyll & Bute 12 Scotland<br />
36 Tayside, Fife and Central 12 Scotland<br />
37 Edinburgh, Lothians and Borders 12 Scotland<br />
38 Glasgow and Dunbartonshire 12 Scotland<br />
39 Lanarkshire, Renfrewshire and Inverclyde 12 Scotland<br />
40 Ayrshire and Dumfries & Galloway 12 Scotland<br />
2.4 Oversampling of London<br />
Each year London PSUs were oversampled in order to compensate for lower<br />
response rates. Response rates tend to be much lower in London compared with the<br />
rest of Great Britain, with rates being lowest in Inner London. The NTS oversamples<br />
Inner and Outer London with the aim of achieving responding sample sizes in<br />
London and elsewhere which are proportional to their population. Estimates of<br />
response rates were made in order to oversample Inner and Outer London; 49% for<br />
Inner London, 58% for Outer London and 67% for the rest of Great Britain. These<br />
estimates were based on NTS response rates from 1995-2000 plus our own<br />
experience of achieving full household co-operation in these areas. Of the 684<br />
sectors in the sample, 56 were in Outer London and 44 in Inner London. These<br />
figures were the same for both <strong>2003</strong> and <strong>2004</strong>.<br />
2.5 Selection of addresses<br />
Within each selected sector, 22 addresses were sampled systematically, giving a<br />
sample of 15,048 addresses (684 postcodes x 22).<br />
About 24.7 million delivery points were available for selection in Great Britain as a<br />
whole, with about three million delivery points in Greater London. Consequently the<br />
probability of an address in Great Britain being selected for the <strong>2003</strong> NTS was one in<br />
1632; in Inner London this was one in 1221, and in Outer London one in 1458. In<br />
<strong>2004</strong>, the probability of an address in Great Britain being selected was one in 1644;<br />
in Inner London this was one in 1237, and in Outer London one in 1465.<br />
2.6 Allocation of PSUs<br />
As travel patterns show a seasonal variation, equal numbers of PSUs were assigned<br />
to each quota month (57 PSUs per month). Furthermore, PSUs were allocated to<br />
quota months such that a nationally representative sample would be obtained for<br />
each quarter.<br />
10
National Centre for Social Research<br />
2.7 Selection of households at multi-household addresses<br />
The term 'multi-household address' relates to an address with accommodation for<br />
more than one household. An example of this would be a house (no. 15) which has<br />
been split into two flats (15a and 15b) or there could be two families living as two<br />
separate households in one house.<br />
In England and Wales multi-household addresses are not reliably identified on the<br />
PAF. On the whole these addresses will not be identified until the interviewer has<br />
visited the address. As a result these households will have had a lower chance of<br />
selection than others. While there are relatively few such addresses (one percent),<br />
they account for a larger proportion of households, and these households tend to be<br />
rather different to others (poorer, younger, and smaller), so consequent biases may<br />
not be entirely trivial. Special procedures are in place to minimise this bias;<br />
interviewers are instructed to include all households up to a maximum of three at<br />
each address. If there are more than three at any one address, interviewers use a<br />
selection grid on the Address Record Form to randomly select three of them. This<br />
limitation on the number of extra households leaves some residual bias that could be<br />
removed using corrective weighting. This will be done from 2006 when NTS data for<br />
2005 and previous years will be published on a weighted basis.<br />
In contrast to England and Wales, the ‘multiple occupancy indicator’ (MOI) on PAF<br />
reliably identifies the number of households there are at each address in Scotland.<br />
Consequently the sampling frame for Scotland was expanded by MOI to give these<br />
extra households the same chance of being selected as households at single<br />
occupancy addresses. Thus at multi-household addresses, interviewers randomly<br />
selected one household for interview.<br />
2.8 Ineligible (deadwood) addresses<br />
The following types of address were classified as ineligible in <strong>2003</strong> and <strong>2004</strong>. (See<br />
also section 3.11 Outcome Coding):<br />
Houses not yet built or under construction.<br />
Demolished or derelict buildings or buildings where the address has "disappeared"<br />
when 2 addresses were combined into one.<br />
Vacant/empty housing unit - housing units known not to contain any resident<br />
household on the date of the 1st contact attempt.<br />
Non-residential address - an address occupied solely by a business, school,<br />
government office, other organisation, etc., with no resident persons<br />
Residential accommodation not used as the main residence of any of the residents.<br />
This is likely to apply to second homes/seasonal/vacation/temporary residences.<br />
These were excluded to avoid double counting - the households occupying the<br />
address had a chance of selection at their permanent address.<br />
Communal establishment/institution - an address at which 4 or more unrelated<br />
people sleep; while they may or may not eat communally, the establishment must be<br />
run or managed by the owner or a person (or persons) employed for this purpose.<br />
11
National Centre for Social Research<br />
Address is residential and occupied by a private household(s), but does not contain<br />
any household eligible for the survey - it is very rare for a residential household not to<br />
be eligible for NTS interview, exceptions include 'Household of foreign diplomat or<br />
foreign serviceman living on a base', addresses which are not the 'Main residence' of<br />
any of the residents and addresses where there are no residents aged 16 or over.<br />
Address out of sample - cases where interviewers were directed not to approach a<br />
particular address. This is very rare and usually only occurs where an address<br />
should not have been listed on the original sampling frame.<br />
2.9 PSU level variables<br />
In addition to the information provided by members of the sampled households, the<br />
NTS also collects information measured at the PSU level (P-level). The value of a Plevel<br />
variable applies to all households living within that PSU. The P-level is therefore<br />
the highest level at which the data may be analysed, coming just above the H<br />
(Household) level in the analysis hierarchy.<br />
The <strong>2003</strong> and <strong>2004</strong> NTS included seventeen P-level variables (see Figure 2-2). A<br />
more detailed account of the derivation of PSU-level variables is given in Chapter 5.<br />
12
National Centre for Social Research<br />
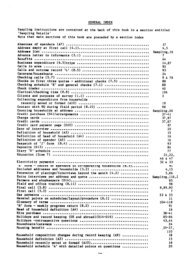
Figure 2-2 Description of P-level variables<br />
Variable Description<br />
P1 PSU identification number<br />
P2 Region (Scotland, Wales and nine Government office regions in England)<br />
P3 Blank field, not used<br />
P4 Blank field, not used<br />
P5 Type of Area (urban/rural classification) constructed from a classification of<br />
urban areas derived by ONS and DfT from the 1991 Census of Population.<br />
P6 PSU Population Density derived from 1991 Census figures on the number<br />
of people living in private households per hectare<br />
P7 LA Population Density derived from 1991 Census figures on the number of<br />
people living in private households per hectare.<br />
P8-14 Concessionary fares This information is obtained by DfT via a questionnaire<br />
sent to all local authorities<br />
P8 Availability of concessionary bus fares for pensioners<br />
P9 Eligibility for concessionary bus fare schemes for pensioners<br />
P10 Type of concession bus fare schemes for pensioners<br />
P11 Membership fee for concessionary bus fare schemes for pensioners<br />
P12 Times available for concessionary bus fare schemes for pensioners<br />
P13 Geographical area covered by the concessionary bus fare schemes for<br />
pensioners<br />
P14 Modes additional to bus covered by concessionary bus fare schemes<br />
for pensioners<br />
P15 County of residence<br />
P16 Regional stratification prior to 2002 No longer in use<br />
P17 Regional stratification (from 2002)<br />
P18 County/ Unitary Authority codes<br />
13
National Centre for Social Research<br />
14
National Centre for Social Research<br />
3 FIELDWORK PROCEDURES AND RESPONSE RATE<br />
3.1 Introduction<br />
The NTS is a continuous survey with fieldwork taking place throughout the year.<br />
Respondents were interviewed face to face using Computer-Assisted Personal<br />
Interviewing (CAPI), and they recorded their travel details in a 7 day self-completion<br />
travel record.<br />
Interviewers began fieldwork at the beginning of each month. The fieldwork involved<br />
making contact with households, conducting the placement interview, placing the<br />
travel diaries and conducting the pick up interview at the end of the Travel Week.<br />
Travel Week start dates were allocated within quota months, which ran from midmonth<br />
to mid-month. For example, the first Travel Week that interviewers could<br />
allocate for the June quota, started in mid-June. The CAPI data and NTS documents<br />
were returned to the NatCen operations department for in-house data input and<br />
editing.<br />
The <strong>2003</strong> and <strong>2004</strong> CAPI questionnaires were designed and implemented using the<br />
software system Blaise 4. A single Blaise instrument was used for the household,<br />
individual, vehicle and administrative sections of the questionnaire. The Diary Entry<br />
System (DES) was written in Visual Basic. Selected CAPI variables were extracted<br />
and loaded into the NatCen field management system from where they were<br />
referenced by the DES. This provides contextual information from the CAPI interview<br />
for those people inputting and editing travel record data.<br />
3.2 Interviewer briefings<br />
Interviewers were briefed by the researchers during a series of two day briefings. The<br />
briefings covered all aspects of the survey and included the completion of a dummy<br />
interview on interviewer laptops, as well as role-play exercises to practice doorstep<br />
technique and the placing and picking up of the travel records. Interviewers were also<br />
given a pre-briefing exercise. This involved completing their own travel record using<br />
their own journey details for a week, studying the definitions manual and completing<br />
a short test on this.<br />
3.3 Confidentiality<br />
Respondents were informed in the advance letter that their participation was<br />
voluntary and that any information they provided would remain confidential and would<br />
not be passed on to anyone outside NatCen in a form that could be used to identify<br />
them. Respondents were provided with a telephone number for NatCen’s Operations<br />
department that they could telephone if they had any queries. Any substantive<br />
queries or complaints were subsequently passed on to researchers to deal with.<br />
3.4 Questionnaire and document despatch to interviewers<br />
Before the start of each quota month, the operations department transmitted the<br />
sampled addresses and latest version of the questionnaire to the interviewers by<br />
modem. The relevant NTS materials were despatched to the interviewers by post.<br />
15
National Centre for Social Research<br />
Any queries about transmission or other technical matters were dealt with by a<br />
computer helpline run from the Operations department during working hours, and by<br />
a team of experienced interviewers working from home outside of working hours.<br />
Laptop maintenance was handled by a separate department within NatCen. The<br />
interviewers were also able to contact the staff in the specific team within the<br />
Operations department which dealt with the NTS.<br />
3.5 Contacting respondents<br />
Interviewers were given advance letters to send to the selected addresses in<br />
advance of their first call (see Appendix D). A Welsh translation of the advance letter<br />
was used for addresses in Wales. The advance letter gave some general<br />
background to the survey and explained its importance, some of its uses, and how<br />
the household had been selected. It also stated that each respondent would receive<br />
a £5 gift voucher if the placement interview was complete and all household<br />
members had filled out a travel record. See section 3.12 for more details on the £5<br />
incentive payment for respondents.<br />
The letter included a space for interviewers to write in their name so that respondents<br />
knew who would be calling. The letters were sent in ‘On Her Majesty’s Service’<br />
envelopes and also enclosed was an NTS fridge magnet. From June <strong>2004</strong><br />
onwards, a book of six first-class stamps was also included with the advance letter<br />
as a gesture of goodwill to encourage respondents to take part.<br />
Interviewers were notified of any refusals made direct to the Operations department<br />
as a result of the advance letter. Interviewers were not required to visit these<br />
addresses and they did not count against interviewers’ individual response rates.<br />
However, they were counted as non-response in calculating the overall response to<br />
the survey.<br />
A few days after the advance letters had been sent, interviewers made contact with<br />
respondents by personal visit, although telephone numbers were later made<br />
available for some households where it was found to be very difficult to make<br />
contact. Interviewers were required to make a minimum of 4 calls. These had to be<br />
at different times of day and on different days of the week. If there was still no<br />
contact, only then could an interviewer return a case as a ‘non-contact’. However, in<br />
practice, interviewers made far more calls than this. The average number of calls<br />
made for each type of outcome is shown in Table 3-1.<br />
Interviewers had a survey leaflet to use on the doorstep (see Appendix F). This<br />
contained information about the reasons for carrying out the survey, how households<br />
were chosen, and selected findings from previous surveys. Interviewers could leave<br />
this with respondents who were not sure if they wanted to take part, and call back at<br />
a later date. They also left it if they made an appointment to come back and do the<br />
interview. Interviewers could also use DfT Personal Travel Factsheets to<br />
demonstrate to possible respondents the type of data collected by the NTS. For any<br />
young children, a themed fun pack was provided for their amusement whilst adults<br />
completed the survey.<br />
16
National Centre for Social Research<br />
Table 3-1 Mean number of calls, by outcome<br />
<strong>2003</strong> <strong>2004</strong><br />
Fully co-operating 6.1 6.0<br />
Partially co-operating 6.8 6.8<br />
Non-contact 8.5 8.2<br />
Refusal 4.3 4.3<br />
Other unproductive 4.4 4.3<br />
Unknown eligibility 8.6 8.5<br />
Ineligible 2.7 2.8<br />
Overall average 5.5 5.4<br />
3.6 Allocation of Travel Weeks<br />
Each household had to be allocated a Travel Week during which they kept their<br />
travel record and entered details into the fuel and mileage chart. Travel Week start<br />
dates were allocated within quota months, which ran from mid-month to mid-month.<br />
The travel recording periods for each month are shown in the figure below.<br />
Figure 3-1 NTS <strong>2003</strong> and <strong>2004</strong> quota month dates<br />
<strong>2003</strong> <strong>2004</strong><br />
MONTH From To MONTH From To<br />
January 12 January 11 February January 12 January 11 February<br />
February 12 February 13 March February 12 February 12 March<br />
March 14 March 13 April March 13 March 12 April<br />
April 14 April 13 May April 13 April 13 May<br />
May 14 May 13 June May 14 May 13 June<br />
June 14 June 13 July June 14 June 13 July<br />
July 14 July 13 August July 14 July 13 August<br />
August 14 August 13 September August 14 August 13 September<br />
September 14 September 13 October September 14 September 13 October<br />
October 14 October 12 November October 14 October 13 November<br />
November 13 November 12 December November 14 November 14 December<br />
December 13 December 11 January December 15 December 13 January<br />
It was important that the choice of Travel Week was not left to the discretion of the<br />
respondent or interviewer as this could lead to bias. To prevent bias, it was<br />
necessary to ensure that the Travel Weeks were evenly spread over the days of the<br />
week as well as the weeks of the quota month. The method for doing this was to give<br />
each interviewer a Travel Week Allocation Card (see Appendix L for an example)<br />
listing 22 Travel Week start dates for the month. These 22 dates were randomly<br />
selected from all the dates from mid-month to mid-month, thus giving each<br />
interviewer a slightly different set of 22 dates.<br />
The interviewer had to allocate a start date to every address in their assignment,<br />
whether or not it was productive. They did this by allocating the first address at which<br />
they had a definite outcome (either a placement interview, deadwood, refusal or non-<br />
17
National Centre for Social Research<br />
contact) to the first date available on the list, the next address to the second date and<br />
so on. In exceptional circumstances where interviewers could not contact a<br />
household in time to allocate any of the original Travel Weeks (such as a household<br />
being away on holiday), interviewers were able to request additional Travel Weeks<br />
during the week after the original travel recording period (the ‘5 th week’). The<br />
operations department controlled use of these additional dates.<br />
3.7 The placement interview<br />
The first stage of interviewing consisted of the placement interview. This was<br />
conducted with all household members and consisted of three sections.<br />
The household questionnaire was asked of the Household Reference Person<br />
(HRP), which is the householder with the highest income, or their spouse or<br />
partner.<br />
The individual questionnaire was asked of each household member, including<br />
children (although proxy information was collected for under 11s). A maximum of<br />
10 people could be included. On the extremely rare occasions when interviewers<br />
encountered a household with more than 10 members, they were instructed to<br />
select the oldest 10 to take part in the interview, and to ensure that all vehicle<br />
owners were included.<br />
The vehicle questionnaire was asked of the main driver for each vehicle in the<br />
household. A maximum of 10 vehicles could be recorded.<br />
It was not always possible to interview all household members in person and so<br />
proxy interviews were allowed for adults who were difficult to contact. The<br />
percentage who were interviewed face-to-face, by proxy and not interviewed in <strong>2003</strong><br />
and <strong>2004</strong> is shown in Table 3.2. Interviewers were instructed to interview those under<br />
11 by proxy, which is why most interviews with children were proxy interviews. In<br />
both years 67% of interviews with children aged under 11 were by proxy.<br />
18
National Centre for Social Research<br />
Table 3-2 Method of individual interview at placement in <strong>2003</strong> and <strong>2004</strong><br />
<strong>2003</strong> Aged
National Centre for Social Research<br />
Table 3-4 Timing of the placement interview in relation to the Travel Week in <strong>2004</strong><br />
Full Partial Total<br />
Response Response<br />
Placement interview was… % % %<br />
… 8 or more days before start of Travel Week 25 27 25<br />
… 1-7 days before start of Travel Week 54 45 53<br />
… on day 1 of Travel Week 9 8 9<br />
… on day 2 of Travel Week 5 5 5<br />
… on day 3 of Travel Week 2 4 3<br />
… on day 4 of Travel Week 2 2 2<br />
… on day 5 of Travel Week 1 1 1<br />
… on day 6 of Travel Week 0.6 2 0.7<br />
… on day 7 of Travel Week 0.5 1 0.6<br />
… after end of Travel Week 2 5 2<br />
Base (households) 8122 900 9022<br />
3.7.1 The <strong>2003</strong> and <strong>2004</strong> NTS questionnaires<br />
The topics covered by each section of the placement interview are shown in Figure<br />
3.2.<br />
Figure 3-2 Placement interview topics, <strong>2003</strong> and <strong>2004</strong><br />
HOUSEHOLD INDIVIDUAL VEHICLE<br />
Household grid Disability Registration no.<br />
Accommodation Walk of 20 minutes or more Vehicle details<br />
Tenure Use of bicycles Parking<br />
Length of residence Driving licences Company cars<br />
Reasons for moving Economic activity Mileage<br />
Distances to amenities Transport barriers to employment<br />
Deliveries Transport-related benefits<br />
Shopping Income<br />
Children’s travel Place of work<br />
Transport opinions Home working<br />
Household vehicles Difficulties travelling to work<br />
Difficulties with shopping and other<br />
journeys<br />
Satisfaction with local bus<br />
services (new in <strong>2004</strong>)<br />
Season tickets<br />
Long distance journeys<br />
No new questions were introduced in <strong>2003</strong>, although a change was made to the way<br />
long distance journeys were recorded in the CAPI. This change made it easier for<br />
interviewers to record return journeys so that rather than having to record all the<br />
details of the return journey the interviewer could just record that the journey was the<br />
return journey of a previous one and the details were then calculated by the CAPI.<br />
20
National Centre for Social Research<br />
In <strong>2004</strong>, there were some minor additions to the questionnaire. A new set of<br />
questions on the planning of journeys by both private and public transport were<br />
introduced, which were intended to collect data about the use of Transport Direct. A<br />
question on satisfaction with local bus services, which was dropped in 2001, was<br />
reinstated in <strong>2004</strong>. Also in <strong>2004</strong>, an open question was added to the end of the<br />
placement interview so that the interviewer could record any general comments<br />
about travel that the respondent wanted to make.<br />
From 2002, some questions were designated to be ‘rotated’, so that they would be<br />
asked every other year. For <strong>2003</strong> and <strong>2004</strong>, these rotated questions are listed in<br />
Figure 3.3. Questions that were completely deleted are listed in Appendix E.<br />
Figure 3-3 Rotated questions, <strong>2003</strong> and <strong>2004</strong><br />
Module B (<strong>2003</strong> & 2005) Module A (2002 & <strong>2004</strong>)<br />
Time to walk/bus to shop selling groceries<br />
Time to walk/bus to nearest shopping centre<br />
Time to walk/bus to post office<br />
Frequency of use of ordinary buses<br />
Frequency of use of express bus/coach<br />
Frequency of use of surface rail trains<br />
Frequency of use of taxi/minicab<br />
Frequency of use of air flight within GB<br />
Frequency of use of bicycle<br />
Harmonised questions<br />
21<br />
Time to walk/bus to shop selling groceries<br />
Time to walk/bus to doctors<br />
Time to walk/bus to chemist<br />
Time to walk/bus to nearest general hospital<br />
Rating of reliability of local buses<br />
Rating of frequency of local buses<br />
Rating of reliability of local trains<br />
Rating of frequency of local trains<br />
Availability of combined bus and rail tickets<br />
Rating of pavement conditions<br />
Rating of cycle lane provision<br />
Has vehicle been driven outside GB in last 12<br />
months<br />
Estimated mileage on last trip outside GB<br />
Purpose of trip outside GB<br />
Has vehicle been driven in Northern Ireland<br />
in last 12 months<br />
Estimated mileage on last trip in Northern<br />
Ireland<br />
Purpose of trip in Northern Ireland<br />
A number of harmonised questions are used in the NTS to allow users of the data to<br />
compare NTS data with those from other social surveys. These questions are<br />
documented in Figure 3-4. In <strong>2004</strong>, a new harmonised question was added to<br />
gather information on how long someone had been looking for a job if they were<br />
currently out of work and looking for a job (HowLong).
National Centre for Social Research<br />
Figure 3-4 HARMONISED QUESTIONS USED IN THE <strong>2003</strong> AND <strong>2004</strong> NTS<br />
Harmonised question NTS question name Year<br />
introduced<br />
Sex Sex 1998<br />
Age AgeIf 1998<br />
Date of birth Birth 2000<br />
Marital status MarStat 1999<br />
Living arrangements LiveWith 1999<br />
Ownership of accommodation Hhldr 2002<br />
Joint Ownership HiHNum 2002<br />
Ethnic Group EthGroup 2001<br />
Length of residence HLong 1998<br />
Relationship to head of household RelHoH 1998<br />
Accommodation type Accom 2000<br />
House type HseTyp 2000<br />
Flat type FltTyp 2000<br />
Other accommodation AccOth 2000<br />
Housing tenure Tenl 1998<br />
Car ownership UseVcl 1998<br />
Vehicle type TypeVcl 1998<br />
Company car PrivVcl 1998<br />
In employment Wrking 1998<br />
Training scheme SchemeET 1998<br />
Away from work JbAway 1998<br />
Own business OwnBus 1998<br />
Relative business RelBus 1998<br />
Looking for work Looked 1998<br />
Starting work StartJ 1998<br />
Inactive YinAct 1998<br />
Industry IndD 1998<br />
Job title OccT 1998<br />
Job description OccD 1998<br />
Job status Stat 1998<br />
Paid employment EverWk 1998<br />
Date of leaving last job DtJbl 1998<br />
Supervising employees SVise 2001<br />
Supervision responsibilities SViseDesc 2001<br />
Organisation size EmpNo 1998<br />
Self-employed Solo 1998<br />
Number of employees SENo 1998<br />
Full or part time work FtPtWk 1998<br />
Long-term unemployed HowLong <strong>2004</strong><br />
Fully documented versions of the questionnaires used in the <strong>2003</strong> and <strong>2004</strong> NTS can<br />
be found in Appendix A. These show the routing and content of each questionnaire.<br />
The documentation of the <strong>2003</strong> and <strong>2004</strong> questionnaire includes not only the<br />
household, individual and vehicle sections, but also the administration block<br />
completed by all interviewers, as well as the diary entry system.<br />
3.7.2 Placing the travel record and other documents<br />
At the end of the placement interview, the interviewer placed:<br />
22
National Centre for Social Research<br />
• the seven day travel record (Appendix G),<br />
• the long distance journey record (Appendix I),<br />
• and the fuel and mileage chart (Appendix J).<br />
The seven day travel record<br />
Each individual in a household was issued with a seven day travel record, in which<br />
they were to record details of their travel activity. There are two versions, one for<br />
adults (respondents aged 16 and over) and one for children (the Young Person’s<br />
travel record).<br />
Each trip was recorded, and the respondent provided details of origin and<br />
destination, purpose, mode, distance travelled, cost, time, vehicles used, tickets used<br />
and number in the party for each journey. In addition the adult version of the travel<br />
record asked drivers to detail where they parked their vehicle as well as associated<br />
parking costs. From <strong>2003</strong> a new field was added to the travel record to collect<br />
information on whether drivers paid a congestion charge for each car journey. On<br />
day 7, the child travel record asked whether the respondent spent any time in the<br />
street (e.g. playing, talking with friends etc.). See Figure 3-5 for more substantive<br />
details on the content of the travel diaries in both <strong>2003</strong> and <strong>2004</strong>.<br />
Interviewers explained to respondents in detail how to complete the travel record.<br />
They generally did this by entering the details of some typical journeys made by the<br />
respondent in the blank example pages provided, often using the respondent’s<br />
previous day’s journeys. Some interviewers used the NTS definitions manual to<br />
help describe the level and type of details required. 5<br />
Simplified pocket size diaries or memory joggers (see Appendix H), into which<br />
respondents could briefly note down their journeys, were placed with respondents if<br />
the interviewer felt they would be helpful. Everyone received an NTS pen to aid<br />
travel record and other NTS document completion.<br />
5 All survey definitions are given in the NTS definitions manual, copies of which are available on request.<br />
23
National Centre for Social Research<br />
Figure 3-5 Seven Day Travel Diaries<br />
Adult Diary (respondents aged 16 and over<br />
(blue)<br />
Young Person’s Diary (green)<br />
Day 1-6 Day 1-6<br />
Purpose of journey Purpose of journey<br />
Time Left Time Left<br />
Time Arrived Time Arrived<br />
Origin - Where the journey started (From Village/ Where the journey started (From Village/ Town/<br />
Town/ Local Area)<br />
Local Area)<br />
Destination - Where the journey ended (To Where the journey ended (To Village/ Town/<br />
Village/ Town/ Local Area)<br />
Local Area)<br />
Method of Travel (Car, bus, walking etc.) (Only<br />
walks that were more than one mile, or took more<br />
than 20 minutes are included)<br />
24<br />
Method of Travel (Car, bus, walking etc.) (Only<br />
walks that were more than one mile, or took more<br />
than 20 minutes are included)<br />
Distance (yards or metres/ miles) Distance (yards or metres/ miles)<br />
Number in party Number in party (split into adults and children)<br />
Time travelling (in minutes) Time travelling (in minutes)<br />
Ticket Type (Single/ return/ travel card etc.) Ticket Type (Single/ return/ travel card etc.)<br />
Cost Cost<br />
Number of boardings (the number of trains/ Number of boardings (the number of trains/<br />
buses etc. used to reach journey destination) buses etc. used to reach journey destination)<br />
Which car/ motorcycle etc. used (only if journey<br />
was made not by public transport, but by car/<br />
motorcycle etc. )<br />
Driver or Passenger? (whether they were a front,<br />
or rear passenger) (only if journey was made not<br />
by public transport, but by car/ motorcycle etc.)<br />
Drivers only : where they parked and the cost<br />
Drivers only: Road/ Congestion charges paid<br />
(introduced in <strong>2003</strong>)<br />
Which car/ motorcycle etc. used (if journey was<br />
made not by public transport, but by car/<br />
motorcycle etc.)<br />
Passenger (whether they were a front, or rear<br />
passenger)<br />
Day 7 additional information requested Day 7 additional information requested<br />
Postal address details for both the origin and Postal address details for both the origin and<br />
destination of journeys<br />
destination of journeys<br />
All walks over 50 yards (including those less than All walks over 50 yards (including those less than<br />
one mile, or twenty minutes in length)<br />
one mile, or twenty minutes in length)<br />
Any time spent in the street not classified as a<br />
journey (e.g. playing with friends, skateboarding,<br />
riding bikes etc. )<br />
The long distance journey record<br />
The NTS also collects details about any long distance journeys, defined as trips of 50<br />
miles or more made within Great Britain, which a respondent makes over a four week<br />
period. A four week period is used to allow for enough journeys to be available for<br />
data analysis.<br />
The four week period was determined by the date of the designated Travel Week for<br />
a household, with the last day of the four week period being the last day of the Travel<br />
Week (i.e. the four week period is the Travel Week plus the three weeks before it ).<br />
During the placement interview, any long distance journeys that occurred between<br />
the start of the 4 week period and the day of the interview were recorded<br />
retrospectively. If there was a gap remaining between the placement interview and<br />
the start of the Travel Week, the interviewer gave respondents the long distance
National Centre for Social Research<br />
journey record. Long distance journeys during this period were then asked about<br />
during the pick-up interview. Long Distance Journeys that took place during the<br />
Travel Week were covered in the travel record. In total, a maximum of 40 long<br />
distance journeys could be recorded. See Figure 3.6 for an example of how the four<br />
week period works and Appendix I for a copy of the LDJ record.<br />
Figure 3-6 Example of long distance journey (LDJ) recording period<br />
Week 1 Week 2 Week 3 Week 4<br />
LDJ period covered retrospectively<br />
during the placement interview<br />
The fuel and mileage chart<br />
Placement interview Start of Travel Week<br />
25<br />
LDJ period covered by the<br />
LDJ record and entered into<br />
the CAPI during the pick-up<br />
interview<br />
In addition to the diaries and long distance journey record, a fuel and mileage chart<br />
was placed at the end of the placement interview for each household vehicle. The<br />
driver was encouraged to keep this chart in their vehicle. The chart required the<br />
driver to record the fuel gauge and milometer readings at the start and end of the<br />
Travel Week. The amount and cost of fuel put into the vehicle during the Travel<br />
Week was also recorded. See Appendix J for a copy of the Fuel and Mileage chart.<br />
3.7.3 Length of the placement call<br />
The average length of the placement call (that is, the placement interview plus the<br />
time taken to place and explain the various documents) was 52.2 minutes in <strong>2003</strong><br />
and 53.0 minutes in <strong>2004</strong>. In both years the time it takes to do a placement interview<br />
varied according to household size, being almost twice as long for the largest<br />
households as for a one-person household (see Tables 3-5 and 3-6 below).
National Centre for Social Research<br />
Table 3-5 Mean length of placement call (mins) by household size in <strong>2003</strong><br />
Number of<br />
people<br />
Mean length Base<br />
1 38 2,419<br />
2 52 3,057<br />
3 60 1,264<br />
4 63 1,160<br />
5 68 376<br />
6 70 117<br />
7 (79) 27<br />
8 (86) 9<br />
9 (90) 4<br />
10 (87) 4<br />
Table 3-6 Mean length of placement call (mins) by household size in <strong>2004</strong><br />
Number of<br />
people<br />
Mean length Base<br />
1 39 2,232<br />
2 54 2,962<br />
3 59 1,209<br />
4 64 1,071<br />
5 67 399<br />
6 68 116<br />
7 (84) 29<br />
8 (84) 6<br />
9 (90) 4<br />
10 (69) 3<br />
3.8 The reminder call<br />
Once the travel record had been placed, the next stage was to remind the household<br />
to start recording their journeys on the date allocated to them. Interviewers did this<br />
either by sending a reminder card, or by making a reminder phone call one or two<br />
days before the start of the Travel Week. See Table 3-7 for details of reminder calls<br />
and the sending of reminder cards in <strong>2003</strong> and <strong>2004</strong>.<br />
26
National Centre for Social Research<br />
Table 3-7<br />
conducted<br />
Proportion of productive households where a reminder was<br />
<strong>2003</strong> Fully co- Partially co- Total<br />
operatingoperating % % %<br />
Reminder phone call 41 31 40<br />
Reminder card sent 13 9 13<br />
No reminder card or phone call 46 60 47<br />
Base (households) 8,255 1,000 9,255<br />
<strong>2004</strong> Fully co- Partially co- Total<br />
operatingoperating % % %<br />
Reminder phone call 38 27 37<br />
Reminder card sent 10 10 10<br />
No reminder card or phone call 52 63 53<br />
Base (households) 8,118 900 9,018<br />
Reminder phone calls were generally short, lasting 3.4 minutes on average in both<br />
<strong>2003</strong> and <strong>2004</strong>. Interviewers were instructed to make the call when they were<br />
particularly concerned about the household's commitment to filling in their travel<br />
diaries, or when there was a gap of several days between the placement call and the<br />
Travel Week.<br />
3.9 The mid-week check call<br />
Interviewers also had the option of conducting a call half-way through the Travel<br />
Week, in order to encourage and help respondents with any difficulties they might be<br />
having filling out their travel diaries. This could be either a phone call or a personal<br />
visit, and was at the interviewer’s discretion, although they were strongly encouraged<br />
to conduct a face-to-face check for elderly participants. The proportion and type of<br />
mid-week checking calls conducted are shown in Table 3-8 below.<br />
27
National Centre for Social Research<br />
Table 3-8 Proportion of productive households where a mid-week check<br />
conducted<br />
<strong>2003</strong> Fully co- Partially co- Total<br />
operatingoperating % % %<br />
Mid week check conducted by phone 38 24 37<br />
Mid week check conducted in person 22 14 21<br />
No mid week check 40 63 42<br />
Base (households) 8,256 1,000 9,256<br />
<strong>2004</strong> Fully co- Partially co- Total<br />
operatingoperating % % %<br />
Mid week check conducted by phone 37 23 36<br />
Mid week check conducted in person 22 13 21<br />
No mid week check 41 64 43<br />
Base (households) 8,117 900 9,017<br />
As shown above, in both <strong>2003</strong> and <strong>2004</strong>, the majority of fully productive households<br />
received a mid-week check, either by phone or face-to-face. Partially co-operating<br />
households were less likely to receive one; this is likely to be because interviewers<br />
would not conduct a check for those who refused the travel record directly after the<br />
placement interview. The mid-week check call lasted 5.4 minutes on average in <strong>2003</strong><br />
and 5.0 minutes in <strong>2004</strong>.<br />
3.10 The Pick-up call<br />
At the end of the Travel Week, the interviewer called at the household (generally<br />
within a few days) to pick up and check the Travel diaries and to carry out another<br />
much shorter interview, known as the pick-up interview. The topics covered by this<br />
interview are shown below:<br />
Figure 3-7 Pick-up interview topics<br />
HOUSEHOLD INDIVIDUAL VEHICLE<br />
New vehicles acquired<br />
since placement<br />
Disposal of vehicles<br />
recorded at placement<br />
New driving licences acquired since<br />
placement<br />
New season tickets acquired since<br />
placement<br />
Long distance journeys between<br />
placement and the start of the Travel<br />
Week<br />
28<br />
Fuel gauge details<br />
Mileage details<br />
At pick-up, both the Fuel and Mileage chart and the Long Distance Journey records<br />
were collected, checked, and the details transferred into the CAPI questionnaire<br />
either during the interview or later on by the interviewer at home.<br />
If all household members had completed a travel record and the placement<br />
questionnaire was complete, the household was also issued with a promissory note
National Centre for Social Research<br />
which informed them of the number of £5 gift vouchers they would receive. These<br />
vouchers would then be sent to them by the operations department.<br />
The pick-up interview could be done either on the laptop, or using a paper<br />
questionnaire which was transferred into the Blaise questionnaire by the interviewer<br />
afterwards or by the operations team when paperwork was returned to the office. 6<br />
On average, the pick-up call (including the interview and checking the travel records)<br />
lasted 22.4 minutes in <strong>2003</strong> and 22.3 minutes in <strong>2004</strong>. This call was made within six<br />
days of the end of the Travel Week.<br />
3.11 Outcome coding<br />
Interviewers were required to assign an outcome code to every address in their<br />
assignment. The range of possible outcomes is shown in Figure 3.8.<br />
The fully and partially co-operating codes (11-13 and 21-23) were automatically<br />
computed by the CAPI questionnaire. For a household to be classed as fully cooperating,<br />
the placement interview had to be fully completed and filled in travel<br />
diaries had to be collected for all household members. To be classed as fully<br />
completed, the placement interview needed the household section, all individual<br />
interviews (whether in person or by proxy), and at least one vehicle section (if<br />
applicable) to be completed.<br />
The household was coded as partially co-operating if any of the following applied:<br />
• The household section of the placement questionnaire was not completed<br />
• Anyone was coded as ‘not available’ for the individual section<br />
• No vehicle questionnaire sections were complete (if applicable)<br />
• Travel records were not collected for all household members at pick-up<br />
• Any of the travel records were incomplete (e.g. missing days)<br />
6 The paper version of the pick-up questionnaire was introduced in 2002 to enable interviewers do the<br />
pick-up interview on the doorstep where respondents were unwilling to let them into the property again.<br />
29
Figure 3-8 NTS outcome codes<br />
National Centre for Social Research<br />
Outcome Code<br />
FULLY CO-OPERATING<br />
Fully productive: All desired respondent(s) in person 11<br />
Fully productive: Partly by desired respondent(s), partly by proxy 12<br />
Fully productive: By proxy 13<br />
PARTIALLY CO-OPERATING<br />
Partial productive: Desired respondent(s) 21<br />
Partial productive: Partly by desired respondent(s), partly by proxy 22<br />
Partial productive: By proxy 23<br />
NON-CONTACT<br />
No contact with anyone at address 31<br />
MULTI-HOUSEHOLDS ONLY: Contact made at address, but not with member of<br />
32<br />
selected household<br />
Contact made at selected household but not with any responsible member 33<br />
REFUSAL<br />
Office refusal 41<br />
MULTI-HOUSEHOLDS ONLY: information refused before selection of households<br />
complete (i.e. no of h’holds)<br />
42<br />
Refusal at introduction/before interview 43<br />
Refusal during interview 44<br />
Broken appointment – no recontact 45<br />
OTHER UNPRODUCTIVE<br />
Illness at home during survey period 51<br />
Absence from home/in hospital all survey period 52<br />
Physical or mental incapacity 53<br />
Language difficulties 54<br />
OFFICE APPROVAL ONLY - Lost productive 55<br />
OFFICE APPROVAL ONLY - Other unproductive 56<br />
UNKOWN ELIGIBILTY<br />
OFFICE APPROVAL ONLY - Not attempted 61<br />
OFFICE APPROVAL ONLY – Inaccessible 62<br />
OFFICE APPROVAL ONLY - Unable to locate address 63<br />
Unknown whether address contains residential housing 64<br />
Residential address – unknown whether occupied by eligible household 65<br />
Other unknown eligibility 67<br />
INELIGIBLE/DEADWOOD<br />
OFFICE APPROVAL ONLY - Unable to locate/address doesn’t exist 70<br />
Not yet built/under construction 71<br />
Demolished/derelict 72<br />
Vacant/empty 73<br />
Non-residential address e.g. business, school, office factory etc. 74<br />
Address occupied, no resident household e.g. holiday or weekend home 75<br />
Communal Establishment/Institution (no private dwellings) 76<br />
Residential, but no eligible respondent (e.g. no-one aged 16 and over) 77<br />
OFFICE USE ONLY - Address out of sample 78<br />
Other ineligible 79<br />
30
3.12 The £5 gift voucher incentive<br />
National Centre for Social Research<br />
In 2002 an experiment to test the effect of offering incentives to NTS sample<br />
members was conducted from the beginning of the July 2002 quota until the end of<br />
the December 2002 quota (see section 3.12 in the 2002 NTS <strong>Technical</strong> report, and<br />
Stratford et al. <strong>2003</strong>). This experiment found that offering an incentive did<br />
significantly increase the likelihood of gaining full household co-operation. At the end<br />
of 2002, it was decided that the incentive payment would be offered as a part of the<br />
NTS survey for <strong>2003</strong> onwards<br />
Interviewers gave each household a signed promissory note if all household<br />
members had completed the placement interview and completed a travel record.<br />
These notes promised the delivery (by post) of £5 vouchers by the operations<br />
department. Interviewers then sent their copy of the promissory note to the<br />
operations department. On receipt of the signed promissory notes, the travel diaries<br />
were inspected, and high street vouchers were sent to the household if the<br />
documents met the specified criteria of completeness.<br />
3.13 Response rates<br />
The tables below show the national response rates for <strong>2003</strong> and <strong>2004</strong>, as well as the<br />
Inner and Outer London and National (excluding London) response rates for the<br />
same periods. The overall response rate in <strong>2003</strong> was 60% but this was lower in Inner<br />
(46%) and Outer London (51%), and higher in the rest of the country (62%). In <strong>2004</strong>,<br />
the overall response rate was also 60% and was lower in Inner (43%) and Outer<br />
London (49%), and higher in the rest of the country (62%).<br />
Table 3-9 NTS National response rates in <strong>2003</strong><br />
Achieved Sample Rate Standard Response Rate<br />
Number % %<br />
Set sample 15048<br />
Additional households 147<br />
Total dealt with 15195 100<br />
Ineligible/deadwood 1412 9<br />
Unknown eligibility 201 1<br />
Eligible households 7<br />
13765 100<br />
Fully co-operating 8259 54 60<br />
Partially co-operating 1000 7 7<br />
Refusal to co-operate<br />
and other unproductive<br />
3780 25 29<br />
Non-contact 543 4 4<br />
7 The number of eligible households is estimated by assuming that the proportion eligible among those<br />
of ‘unknown eligibility’ is the same as the proportion known to be eligible among the rest of the sample.<br />
31
National Centre for Social Research<br />
Table 3-10 NTS Inner London response rates in <strong>2003</strong><br />
Achieved Sample Rate Standard Response Rate<br />
Number % %<br />
Set sample 968<br />
Additional households 76<br />
Total dealt with 1044 100<br />
Ineligible/deadwood 181 17<br />
Unknown eligibility 15 1<br />
Eligible households 862 100<br />
Fully co-operating 396 38 46<br />
Partially co-operating 84 8 10<br />
Refusal to co-operate<br />
and other unproductive<br />
276 26 33<br />
Non-contact 92 9 11<br />
Table 3-11 NTS Outer London response rates in <strong>2003</strong><br />
Achieved Sample Rate Standard Response Rate<br />
Number % %<br />
Set sample 1232<br />
Additional households 21<br />
Total dealt with 1253 100<br />
Ineligible/deadwood 99 8<br />
Unknown eligibility 16 1<br />
Eligible households 1153 100<br />
Fully co-operating 585 47 51<br />
Partially co-operating 111 9 10<br />
Refusal to co-operate<br />
and other unproductive<br />
381 30 34<br />
Non-contact 61 5 5<br />
32
National Centre for Social Research<br />
Table 3-12 NTS National excluding London response rates in <strong>2003</strong><br />
Achieved Sample Rate Standard Response Rate<br />
Number % %<br />
Set sample 12848<br />
Additional households 50<br />
Total dealt with 12898 100<br />
Ineligible/deadwood 1132 9<br />
Unknown eligibility 170 1<br />
Eligible households 11750 100<br />
Fully co-operating 7278 56 62<br />
Partially co-operating 805 6 7<br />
Refusal to co-operate<br />
and other unproductive<br />
3123 24 28<br />
Non-contact 390 3 3<br />
Table 3-13 NTS National response rates in <strong>2004</strong><br />
Achieved Sample Rate Standard Response Rate<br />
Number % %<br />
Set sample 15048<br />
Additional households 170<br />
Total dealt with 15218 100<br />
Ineligible/deadwood 1585 10<br />
Unknown eligibility 243 2<br />
Eligible households 13611 100<br />
Fully co-operating 8124 53 60<br />
Partially co-operating 898 6 7<br />
Refusal to co-operate<br />
and other unproductive<br />
3872 25 30<br />
Non-contact 496 3 4<br />
33
National Centre for Social Research<br />
Table 3-14 NTS Inner London response rates in <strong>2004</strong><br />
Achieved Sample Rate Standard Response Rate<br />
Number % %<br />
Set sample 968<br />
Additional households 111<br />
Total dealt with 1079 100<br />
Ineligible/deadwood 191 18<br />
Unknown eligibility 36 3<br />
Eligible households 885 100<br />
Fully co-operating 378 35 43<br />
Partially co-operating 92 9 10<br />
Refusal to co-operate<br />
and other unproductive<br />
287 27 35<br />
Non-contact 95 9 12<br />
Table 3-15 NTS Outer London response rates in <strong>2004</strong><br />
Achieved Sample Rate Standard Response Rate<br />
Number % %<br />
Set sample 1232<br />
Additional households 22<br />
Total dealt with 1254 100<br />
Ineligible/deadwood 155 12<br />
Unknown eligibility 18 1<br />
Eligible households 1097 100<br />
Fully co-operating 541 43 49<br />
Partially co-operating 93 7 8<br />
Refusal to co-operate<br />
and other unproductive<br />
396 32 37<br />
Non-contact 51 4 5<br />
34
National Centre for Social Research<br />
Table 3-16 NTS National excluding London response rates in <strong>2004</strong><br />
Achieved Sample Rate Standard Response Rate<br />
Number % %<br />
Set sample 12848<br />
Additional households 37<br />
Total dealt with 12885 100<br />
Ineligible/deadwood 1239 10<br />
Unknown eligibility 189 1<br />
Eligible households 11629 100<br />
Fully co-operating 7205 56 62<br />
Partially co-operating 713 6 6<br />
Refusal to co-operate<br />
and other unproductive<br />
3189 25 29<br />
Non-contact 350 3 3<br />
As mentioned in section 2.4, the NTS oversamples Inner and Outer London with the<br />
aim of achieving responding sample sizes that reflect the regional distribution without<br />
the need for corrective weighting. The degree of oversampling in both <strong>2003</strong> and<br />
<strong>2004</strong>, was based on estimates of differences in response rates between Inner<br />
London, Outer London and the rest of Great Britain and on mid-1998 population<br />
estimates.<br />
Despite oversampling, Inner and Outer London are still slightly under-represented<br />
(see Table 3-17). This will be corrected from 2006 when NTS data for 2005 and<br />
previous years will be published on a weighted basis.<br />
Table 3-17 Regional distribution of the <strong>2003</strong> and <strong>2004</strong> NTS compared with mid<br />
<strong>2003</strong> population estimates<br />
<strong>2003</strong> Achieved<br />
Sample<br />
<strong>2004</strong> Achieved<br />
sample<br />
Mid <strong>2003</strong><br />
population<br />
estimates<br />
3.14 The non-response survey<br />
Inner London Outer London Rest of GB Whole of GB<br />
(%)<br />
(%)<br />
(%)<br />
(%)<br />
4.7 7.5 87.8 100<br />
4.5 7.3 88.2 100<br />
5.0 7.7 87.2 100<br />
Non-response may bias the results of the NTS. For example, if those who do not<br />
respond to the survey are busier and do considerably more travel than those who do<br />
respond, then the amount of personal travel may be under-represented in the NTS<br />
results.<br />
To investigate this possibility, non-response information was collected using a nonresponse<br />
form to provide data on whether the characteristics of non-respondents<br />
differed to those of participants. This form gathered information about the<br />
demographic characteristics and travel behaviour of household members.<br />
35
National Centre for Social Research<br />
Interviewers were instructed to ask Non-Response Form (NRF) questions once it<br />
became apparent that an interview was not going to be achieved at that visit to the<br />
address. These questions were located at the back of the Address Record Form (see<br />
Appendix K). This meant that non-response data was available for broken<br />
appointments and for households that refused to participate. In both <strong>2003</strong> and <strong>2004</strong> a<br />
NRF was completed on the doorstep at 31 percent of refusing households.<br />
In <strong>2003</strong> and for the majority of <strong>2004</strong>, self-completion postal NRFs were left at noncontact<br />
addresses, and respondents posted these back to NatCen. In late <strong>2004</strong>, the<br />
procedure for dealing with these postal NRFs changed, with interviewers informing<br />
the operations department about a non-contact address on the Address record form,<br />
who subsequently sent out a form to the address. Response to the postal NRFs was<br />
low in both years and despite postal reminders only 23 percent of non-contacts<br />
returned an NRF in <strong>2003</strong> and 24 percent in <strong>2004</strong>.<br />
In addition, translations of the postal NRF were made into the four most common<br />
Asian languages (Gujarati, Punjabi, Urdu, and Bengali) and these were posted to<br />
households which had been unable to take part in the main survey due to inadequate<br />
English or the lack of availability of a household member able to translate or aid the<br />
interviewer.<br />
Further data were collected on non-responding households via an interviewercompleted<br />
observation form which also formed part of the ARF. This was completed<br />
at 89 percent of non-productive addresses in <strong>2003</strong> and 93 percent in <strong>2004</strong>.<br />
Weighting the data to correct for non-response bias will be introduced from 2006<br />
when NTS data for 2005 and previous years will be published on a weighted basis.<br />
3.15 Back-checking and quality control<br />
Like all NatCen projects in the field, the NTS was backchecked to ensure that<br />
interviewers were working to the standards to which they were trained and in<br />
accordance with the specific project requirements on which they were briefed.<br />
A minimum of 10% of the total productive interviews were backchecked, the majority<br />
(usually 90%) by telephone but where this was not possible (usually 10%) by letter. If<br />
the responses received indicated significant deviations from the standards set, a<br />
supervisor was asked to revisit the address/addresses concerned personally.<br />
Backchecking was carried out usually within 2 weeks, and always within 4 weeks, of<br />
the interview date.<br />
A percentage of ineligible (out of scope) addresses were also checked by letter to<br />
check the residential status of the sampled address. Of the 11 interviewers selected<br />
per month, a maximum of 4 deadwood addresses per interviewer were checked.<br />
All interviewers working on the NTS are also subject to twice yearly supervisions<br />
(one of which is a review supervision) to confirm that they are working to the highest<br />
standards.<br />
36
4 DATA PROCESSING<br />
4.1 Diary coding and entry<br />
National Centre for Social Research<br />
After collection and brief checking by interviewers, the 7 day travel diaries were<br />
returned to NatCen’s operations department where, after initial checking, they were<br />
entered into the Diary Entry System (DES) by a team of editors. The coding of data<br />
items such as journey purpose, origin and destination, method of travel, ticket type<br />
etc. took place as the data were entered into the system.<br />
The NTS Diary system is a supplementary system to the National Travel Survey. It is<br />
used for the entry and validation of data entered by respondents into their Travel<br />
diaries. The data entered are stored in a SQL server database ‘NTS_Diary’. The<br />
software was developed using Visual Basic version 5. Basic details of diaries entered<br />
into the office are recorded using the Diary Receipt program, which is also used to<br />
record a batch number.<br />
Once recorded as received into the office, travel record data were entered using the<br />
Diary Entry program. This also has a number of subsidiary screens for displaying<br />
relevant information to assist data entry, and to enter further data specific to day 7<br />
only. A screen to create journey details as a repeat or a duplicate of another journey<br />
is also provided.<br />
An export facility then transforms all the travel record data entered for a wave into<br />
text files. This is called the “Quantum Export” as the data is fed into software<br />
developed using Quantum. Following the export of the data, the text files were<br />
processed outside the NTS Diary system. An edit checking program was run on the<br />
files to do a comprehensive set of consistency checks, with a report being produced.<br />
The NTS diary system was used to rectify any validation errors reported, and the<br />
data re-exported. When the data were clean they were delivered to the survey’s<br />
sponsors, the DfT.<br />
4.2 Editing the travel record data<br />
Two extensive sets of checks were run on the travel record data. First, certain checks<br />
were applied in the DES as the travel record data were entered. These checks were<br />
put in place in order to catch keying errors and implausible or impossible data<br />
combinations. The editor either dealt with these errors immediately, or if they could<br />
not resolve them, they referred them to an experienced supervisor.<br />
Once the data were entered and coded, a second set of checks was run on the data.<br />
These checks looked for inconsistencies with the CAPI data (for example a<br />
household with no car saying they used their own car for a journey). The CAPI data<br />
were checked and, if appropriate, either these or the travel record data were altered.<br />
4.3 Geocoding of address data<br />
Up to 2001, the only information recorded on travel diaries about the origin and<br />
destination of journeys was the name of the town or village. However, in 2002 and for<br />
subsequent survey years, respondents were required to provide more details. For<br />
37
National Centre for Social Research<br />
day 7 only, respondents were asked the full address (including the postcode if they<br />
knew it) for the origin and destination of their journeys.<br />
This assignment of a postcode to the origin and destination of journeys enables<br />
further analysis of the NTS data, as it allows other coding to be applied including<br />
ward, urban/rural classification and National Transport Model (NTM) code.<br />
An external company - Gatepost Systems – is used to supply and validate postcodes<br />
from the locations recorded, using approximations as needed. The tables below give<br />
details of the level of accuracy at which Gatepost coded the destination and origin<br />
details provided in the travel diaries on day 7 in both <strong>2003</strong> and <strong>2004</strong>.<br />
Table 4-1 Accuracy of postcode validation in <strong>2003</strong><br />
Origin (%) Destinations (%)<br />
Accurate postcode - exactly<br />
matches that location<br />
88.6 88.5<br />
Very close proximity -<br />
accurate to street level<br />
3.2 3.4<br />
Accurate to locality 8.1 8.0<br />
Uncodeable (e.g. shops with<br />
no locality or town information)<br />
0.1 0.2<br />
Table 4-2 Accuracy of postcode validation in <strong>2004</strong><br />
Origin (%) Destinations (%)<br />
Accurate postcode - exactly<br />
matches that location<br />
88.1 88.3<br />
Very close proximity -<br />
accurate to street level<br />
5.3 5.2<br />
Accurate to locality 6.5 6.4<br />
Uncodeable (e.g. shops with<br />
no locality or town information)<br />
0.03 0.03<br />
4.4 Coding and editing the CAPI questionnaire data<br />
4.4.1 Examining notes<br />
If a query or problem arose during the interview, interviewers could use a function<br />
within the Blaise CAPI programme to open a ‘memo’ to record it. At the operations<br />
department, these notes were printed on paper factsheets for each household, and<br />
one of the tasks of the CAPI coders was to examine them and see whether any<br />
action needed to be taken as a result of the message.<br />
4.4.2 Back-coding other answers<br />
The next task of the CAPI coders was to examine cases where a respondent had<br />
given an ‘other answer’ to some of the pre-coded questions. During an interview, if<br />
none of the pre-codes was felt to apply to a particular question, the response would<br />
be recorded verbatim by the interviewer. All such answers were examined by coders<br />
and back-coded to one of the existing codes if applicable.<br />
38
National Centre for Social Research<br />
4.4.3 SOC & SIC coding<br />
In <strong>2003</strong> and <strong>2004</strong>, the occupation and industry of respondents aged 16 and over was<br />
coded using the Standard Occupational Classification (SOC2000) and Standard<br />
Industrial Classifications (SIC 1992). The National Statistics Socio-economic<br />
Classification (NS-SEC) was derived from SOC2000 and employment status, and<br />
was used as a social class measure. Details of the classifications are set out in<br />
Figures 4.1- 4.3.<br />
Figure 4-1 Standard Occupational Classification 2000 (SOC 2000)<br />
Description Code<br />
Corporate managers 11<br />
Managers and proprietors in agriculture and services 12<br />
Science & technology professionals 21<br />
Health professionals 22<br />
Teaching & research professionals 23<br />
Business & public service professionals 24<br />
Science & technology associate professionals 31<br />
Health & social welfare associate professionals 32<br />
Protective service occupations 33<br />
Culture, media & sports occupations 34<br />
Administrative occupations 41<br />
Secretarial & related occupations 42<br />
Skilled agricultural trades 51<br />
Skilled metal & electric trades 52<br />
Skilled construction & building trades 53<br />
Textiles, printing & other skilled trades 54<br />
Caring personal service occupations 61<br />
Leisure & other personal service occupations 62<br />
Sales occupations 71<br />
Customer service occupations 72<br />
Process, plant & machine operatives 81<br />
Transport & mobile machine drivers & operatives 82<br />
Elementary trades, plant & storage related occupations 91<br />
Elementary administration & service occupations 92<br />
Figure 4-2 Standard Industrial Classification 1992 (SIC92)<br />
Description Code<br />
Agriculture, hunting & forestry A<br />
Fishing B<br />
Mining & quarrying C<br />
Manufacturing D<br />
Electricity, gas & water supply E<br />
39
National Centre for Social Research<br />
Figure 4-2 Standard Industrial Classification 1992 (SIC92)<br />
Construction F<br />
Wholesale & retail trade; repair of motor vehicles, motorcycles & personal &<br />
household goods<br />
G<br />
Hotels & restaurants H<br />
Transport, storage & communication I<br />
Financial intermediation J<br />
Real estate, renting & business activities K<br />
Public administration & defence; compulsory social security L<br />
Education M<br />
Health & social work N<br />
Other community, social & personal service activities O<br />
Private households with employed persons P<br />
Extra-territorial organisations & bodies Q<br />
Figure 4-3 National Statistics Socio-economic Classification (NS-SEC)<br />
Analytic Classes<br />
Description Code<br />
Large employers and higher managerial occupations 1.1<br />
Higher professional occupations 1.2<br />
Lower managerial & professional occupations 2<br />
Intermediate occupations 3<br />
Small employer & own account workers 4<br />
Lower supervisory & technical occupations 5<br />
Semi-routine occupations 6<br />
Routine occupations 7<br />
4.4.4 Registration number checking<br />
Since 2002 respondents to the NTS have been asked to give the registration number<br />
of all household vehicles. The reason for this is that the more technical information<br />
about a vehicle (for example, type of fuel used, and taxation class) can be gained<br />
through the DVLA database of vehicles, rather than having to ask respondents<br />
directly. It was felt that information gained in this way would be more accurate and<br />
would mean a shorter interview. If the respondent refused to give the registration<br />
number, then questions about engine size etc. were asked directly in the interview.<br />
On the whole, respondents were willing to give their registration number – they were<br />
collected for 92 percent of vehicles in <strong>2003</strong> and 91 percent in <strong>2004</strong>. However,<br />
checking by DfT showed that around 10 percent of these were invalid numbers.<br />
Either they did not match any number on the DVLA database, or if there was a<br />
match, the vehicle make and model details on the database for that registration<br />
number were different from the details that the respondent had provided.<br />
The reason for this was investigated by re-contacting the respondents and confirming<br />
the registration number with them. Errors by interviewers accounted for at least some<br />
of the inaccuracy, for example transposition of digits and confusion of similarsounding<br />
letters. In other cases, the respondent had not remembered the registration<br />
number accurately. In <strong>2003</strong>, in 28 percent of cases, the respondent confirmed that<br />
the registration number was actually correct whilst in <strong>2004</strong>, 31 percent did. Often<br />
40
National Centre for Social Research<br />
these were new vehicles and it seems likely that the DVLA database extract used by<br />
DfT did not yet include their details (since the DVLA database extract is updated<br />
quarterly). The registration numbers were rerun at the end of the survey year to<br />
collect details for those vehicles which weren't included on the earlier DVLA data<br />
extracts. In addition, each month, members of the operations team attempted to recontact<br />
all those respondents where the registration number appeared inaccurate.<br />
They succeeded in getting a new registration number in 48 percent of cases in <strong>2003</strong>,<br />
and 49 in <strong>2004</strong>.<br />
4.4.5 Vehicle coding<br />
Each year, for each vehicle, the length of the vehicle and the size of the fuel tank<br />
needed coding. Unfortunately, neither of these details are available from the vehicle<br />
logbook or the information held by DVLA. Instead within the vehicle section of the<br />
Blaise questionnaire a database containing information obtained from car<br />
manufacturers or motoring magazines about the vehicle length and fuel tank size for<br />
different makes and models was used to code this information. This is referred to as<br />
the car-coding frame. And because car manufacturers sometimes vary the size of<br />
fuel tank fitted to a particular model depending on the year it was manufactured, the<br />
coding frame was broken down by year of manufacture.<br />
The fuel tank size was automatically assigned for most vehicles where the<br />
registration number was not given using the car-coding frame. However, if the<br />
vehicle’s make and model was not listed in this database and the respondent could<br />
not provide information on the fuel tank size, editors were required to look up the<br />
information if possible.<br />
Those respondents that gave the registration number of the vehicle were not routed<br />
through this part of the vehicle questionnaire, and therefore the fuel tank size and<br />
length were not coded at this point. For these vehicles, once the DVLA data had<br />
been extracted, a set of lookup tables were used to link the make and model code<br />
assigned to the vehicle by DVLA to the list of make and models on the car-coding<br />
frame. This was not a one to one relationship as DVLA sometimes issue several<br />
different model codes for some vehicle models.<br />
4.4.6 Distance checks and area coding<br />
From 2002, inter-county distance checks, which had been developed by DfT, were<br />
applied during editing by NatCen. If a distance between two places seemed<br />
implausible, coders were instructed to check the distance by using an atlas or webbased<br />
distance estimator (such as the RAC site). If they were able to estimate a<br />
more plausible distance (and there were no notes from interviewers explaining that,<br />
for example, the respondent took a detour), then they altered the distance.<br />
Sometimes, it was not the distance that was incorrect but the origin or destination<br />
that had been incorrectly coded, for example when two or more towns share the<br />
same name in different counties. In these instances, editors referred to the long<br />
distance journey record or checked with interviewers.<br />
Where the interviewer had been unable to allocate a code for county, unitary<br />
authority or area type for the journey origin or destination, editors were required to<br />
allocate the correct code. Where the place visited was not listed on the gazetteer<br />
41
National Centre for Social Research<br />
used in the CAPI questionnaire, they were instructed to code it to the nearest place<br />
listed that was within the same local authority.<br />
4.4.7 Data conversion<br />
The data were organised into nine record types households, individuals (two<br />
records), vehicles, long distance journeys made in the three weeks before the Travel<br />
Week (two records), days within the Travel Week, journeys made during the Travel<br />
Week, and the stages of these journeys (see Figure 4-4). Individual data variables<br />
occupied fixed column positions within these records. For ‘continuing’ variables,<br />
present in both past and present data sets, the columns occupied were the same as<br />
in previous years for compatibility with the existing DfT programmes. Column<br />
positions that were used by variables that were dropped were not re-used. New<br />
variables occupied new column positions on the same record, or if necessary, they<br />
were continued on a further record.<br />
The missing value scheme is uniform throughout and employs two minus values:<br />
• -9 signifies ‘not applicable’, i.e. when data are expected to be absent because<br />
filter conditions that apply are not met. (‘Off route’ in Blaise). This is ‘DNA’ in the<br />
database.<br />
• -8 signifies ‘non response’ for whatever reason when filter conditions are met.<br />
The distinct values in Blaise for ‘don’t know’ and ‘refused’ are thus combined into<br />
a single missing value. This is ‘NA’ in the database.<br />
The records and variables required by DfT were a sub-set of all the data available.<br />
NatCen mapped the additional data to separate data records and assembled all the<br />
data, including data for unproductives, in a single Quantum level data set, from which<br />
different data sets were exported and supplied to DfT:<br />
• The required fixed format records<br />
• SPSS data sets at each level including all available variables<br />
Figure 4-4 NTS record types, <strong>2003</strong> and <strong>2004</strong><br />
Record type Data Level<br />
Record 1 Households Household<br />
Record 2 Vehicles Vehicle<br />
Record 3 Individuals (continued on record 9) Individual<br />
Record 4 Long Distance Journeys 1 (these data occur once<br />
per individual)<br />
Individual<br />
Record 5 Long Distance Journeys (these data occur once per Journey<br />
journey)<br />
Record 6 Days Day<br />
Record 7 Journeys Journey<br />
Record 8 Stages Stage<br />
Record 9 Individuals2 (continuation of record 3) Individual<br />
42
National Centre for Social Research<br />
5 VARIABLES IN THE 2002/<strong>2003</strong> NTS DATABASE<br />
5.1 Introduction<br />
This chapter contains a detailed description of variables in the 2002/<strong>2003</strong> NTS<br />
database. The list is not meant to be exhaustive. However, most of the omitted<br />
variables are either used to calculate other variables or are not suitable for producing<br />
cross-tabulations. In addition, there are many variables on the database which have<br />
been created by aggregating categories of the variables listed here.<br />
The data are held in an eight-level hierarchical database, as shown in Figure 5.1<br />
below.<br />
Figure 5-1 The NTS 8-level hierarchical database<br />
Primary Sampling Unit (PSU)<br />
Household<br />
Individual Vehicle<br />
Long Distance trip Day<br />
43<br />
Trip<br />
Stage<br />
Over 200 variables are contained at these different levels. These can be crosstabulated<br />
across levels, although it can be difficult to draw relationships between<br />
variables in different ‘branches’ of the database, for example, between vehicle level<br />
variables and individual or stage level variables.<br />
Variables that contain quantitative data, such as age and stage distance, are banded<br />
for convenience in data extraction. However, the majority of these are also available<br />
as unbanded numeric variables. The banded variables normally have variable<br />
numbers 1 higher than the numeric variable to which they relate. For example,<br />
variable v93 contains actual milometer readings from respondents’ vehicles and<br />
variable v94 bands these together into 15 groups (‘Up to 2000 miles’, ‘2001-4000<br />
miles’ and so on). Banded variables that are based upon numeric variables are<br />
marked as such in their full listing.<br />
The vast majority of NTS variables are single-coded (i.e only one answer is given to<br />
the question by the respondent). However, some variables are multi-coded. An<br />
example is i314 (Difficulties with car trips), where more than one answer can be<br />
given. Multi-coded variables are marked as such in the definitions given below. There<br />
are also some variables for which more than one set of information may need to be
National Centre for Social Research<br />
recorded. For example, where an individual has more than one special ticket/pass,<br />
information is collected on each ticket/pass. In these cases, information on each<br />
season ticket/pass is stored in a different variable (e.g. I185, I191, I197 etc).<br />
Variables can have up to two values that can be defined as not available: ‘NA’ and<br />
‘DNA’.<br />
NA (not available) indicates that the value is missing or unknown. In most cases,<br />
data are imputed into the final dataset using a variety of procedures (see below).<br />
DNA (does not apply) indicates that the question was not asked of some<br />
respondents. Block routing in the questionnaire means that certain questions are<br />
skipped when they clearly do not apply to a respondent. For example, someone 10<br />
years of age would not be asked whether he/she was employed; someone who<br />
responded that they were unemployed would not be asked what problems they<br />
encountered on their trip to work.<br />
Where questions were unanswered, or where specific details of trips were omitted,<br />
data is imputed, providing there is a reasonably sound basis for doing so. This stage,<br />
known as ‘patching’, is applied to all key variables to simplify analyses.<br />
The patching process relies entirely on the available information in the survey data<br />
set. No attempt is made to constrain the final distribution in the sample to conform<br />
with other data sources.<br />
Most missing values are patched using automatic rules, although some are examined<br />
on a case by case basis to enable a sensible estimate to be made. The automatic<br />
rules are of two broad types:<br />
Related variables – this method uses variables that provide related information<br />
about the respondent, and uses these values to select the best estimate. For<br />
example, if a vehicle’s taxation class was not provided, it could be assumed by<br />
examining the vehicle type.<br />
‘Hotdecking’ – this method uses related variables to find another record in the<br />
dataset that is similar, in all significant respects, to the record to be patched. The<br />
missing value is then patched using the value from the related record.<br />
In addition to cross-tabulating NTS variables in any combination, variables can also<br />
be used as filters, to perform tabulations on a subset of the sample, for example<br />
those under 16.<br />
To ease the burden on respondents, we ask that respondents record short walk<br />
stages (walks of less than one mile) only on the seventh day of their travel record. To<br />
compensate for this, short walk trips on the seventh day are weighted by a factor of<br />
seven.<br />
With the above exception, there is currently no other weighting of NTS data.<br />
However, following the NTS Quality Review 2000, work has been undertaken to<br />
weight the data for known sources of survey bias. Weighted data will be made<br />
available from 2006 (see section 9.6).<br />
The remainder of this chapter is structured as follows:<br />
44
5.2 List of the main variables<br />
5.3 Primary Sampling Unit variables<br />
5.4 Household variables<br />
5.5 Vehicle variables<br />
5.6 Individual variables<br />
5.7 Long-distance trip variables<br />
5.8 Trip variables<br />
5.9 Stage variables<br />
National Centre for Social Research<br />
Within each subsection, variables are grouped by topic, and the following information<br />
is given, where appropriate:<br />
Sources: for all NTS derived variables, the reference numbers of the source<br />
variables are given. Similarly, where variables are derived from more than one<br />
question in the questionnaire, this is explained.<br />
Definitions: where technical definitions are implicit in the design of the questions or<br />
the coding of the variables, these definitions are explained.<br />
Imputation: where records in the variable have been imputed, a short description of<br />
the imputation used is included.<br />
Banded variables: where the variable is a banded version of an unbanded numeric<br />
variable, this information is shown, along with the reference number of the original<br />
variable.<br />
Modular variables: some questions are asked only every other year. Variables<br />
based upon these questions are identified as such.<br />
In the tables below the first column lists the name of the value within each variable.<br />
The second column gives the number of records with this value in the 2002/<strong>2003</strong><br />
combined database. The third column gives this count as a percentage of all records.<br />
Records with no value for the variable (either ‘NA’ or ‘DNA’), are excluded from the<br />
total for this purpose<br />
45
5.2 List of main variables<br />
PSU (Primary Sampling Unit)<br />
variables<br />
Area geography<br />
P2 Government Office Region<br />
P5 Type of area<br />
P6 PSU population density<br />
P7 LA population density<br />
P15 County of residence<br />
P17 Stratum code<br />
P18 UA of residence<br />
Concessionary fares schemes<br />
P10 Type of concession<br />
P12 Times available<br />
P13 Areas available<br />
P14 Modes additional to bus<br />
Household variables<br />
Address<br />
H12n Address type<br />
H50 Type of tenancy<br />
H51 Length of residence<br />
H134 Why move to current address<br />
H135 Main reason for moving<br />
H148 Importance of public transport in<br />
choice of home<br />
H154 Type of area<br />
Accessibility of public transport<br />
H13 Walk time to bus stop<br />
H14 Frequency of bus service<br />
H15 Walk time to railway station<br />
H16 Bus time to railway station<br />
H17 Type of railway station<br />
H136 Rail/metro/tram stop closer than<br />
railway<br />
National Centre for Social Research<br />
46<br />
H137 Walk time to LU/light rail/tram<br />
stop<br />
H138 Bus time to LU/light rail/tram<br />
stop<br />
Accessibility of services<br />
H18 Walk time to doctor’s surgery<br />
H19 Bus time to doctor’s surgery<br />
H20 Walk time to nearest Post Office<br />
H21 Bus time to nearest Post Office<br />
H22 Walk time to nearest chemist<br />
H23 Bus time to nearest chemist<br />
H24 Walk time to nearest food store<br />
H25 Bus time to nearest food store<br />
H26 Walk time to nearest shopping<br />
centre<br />
H27 Bus time to nearest shopping<br />
centre<br />
H28 Walk time to nearest general<br />
hospital<br />
H29 Bus time to nearest general<br />
hospital<br />
Household vehicle access<br />
H35 Number of bicycles<br />
H52 Number of household three and<br />
four wheeled cars<br />
H53 Number of motorcycles<br />
H54 Number of vans/lorries<br />
H55 Number of cars/light vans<br />
H56 Car/light van availability<br />
H57 Household vehicle availability<br />
H63 Persons with full car license<br />
H107 Number of household company<br />
cars<br />
Household composition<br />
H58 Number of people in household<br />
H59 Household structure (family)<br />
H60 Household structure<br />
H61 Household structure (NTS)<br />
H62 Disabled adult in household<br />
H74 Number of adults<br />
H75 Number of children
Social and economic<br />
H65 HRP working status<br />
H66 HRP employment status<br />
H69 HRP Industry type<br />
H70 Household Income<br />
H83 Employed in household<br />
H84 Real household income<br />
equivalent semi-deciles (2002-03<br />
basis)<br />
H85 Real household income<br />
equivalent quintiles (2002-03 basis)<br />
H108 ACORN classification<br />
H121 Index of multiple deprivation<br />
H132 Household working structure<br />
H151 Index of multiple deprivation<br />
(<strong>2004</strong> basis)<br />
Opinions of local transport options<br />
H122 Rate the frequency of local<br />
buses<br />
H123 Rate the reliability of local buses<br />
H124 Rate the frequency of<br />
trains/underground/metro<br />
H125 Rate the reliability of<br />
trains/underground/metro<br />
H126 Rate the quality of local<br />
pavements<br />
H127 Rate the provision of local cycle<br />
lane/paths<br />
Shopping<br />
H139 Ordering by phone, post or<br />
internet<br />
H140 How often delivered<br />
H141 Goods in last delivery<br />
H142 How goods were ordered<br />
H143 How bought otherwise<br />
H147 Reasons for no main food<br />
shopping<br />
Rail and bus tickets<br />
H149 Combined rail and bus tickets<br />
available in area<br />
National Centre for Social Research<br />
47<br />
Vehicle level variables<br />
Vehicle Reference<br />
V92 Rank of car in household<br />
VI3 Gender of main driver<br />
VI6P Pensionable status of main driver<br />
Vehicle details<br />
V3 Type of vehicle<br />
V15 Taxation class<br />
V87 Engine capacity<br />
V91 Age<br />
V130 Make and model<br />
V150 Car adapted for disabled driver<br />
V164 CO2 emissions<br />
Mileage<br />
V46 Estimate of annual mileage<br />
V94 Total mileage<br />
V96 Mileage in Travel Week<br />
V98 Eligible mileage<br />
V121 Ineligible mileage<br />
V122 Reasons for ineligible mileage<br />
V140 Annual vehicle commuting<br />
mileage<br />
V142 Annual vehicle business mileage<br />
V144 Annual vehicle private mileage<br />
Vehicle registration<br />
V85 Registration - ownership<br />
V89 Registration letter<br />
V90 Year of first registration<br />
V103 Purchase/hire costs<br />
V112 Company car summary<br />
V131 Month of registration<br />
Fuel<br />
V88 Type of fuel<br />
V100 Fuel purchased<br />
V102 Fuel cost<br />
V135 Fuel consumed
Parking<br />
V145 Parking – overnight location<br />
V146 Parking – distance from house<br />
V147 Type of parking payment<br />
V149 Annual parking fee<br />
Delivery of goods<br />
V155 Frequency of delivery of goods<br />
in course of work<br />
V156 Number of delivery points<br />
Travel outside GB<br />
V158 Number of miles outside GB<br />
V159 Purpose of trip outside GB<br />
V161 Number of miles in NI<br />
V162 Purpose of trip in NI<br />
Individual level variables<br />
Personal details<br />
I2 Relationship to household reference<br />
person<br />
I3 Gender<br />
I6 Age<br />
I268 Legal marital status<br />
I269 Living arrangements<br />
I277 Why no spouse in household<br />
I275 Ethnic group<br />
Social and economic<br />
I79 Industry type<br />
I80 Employee/self-employed<br />
I177 Working status<br />
I178 Individual income<br />
I243 Government training scheme<br />
I245 Unpaid work for family business<br />
I276 Responsibility for supervising<br />
other employees<br />
I397 Employment status<br />
I398 NS-SEC<br />
National Centre for Social Research<br />
48<br />
Unemployment<br />
I244 Away from work whilst on training<br />
scheme<br />
I247 Looking for work/training in last 4<br />
weeks<br />
I248 Immediate availability for<br />
government training scheme<br />
I249 Why not available for work<br />
I250 Left last paid job<br />
I300 Turned down job because of<br />
transport difficulties<br />
I301 Transport difficulties preventing<br />
work<br />
Work travel benefits<br />
I302 Travel benefits at work<br />
I303 Travel benefits offered to me<br />
I304 Use free/reduced price bus<br />
tickets<br />
I305 Use free/reduced price train<br />
tickets<br />
I306 Use interest free travel loan<br />
I307 Use employer’s bus/van<br />
I308 Alternative to company car<br />
I395 Use interest free loan for parking<br />
season ticket<br />
I396 Use cut price or free car parking<br />
Tickets and passes<br />
I106/I126/I146/I357/I358/I359<br />
Ticket/pass mode(s)<br />
I185/I191/I197/I342/I347/I352<br />
Ticket/pass type<br />
I186/I192/I198/I343/I348/I353<br />
Ticket/pass mode priority<br />
I187/I192/I199/I344/I349/I354<br />
Ticket/pass validity<br />
I189/I195/I201/I346/I351/I356<br />
Ticket/pass use<br />
I205/I206/I207/I360/I361/I362<br />
Ticket/pass weekly cost
Travel difficulties<br />
I165 Travel difficulties<br />
I212 Disabled drivers<br />
I214 Years since last drove<br />
I290 Why difficult to use a bus<br />
I314 Difficulties with car trips<br />
I315 Most difficult problem with car<br />
trips<br />
I363 Difficulties travelling by foot<br />
I364 Disability causes difficulties in<br />
using local bus<br />
I292 Special transport services<br />
available<br />
Travel to work<br />
I92 Workplace<br />
I180 Usual means of travel to work<br />
I220 County of work<br />
I267 Work Place UA<br />
I270 Work place urban/rural<br />
I316 Travel to work another day.<br />
I317 Why difficult to travel to work<br />
another way<br />
I318 Most difficult problem with<br />
travelling another way<br />
I319 Any difficulties travelling to work<br />
by other modes<br />
I320 Most difficult problem travelling<br />
by other modes<br />
I321 Car unused while at work<br />
I322 Why don’t use car for work<br />
I323 Main reason don’t use car for<br />
work<br />
Driving<br />
I182 Driving licence<br />
I183 Driving experience<br />
I203 Access to car<br />
Home working<br />
I257 Work at home instead of usual<br />
workplace<br />
I258 Day of week worked at home<br />
I309 Possible to work at home?<br />
I310 How often work at home?<br />
I311 Why not work at home (more<br />
often)?<br />
National Centre for Social Research<br />
49<br />
I312 Possible to work at home without<br />
telephone<br />
I313 Possible to work at home without<br />
computer<br />
Public transport use<br />
I261 Frequency of bus use<br />
I262 Frequency of express bus/coach<br />
use<br />
I263 Frequency of surface rail use<br />
I264 Frequency of taxi/minicab use<br />
I266 Frequency of domestic air flights<br />
use<br />
Cycling<br />
I265 Frequency of bicycle use<br />
I271 Own or use a bicycle<br />
I272 Ridden a bicycle in the last 12<br />
months<br />
I273 Where did you cycle<br />
School travel<br />
I278 Daily school trip<br />
I280 How far to school (time)<br />
I282 How far to school (distance)<br />
I283 Method of school travel<br />
I284 Accompanied to school by an<br />
adult<br />
I285 Reason accompanied to school<br />
I286 Age first accompanied to school<br />
I287 Reason accompanied to school<br />
before allowed alone<br />
I288 Allowed to cross roads<br />
I289 Allowed to cross main roads<br />
Walking<br />
I293 Frequency of walking<br />
I294 Where respondent walked<br />
I296 Time walk took<br />
I298 Distance walked<br />
I299 Method of travel to start of walk<br />
Shopping
I324 Usual mode when travelling for<br />
main food shopping<br />
I325 Difficulties with car travel for main<br />
food shopping<br />
I326 Most difficult problem with<br />
car/travel for main food shopping<br />
I327 Main food shopping another way<br />
I328 Why difficult to do main shopping<br />
another way<br />
I329 Main difficulty to do main<br />
shopping another way<br />
I330 Difficulties with public transport<br />
for main food shopping<br />
I331 Main difficulty with public<br />
transport for main food shopping<br />
I332 Car unused while doing main<br />
food shopping<br />
I333 Why car not used for main food<br />
shopping<br />
I334 Main reason why car not used for<br />
main food shopping<br />
Difficulties accessing services<br />
I335 Any other travel difficulties<br />
I336 Difficulties with travel to<br />
doctor/hospital<br />
I337 Difficulties with travel to<br />
friends/relatives<br />
I338 Difficulties with travel to social<br />
activities<br />
I339 Difficulties with travel with<br />
children to school<br />
I340 Difficulties with travel to<br />
college/university<br />
I341 Difficulties with other travel<br />
Playing in the street<br />
I366/I372/I378/I384/I390 Playtime start<br />
time<br />
I368/I374/I380/I386/I392 Playtime end<br />
time<br />
I370/I376/I382/I388/I394 Playtime<br />
elapsed time<br />
Long distance trip level variables<br />
L3 Calendar month<br />
L5 Origin (county)<br />
National Centre for Social Research<br />
50<br />
L6 Destination (county)<br />
L7 Purpose to<br />
L8 Mode of transport<br />
L10 Distance<br />
L12 Purpose<br />
L13 Purpose from<br />
L14 Origin (UA)<br />
L15 Destination (UA)<br />
L16 Urban/rural coding of origin<br />
L17 Urban/rural coding of destination<br />
Trip level variables<br />
Reference<br />
J52 Day (of week)<br />
Trip type<br />
J14 Series of calls<br />
J23 Number of stages<br />
J37 Short walk<br />
Trip mode and purpose<br />
J24 Purpose from<br />
J26 Purpose to<br />
J28 Purpose<br />
J36 Main mode of transport<br />
Trip time and distance<br />
J30 Overall travelling time<br />
J31 Start time<br />
J33 Overall trip time<br />
J34 Trip length<br />
J40 Overall speed<br />
J41 Mean travel speed<br />
J56 Mid-point time<br />
J60 End time<br />
J61 Hours when trip was in progress<br />
Origin and destination<br />
J57 Origin (county)<br />
J58 Destination (county)<br />
J63 Origin (UA)<br />
J64 Destination (UA)<br />
J65 Urban/rural coding of origin<br />
J66 Urban/rural coding of destination
Cost<br />
J62 Total cost of public transport trip<br />
Stage level variables<br />
Stage details<br />
S2 Mode of transport<br />
S15 Number of boardings<br />
S24 Means of travel<br />
S26 Length of stage<br />
S27 Stage speed<br />
S28 Short walk<br />
S37 Travel time<br />
Number in party<br />
S8a Number in party (adults)<br />
S8c Number in party (children)<br />
S8t Number in party (total)<br />
Private vehicles<br />
S18 Private vehicle occupant<br />
S19 Where parked<br />
S21 Parking cost (pence)<br />
Tickets and costs<br />
S30 Ticket cost (1)<br />
S32 Ticket cost (2)<br />
S34 Total cost<br />
S35 Type of ticket<br />
National Centre for Social Research<br />
51<br />
VARIABLE DETAILS<br />
5.3 PSU level variables<br />
These variables describe the 1,368<br />
postcode sectors (or sector groups)<br />
that represent the primary sampling<br />
units (PSUs) from which the sample of<br />
households was selected in 2002 and<br />
<strong>2003</strong> (684 in each year).<br />
The survey months run mid-month to<br />
mid-month. Up to 2001, data were<br />
presented on a calendar year basis.<br />
There were therefore some PSUs in<br />
the December quota that contained<br />
households with Travel Weeks in<br />
December of that year, and others with<br />
Travel Weeks in January of the<br />
following year.<br />
From 2002 onwards, the survey has<br />
used ‘survey years’ as its basis for<br />
data extractions. So, for example,<br />
‘survey year’ 2002 includes all<br />
households sampled from mid-January<br />
2002 to mid-January <strong>2003</strong>.<br />
The value of a PSU variable applies to<br />
all households living within that PSU.<br />
Unlike almost all other variables in the<br />
survey, the PSU variables were not<br />
derived from information provided by<br />
members of the sampled households.
Area geography<br />
P2 Government Office Region<br />
1 North East Met 26 1.9%<br />
2 North East Non-Met 34 2.5%<br />
3 NW & Merseyside Met 92 6.7%<br />
4 NW & Merseyside<br />
Non-met<br />
68 5.0%<br />
5 Yorkshire &<br />
Humberside Met<br />
78 5.7%<br />
6 Yorkshire &<br />
Humberside Non-met<br />
38 2.8%<br />
7 East Midlands 97 7.1%<br />
8 West Midlands Met 60 4.4%<br />
9 West Midlands Non- 60 4.4%<br />
met<br />
10 Eastern 124 9.1%<br />
11 Greater London 200 14.6%<br />
12 South East 184 13.5%<br />
13 South West 115 8.4%<br />
14 Wales 68 5.0%<br />
15 Scotland Met 59 4.3%<br />
16 Scotland Non-Met 65 4.8%<br />
Total 1368 100%<br />
P2 is an aggregation of P15.<br />
A variable (P2g) is available which<br />
aggregates these categories to GORs<br />
and countries. Where appropriate, the<br />
metropolitan areas and remainders are<br />
distinguished within regions. The<br />
metropolitan areas are included in<br />
regions as follows:<br />
- North East (Tyneside met.)<br />
- NW and Merseyside<br />
(Manchester, Liverpool met.)<br />
- Yorks and Humber (West<br />
Yorkshire met.)<br />
- West Midlands (West Midlands<br />
met.)<br />
- Scotland (Glasgow met.)<br />
P5 Area Type<br />
1 Inner London 88 6.4%<br />
2 Outer London b/u area 140 10.2%<br />
3 West Midlands b/u<br />
area<br />
51 3.7%<br />
4 Greater Manchester<br />
b/u area<br />
60 4.4%<br />
National Centre for Social Research<br />
52<br />
P5 Area Type<br />
5 West Yorkshire b/u<br />
area<br />
33 2.4%<br />
6 Glasgow b/u area 17 1.2%<br />
7 Liverpool b/u area 23 1.7%<br />
8 Tyneside b/u area 22 1.6%<br />
9 Other urban over 250K 165 12.1%<br />
10 Other urban over<br />
100K to 250K<br />
140 10.2%<br />
11 Other urban over 50K<br />
to 100K<br />
117 8.6%<br />
12 Other urban over 25K<br />
to 50K<br />
112 8.2%<br />
13 Other urban over 10K<br />
to 25K<br />
160 11.7%<br />
14 Other urban over 3K<br />
to 10K<br />
112 8.2%<br />
16 Rural 128 9.4%<br />
Total 1368 100%<br />
NTS urban/rural analyses are now<br />
done at the household level using<br />
variable h154. Variable p5 is still<br />
available but is no longer used. It is<br />
included here for information and for<br />
consistency with previous years. (See<br />
H154 for definition of area type.)<br />
P6 PSU Population density (pers/hec)<br />
1 Under 1 133 9.7%<br />
2 1 to 4.99 208 15.2%<br />
3 5 to 9.99 130 9.5%<br />
4 10 to 14.99 102 7.5%<br />
5 15 to 19.99 111 8.1%<br />
6 20 to 24.99 90 6.6%<br />
7 25 to 29.99 88 6.4%<br />
8 30 to 34.99 80 5.8%<br />
9 35 to 39.99 80 5.8%<br />
10 40 to 44.99 64 4.7%<br />
11 45 to 49.99 59 4.3%<br />
12 50 to 59.99 70 5.1%<br />
13 60 to 74.99 59 4.3%<br />
14 75 and over 94 6.9%<br />
Total 1368 100%<br />
P6 is derived from 1991 Census<br />
figures and represents an approximate<br />
estimate of the number of<br />
persons per hectare for the sector. It is<br />
derived taken from the<br />
sampling frame.
P7 LA Population density (pers/hec)<br />
1 Under 1 139 10.2%<br />
2 1 to 1.99 161 11.8%<br />
3 2 to 3.49 132 9.6%<br />
4 3.5 to 4.99 82 6.0%<br />
5 5 to 9.99 197 14.4%<br />
6 10 to 14.99 133 9.7%<br />
7 15 to 19.99 72 5.3%<br />
8 20 to 24.99 88 6.4%<br />
9 25 to 34.99 161 11.8%<br />
10 35 to 44.99 87 6.4%<br />
11 45 and over 116 8.5%<br />
Total 1368 100%<br />
P7 is derived from 1991 Census<br />
figures and represents an approximate<br />
estimate of the number of people living<br />
in private households per hectare in<br />
the local authority. It is more reliable<br />
than the PSU density estimate in P6.<br />
However, it relates to a much larger<br />
area and is,<br />
therefore, less closely matched to the<br />
neighbourhoods<br />
of the sampled addresses.<br />
P15 County of residence<br />
1 Avon 17 1.2%<br />
2 Bedfordshire 14 1.0%<br />
3 Berkshire 16 1.2%<br />
4 Buckinghamshire 12 0.9%<br />
5 Cambridgeshire 19 1.4%<br />
6 Cheshire 22 1.6%<br />
7 Cleveland 10 0.7%<br />
8 Cornwall 4 0.3%<br />
9 Cumbria 19 1.4%<br />
10 Derbyshire 21 1.5%<br />
11 Devon 32 2.3%<br />
12 Dorset 12 0.9%<br />
13 Durham 11 0.8%<br />
14 East Sussex 14 1.0%<br />
15 Essex 34 2.5%<br />
16 Gloucestershire 17 1.2%<br />
17 Greater Manchester 59 4.3%<br />
18 Hampshire 37 2.7%<br />
19 Hereford and<br />
15 1.1%<br />
Worcester<br />
20 Hertfordshire 16 1.2%<br />
21 Humberside 20 1.5%<br />
22 Isle of Wight 3 0.2%<br />
23 Kent 37 2.7%<br />
National Centre for Social Research<br />
53<br />
P15 County of residence<br />
24 Lancashire 27 2.0%<br />
25 Leicestershire 19 1.4%<br />
26 Lincolnshire 20 1.5%<br />
27 London Central 3 0.2%<br />
28 Other Inner London 85 6.2%<br />
31 Other London not 112 8.2%<br />
Central<br />
32 Merseyside 33 2.4%<br />
33 Norfolk 18 1.3%<br />
34 Northamptonshire 10 0.7%<br />
35 Northumberland 13 1.0%<br />
36 North Yorkshire 18 1.3%<br />
37 Nottinghamshire 27 2.0%<br />
38 Oxfordshire 18 1.3%<br />
39 Shropshire 9 0.7%<br />
40 Somerset 18 1.3%<br />
41 South Yorkshire 30 2.2%<br />
42 Staffordshire 23 1.7%<br />
43 Suffolk 15 1.1%<br />
44 Surrey 12 0.9%<br />
45 Tyne and Wear 26 1.9%<br />
46 Warwickshire 13 1.0%<br />
47 West Midlands 60 4.4%<br />
48 West Sussex 22 1.6%<br />
49 West Yorkshire 48 3.5%<br />
50 Wiltshire 15 1.1%<br />
51 Clwyd 10 0.7%<br />
52 Dyfed 11 0.8%<br />
53 Gwent 9 0.7%<br />
54 Gwynedd 5 0.4%<br />
55 Mid Glamorgan 15 1.1%<br />
56 Powys 1 0.1%<br />
57 South Glamorgan 8 0.6%<br />
58 West Glamorgan 9 0.7%<br />
59 Borders 3 0.2%<br />
60 Central 10 0.7%<br />
61 Dumfries and 1 0.1%<br />
Galloway<br />
62 Fife 8 0.6%<br />
63 Grampian 12 0.9%<br />
64 Highlands 4 0.3%<br />
65 Lothian 19 1.4%<br />
66 Strathclyde 59 4.3%<br />
67 Tayside 8 0.6%<br />
68 Essex within M25 2 0.1%<br />
69 Hertfordshire within<br />
M25<br />
6 0.4%<br />
70 Kent within M25 1 0.1%<br />
71 Surrey within M25 12 0.9%<br />
Total 1368 100%<br />
P15 describes PSUs under the former<br />
system of counties, and are included<br />
for consistency with older data. P18 is
now used for analyses, where<br />
appropriate.<br />
P17 Stratum code<br />
1 Inner London – East 56 4.1%<br />
2 Inner London – West 32 2.3%<br />
3 Outer London – East<br />
and North East<br />
40 2.9%<br />
4 Outer London – South 30 2.2%<br />
5 Outer London – West<br />
and North West<br />
42 3.1%<br />
6 Devon and Cornwall 36 2.6%<br />
7 North Somerset, Bath,<br />
North East Somerset,<br />
Somerset and Dorset<br />
37 2.7%<br />
8 Bristol, South<br />
Gloucestershire,<br />
Gloucestershire and<br />
Dorset<br />
42 3.1%<br />
9 Oxfordshire,<br />
Buckinghamshire and<br />
Berkshire<br />
46 3.4%<br />
10 Hampshire and the<br />
Isle of Wight<br />
40 2.9%<br />
11 Kent 38 2.8%<br />
12 West Sussex and<br />
East Sussex<br />
36 2.6%<br />
13 Surrey 24 1.8%<br />
14 Essex 36 2.6%<br />
15 Cambridgeshire,<br />
Suffolk and Norfolk<br />
52 3.8%<br />
16 Hertfordshire and<br />
Bedfordshire<br />
36 2.6%<br />
17 Leicestershire,<br />
Lincolnshire and<br />
Northamptonshire<br />
49 3.6%<br />
18 Warwickshire and<br />
Hereford and Worcester<br />
28 2.0%<br />
19 West Midlands 60 4.4%<br />
20 Shropshire and<br />
Staffordshire<br />
32 2.3%<br />
21 Nottinghamshire and<br />
Derbyshire<br />
48 3.5%<br />
22 Cheshire 22 1.6%<br />
23 Merseyside 33 2.4%<br />
24 Greater Manchester 59 4.3%<br />
25 Lancashire and<br />
Cumbria<br />
46 3.4%<br />
26 South Yorkshire 30 2.2%<br />
27 West Yorkshire 48 3.5%<br />
28 North Yorkshire and<br />
Humberside<br />
38 2.8%<br />
29 Cleveland, County<br />
Durham and<br />
Northumberland<br />
34 2.5%<br />
30 Tyne and Wear 26 1.9%<br />
National Centre for Social Research<br />
54<br />
P17 Stratum code<br />
31 Anglesey, Gwynedd,<br />
Conwy, Denbighshire,<br />
Flintshire, Wrexham,<br />
Powys<br />
32 Carmarthenshire,<br />
Neath Port Talbot,<br />
Pembrokeshire,<br />
Swansea<br />
33 Blaenau Gwent,<br />
Caerphilly,<br />
Monmouthshire,<br />
Newport, Torfaen<br />
34 Bridgend, Cardiff,<br />
Merthyr Tydfil, Rhondda<br />
Cynon Taff, Glamorgan<br />
35 Grampian, Highland,<br />
Argyll and Bute<br />
36 Tayside, Fife and<br />
Central<br />
37 Edinburgh, Lothian<br />
and Borders<br />
38 Glasgow and<br />
Dunbartonshire<br />
20 1.5%<br />
16 1.2%<br />
14 1.0%<br />
18 1.3%<br />
20 1.5%<br />
26 1.9%<br />
22 1.6%<br />
20 1.5%<br />
39 Lanarkshire,<br />
Renfrewshire and<br />
Inverclyde<br />
24 1.8%<br />
40 Ayrshire and<br />
Dumfries & Galloway<br />
12 0.9%<br />
Total 1368 100%<br />
These 40 strata can be used to<br />
provide data at a sub-regional level.<br />
However, due to the relatively small<br />
sample size of the NTS, data are<br />
aggregated over a number of years for<br />
subregional analyses.<br />
P18 UA of residence<br />
<strong>2003</strong> only<br />
1 Bath and North East<br />
Somerset<br />
2 0.3%<br />
2 Bedfordshire 1 0.1%<br />
3 Blackburn with Darwen 1 0.1%<br />
4 Blackpool 1 0.1%<br />
5 Bournemouth 2 0.3%<br />
6 Bracknell Forest 1 0.1%<br />
7 Brighton and Hove 3 0.4%<br />
8 Bristol, City of 3 0.4%<br />
9 Buckinghamshire 5 0.7%<br />
10 Cambridgeshire 7 1.0%<br />
11 Cheshire 10 1.5%<br />
12 Cornwall and Isles of 2 0.3%<br />
Scilly<br />
13 Cumbria 10 1.5%<br />
14 Darlington 1 0.1%
P18 UA of residence<br />
15 Derby 3 0.4%<br />
16 Derbyshire 9 1.3%<br />
17 Devon 13 1.9%<br />
18 Dorset 5 0.7%<br />
19 Durham 4 0.6%<br />
20 East Riding of<br />
Yorkshire<br />
2 0.3%<br />
21 East Sussex 5 0.7%<br />
22 Essex (area outside<br />
M25)<br />
14 2.0%<br />
23 Essex (area within 1 0.1%<br />
M25)<br />
24 Gloucestershire 9 1.3%<br />
25 Greater Manchester 29 4.2%<br />
26 Halton 0 0.0%<br />
27 Hampshire 12 1.8%<br />
28 Hartlepool 1 0.1%<br />
29 Herefordshire 5 0.7%<br />
30 Hertfordshire (area<br />
outside M25)<br />
11 1.6%<br />
31 Hertfordshire (area<br />
within M25)<br />
3 0.4%<br />
32 Inner London 24 3.5%<br />
33 Isle of Wight 2 0.3%<br />
34 Kent (area outside<br />
M25)<br />
17 2.5%<br />
35 Kent (area within<br />
M25)<br />
1 0.1%<br />
36 Kingston upon Hull,<br />
City of<br />
3 0.4%<br />
37 Lancashire 11 1.6%<br />
38 Leicester 2 0.3%<br />
39 Leicestershire 7 1.0%<br />
40 Lincolnshire 11 1.6%<br />
41 London Central 20 2.9%<br />
42 London Outer 56 8.2%<br />
43 Luton 3 0.4%<br />
44 Medway Towns 1 0.1%<br />
45 Merseyside 17 2.5%<br />
46 Middlesbrough 0 0.0%<br />
47 Milton Keynes 2 0.3%<br />
48 Newbury 0 0.0%<br />
49 Norfolk 10 1.5%<br />
50 North East<br />
2 0.3%<br />
Lincolnshire<br />
51 North Lincolnshire 3 0.4%<br />
52 North Somerset 2 0.3%<br />
53 North Yorkshire 6 0.9%<br />
54 Northamptonshire 4 0.6%<br />
55 Northumberland 6 0.9%<br />
56 Nottingham 5 0.7%<br />
57 Nottinghamshire 7 1.0%<br />
58 Oxfordshire 6 0.9%<br />
59 Peterborough 1 0.1%<br />
60 Plymouth 1 0.1%<br />
National Centre for Social Research<br />
55<br />
P18 UA of residence<br />
61 Poole 0 0.0%<br />
62 Portsmouth 3 0.4%<br />
63 Reading 1 0.1%<br />
64 Redcar & Cleveland 2 0.3%<br />
65 Rutland 0 0.0%<br />
66 Shropshire 2 0.3%<br />
67 Slough 2 0.3%<br />
68 Somerset 8 1.2%<br />
69 South<br />
1 0.1%<br />
Gloucestershire<br />
70 South Yorkshire 15 2.2%<br />
71 Southampton 3 0.4%<br />
72 Southend on Sea 2 0.3%<br />
73 Staffordshire 6 0.9%<br />
74 Stockton-on-Tees 3 0.4%<br />
75 Stoke-on-Trent 5 0.7%<br />
76 Suffolk 8 1.2%<br />
77 Surrey (area outside<br />
M25)<br />
6 0.9%<br />
78 Surrey (area within 6 0.9%<br />
M25)<br />
79 Swindon 2 0.3%<br />
80 The Wrekin 3 0.4%<br />
81 Thurrock 1 0.1%<br />
82 Torbay 2 0.3%<br />
83 Tyne and Wear 13 1.9%<br />
84 Warrington 1 0.1%<br />
85 Warwickshire 7 1.0%<br />
86 West Midlands 30 4.4%<br />
87 West Sussex 10 1.5%<br />
88 West Yorkshire 24 3.5%<br />
89 Wiltshire 6 0.9%<br />
90 Windsor &<br />
Maidenhead<br />
3 3.0%<br />
91 Wokingham 3 0.4%<br />
92 Worcestershire 2 0.3%<br />
93 York 3 0.4%<br />
94 Aberdeen City 4 0.6%<br />
95 Aberdeenshire 1 0.1%<br />
96 Angus 2 0.3%<br />
97 Argyll and Bute 3 0.4%<br />
98 Clackmannshire 1 0.1%<br />
99 Dumfries & Galloway 1 0.1%<br />
100 Dundee, City of 1 0.1%<br />
101 East Ayrshire 2 0.3%<br />
102 East Dunbartonshire 1 0.1%<br />
103 East Lothian 1 0.1%<br />
104 East Renfrewshire 3 0.4%<br />
105 Edinburgh, City of 5 0.7%<br />
106 Falkirk 3 0.4%<br />
107 Fife 3 0.4%<br />
108 Glasgow, City of 6 0.9%<br />
109 Highland 2 0.3%<br />
110 Inverclyde 0 0.0%
P18 UA of residence<br />
111 Midlothian 2 0.3%<br />
112 Moray 0 0.0%<br />
113 North Ayrshire 3 0.4%<br />
114 North Lanarkshire 3 0.4%<br />
115 Orkney Islands 0 0.0%<br />
116 Perth and Kinross 1 0.1%<br />
117 Renfrewshire 2 0.3%<br />
118 Scottish Borders 1 0.1%<br />
119 Shetland Islands 0 0.0%<br />
120 South Ayrshire 0 0.0%<br />
121 South Lanarkshire 4 0.6%<br />
122 Stirling 2 0.3%<br />
123 West<br />
3 0.4%<br />
Dunbartonshire<br />
124 West Lothian 2 0.3%<br />
125 Western Isles 0 0.0%<br />
126 Blaenau Gwent 1 0.1%<br />
127 Bridgend 1 0.1%<br />
128 Caerphilly 3 0.4%<br />
129 Cardiff 2 0.3%<br />
130 Carmarthenshire 2 0.3%<br />
131 Ceredigion 2 0.3%<br />
132 Conwy 0 0.0%<br />
133 Denbighshire 3 0.4%<br />
134 Flintshire 1 0.1%<br />
135 Gwynedd 1 0.1%<br />
136 Isle of Anglesey 1 0.1%<br />
137 Merthyr Tydfil 3 0.4%<br />
138 Monmouthshire 2 0.3%<br />
139 Neath and Port 2 0.3%<br />
Talbot<br />
140 Newport 1 0.1%<br />
141 Pembrokeshire 2 0.3%<br />
142 Powys 1 0.1%<br />
143 Rhondda, Cynon, 2 0.1%<br />
Taff<br />
144 Swansea 0 0.3%<br />
145 Torfaen 2 0.0%<br />
146 Vale of Glamorgan 1 0.3%<br />
147 Wrexham 0 0.1%<br />
Total 684 100%<br />
Concessionary fares schemes<br />
Variables P8-P14 contain information<br />
on concessionary fare schemes for<br />
pensioners within PSUs. As these<br />
schemes have changed over time<br />
some of these variables are no longer<br />
used.<br />
Variable P8 (availability of<br />
concessionary bus fares for<br />
National Centre for Social Research<br />
56<br />
pensioners) is no longer used as, from<br />
2002, all local authorities were obliged<br />
to provide an OAP concessionary bus<br />
fare scheme.<br />
P9 (eligibility of concessionary bus<br />
fare schemes for pensioners) is no<br />
longer used as, from <strong>2003</strong>, all areas in<br />
England, Wales and Scotland were<br />
obliged to provide schemes for all<br />
persons aged 60 and above.<br />
P11 (membership fee for<br />
concessionary bus fare scheme for<br />
pensioners) is no longer used as all<br />
schemes which were recorded were<br />
free schemes.<br />
P10 Type of concession<br />
1 Free fare 490 33.6%<br />
2 Flat fare 144 10.5%<br />
3 Half fare 710 54.2%<br />
4 Two-thirds fare 0 0.0%<br />
5 Other reduced fare 24 1.8%<br />
6 Tokens: up to £15 0 0.0%<br />
7 Tokens: £15.01 to £30 0 0.0%<br />
8 Tokens: over £30 0 0.0%<br />
9 Tokens: value<br />
unspecified/variable<br />
0 0.0%<br />
10 Mixture of fares and 0 0.0%<br />
tokens<br />
11 Other type 0 0.0%<br />
Total 1368 100%<br />
P10 gives the type of concession was<br />
that which was available to all persons<br />
aged 60 and above at no cost. In<br />
special cases, where different<br />
schemes were offered to 60-64 year<br />
olds and to those aged 65 and above,<br />
the LA was coded according to the<br />
scheme for those aged 65 and above.<br />
In a number of cases, the concession<br />
varies for different types of people<br />
within the overall qualifying group. The<br />
category ‘other reduced fare’ includes<br />
schemes offering varying levels of fare<br />
reduction, as well as reductions not<br />
specified in other categories<br />
The value applied to households was<br />
the value for the appropriate LA. For<br />
PSUs containing households in more
than one LA, the value taken for the<br />
PSU was the value for the LA to which<br />
the highest number of addresses were<br />
coded.<br />
P12 Times available<br />
1 Anytime 542 39.6%<br />
2 Peak hours only 0 0.0%<br />
3 Off-peak only 29 2.1%<br />
4 Mixture of peak, off- 796 58.2%<br />
peak<br />
5 Other time restrictions 1 0.1%<br />
Total 1368 100%<br />
Peak hours are defined here as 6.30-<br />
9.00am and 4.00-6.30pm on<br />
weekdays. The value applied to<br />
households was the value for the<br />
appropriate LA. For PSUs containing<br />
households in more than one LA, the<br />
value taken for the PSU was the value<br />
for the LA to which the highest number<br />
of addresses were coded.<br />
P13 Areas available<br />
1 District only or less 172 12.6%<br />
2 Above district, not<br />
countywide<br />
149 10.9%<br />
3 Countywide 879 64.3%<br />
4 Above county 72 5.3%<br />
5 Other area restriction 96 7.0%<br />
Total 1368 100%<br />
This defines the area of travel over<br />
which the scheme applies. The area is<br />
also likely to define residential<br />
qualifications in the great majority of<br />
cases. District-wide schemes include<br />
parish council schemes that applied in<br />
the area administered by the district<br />
council. Category 2 includes cases in<br />
which adjacent districts combine to<br />
provide a scheme that does not<br />
operate throughout the county.<br />
The value applied to households was<br />
the value for the appropriate LA. For<br />
PSUs containing households in more<br />
than one LA, the value taken for the<br />
PSU was the value for the LA to which<br />
the highest number of addresses were<br />
coded.<br />
National Centre for Social Research<br />
57<br />
P14 Modes additional to bus<br />
2002 only<br />
1 None 316 47.0%<br />
2 Public services only 268 39.8%<br />
3 Private / voluntary<br />
services only<br />
70 10.4%<br />
4 Both private / voluntary 19 2.8%<br />
and public<br />
5 Other 0 0.0%<br />
Total 673 100%<br />
NA 11<br />
Some bus schemes permit members’<br />
concessionary travel on other modes.<br />
Private/voluntary services include<br />
independently operated services such<br />
as social car schemes, and a variety of<br />
community transport such as dial-aride.<br />
5.4 Household variables<br />
In 2002/03, there were 15,695 fully<br />
responding households in the NTS<br />
sample, (7,437 in 2002 and 8,258 in<br />
<strong>2003</strong>).<br />
The NTS defines a household as a<br />
single person or a group of people<br />
who use the sampled address as their<br />
only or main residence and either<br />
share one meal a day or share the<br />
living accommodation (a living room or<br />
sitting room). Where people have<br />
more than one address, they are<br />
included if the sampled address is<br />
their stated main residence. However,<br />
adult children who come home only for<br />
holidays are excluded; a household<br />
member (such as a member of the<br />
armed services) away continuously for<br />
six months or more is excluded;<br />
anyone continuously in residence for<br />
six months or more (such as an au<br />
pair) is included.<br />
The household reference person<br />
General information about each<br />
household was collected at the initial<br />
interview from the household<br />
reference person (see below), spouse,<br />
or in some cases, another responsible
adult, using the household<br />
questionnaire. The household<br />
reference person is defined as follows:<br />
- In households with a sole<br />
householder, that person is the<br />
household reference person.<br />
- In households with joint<br />
householders, the person with<br />
the highest income is the<br />
household reference person.<br />
- If two or more householders<br />
have exactly the same income,<br />
the elder is the household<br />
reference person.<br />
Additional household variables were<br />
derived from information collected on<br />
the individual and vehicle<br />
questionnaires.<br />
Address type<br />
H12n Address Type<br />
1 House/bungalow<br />
(detached)<br />
3669 23.4%<br />
2 House/bungalow<br />
(semi-detached)<br />
5106 32.5%<br />
3 House/bungalow<br />
(terrace/end terrace)<br />
4230 27.0%<br />
4 House/bungalow (type<br />
unknown)<br />
1 0.0%<br />
5 Flat/maisonette<br />
(purpose built)<br />
2122 13.5%<br />
6 Flat/maisonette (nonpurpose<br />
built)<br />
445 2.8%<br />
7 Flat/maisonette (type<br />
unknown)<br />
1 0.0%<br />
8 Other accommodation<br />
type<br />
121 0.8%<br />
Total 15695 100%<br />
This describes the residential unit<br />
occupied by the household. A<br />
household living in a converted flat in a<br />
semi-detached house would be<br />
considered to be living in the flat, not<br />
the house, as the former is their<br />
residential unit. A flat is generally<br />
distinguished from rooms by having all<br />
its rooms contained behind one front<br />
door.<br />
National Centre for Social Research<br />
58<br />
Missing values are imputed from the<br />
type of tenure, the household size, and<br />
the pensionable status of the head of<br />
household.<br />
H50 Type of tenancy<br />
1 Own outright 5097 32.5%<br />
2 Buying with mortgage 6037 38.5%<br />
3 Part rent / part<br />
mortgage<br />
83 0.5%<br />
4 Rent 4296 27.4%<br />
5 Live rent free 181 1.2%<br />
6 Squatting 1 0.0%<br />
Total 15695 100%<br />
Missing values for H50 are imputed<br />
based on data for households with<br />
similar values for H12, H60 and H70.<br />
H51 Length of residence<br />
1 Under 1 yr (over 1<br />
mile)<br />
1008 6.4%<br />
2 Under 1 yr (under 1<br />
mile)<br />
451 2.9%<br />
3 1 under 2 years 1168 7.4%<br />
4 2 under 3 years 1052 6.7%<br />
5 3 under 5 years 1671 10.6%<br />
6 5 under 10 years 2631 16.8%<br />
7 10+ years 3324 21.2%<br />
8 Always lived here 4389 28.0%<br />
9 Under 1 year (miles<br />
NA)<br />
1 0.0%<br />
Total 15695 100%<br />
This variable indicates the number of<br />
years the HRP has lived at the<br />
address.<br />
The distinction between categories 1,<br />
2 and 9 is made by asking the<br />
distance moved from the respondent’s<br />
previous residence.<br />
Missing values are imputed from the<br />
age/sex of the household reference<br />
person.<br />
Respondents who had moved in the<br />
last three years were also asked why<br />
they moved (H134), their main reason<br />
for moving (H135) and the importance<br />
of the availability of public transport in
the local area when choosing their<br />
home (H148).<br />
H134 Why move to current address<br />
1 Better neighbourhood 866 23.6%<br />
2 Change of<br />
employment<br />
333 9.1%<br />
3 Closer to work/school 456 12.4%<br />
4 Closer to family/friends 537 14.6%<br />
5 Closer to shops/leisure<br />
facilities<br />
158 4.3%<br />
6 Better public transport 116 3.2%<br />
7 Larger or better<br />
house/flat<br />
960 26.1%<br />
8 Smaller or cheaper<br />
house/flat<br />
338 9.2%<br />
9 Moved in/split up with<br />
partner<br />
428 11.6%<br />
10 Wanted to buy 374 10.2%<br />
11 To live independently 458 12.5%<br />
12 Other reason 427 11.6%<br />
Total 3677 100%<br />
NA 3<br />
DNA 12015<br />
H135 Main reason for moving<br />
1 Better neighbourhood 488 13.3%<br />
2 Change of<br />
employment<br />
244 6.6%<br />
3 Closer to work/school 242 6.6%<br />
4 Closer to family/friends 301 8.2%<br />
5 Closer to shops/leisure<br />
facilities<br />
26 0.7%<br />
6 Better public transport 23 0.6%<br />
7 Larger or better<br />
house/flat<br />
654 17.8%<br />
8 Smaller or cheaper<br />
house/flat<br />
211 5.7%<br />
9 Moved in/split up with<br />
partner<br />
343 9.3%<br />
10 Wanted to buy 233 6.3%<br />
11 To live independently 321 8.7%<br />
12 Other reason 590 16.1%<br />
Total 3676 100%<br />
NA 4<br />
DNA 12015<br />
H148 Importance of public transport in<br />
choice of home<br />
1 Very important 840 22.9%<br />
2 Fairly important 778 21.2%<br />
3 Not very important 866 23.6%<br />
National Centre for Social Research<br />
59<br />
H148 Importance of public transport in<br />
choice of home<br />
4 Not at all important 1183 32.3%<br />
Total 3667 100%<br />
NA 13<br />
DNA 12015<br />
H154 Type of area<br />
1 Inner London 727 4.6%<br />
2 Outer London built-up<br />
area<br />
1339 8.5%<br />
3 West Midlands built-up<br />
area<br />
590 3.8%<br />
4 Greater Manchester<br />
built-up area<br />
621 4.0%<br />
5 West Yorkshire builtup<br />
area<br />
380 2.4%<br />
6 Glasgow built-up area 161 1.0%<br />
7 Liverpool built-up area 251 1.6%<br />
8 Tyneside built-up area 257 1.6%<br />
9 Other urban over 250K 1737 11.1%<br />
10 Other urban over<br />
100K to 250K<br />
1601 10.2%<br />
11 Other urban over 50K<br />
to 100K<br />
1217 7.8%<br />
12 Other urban over 25K<br />
to 50K<br />
1299 8.3%<br />
13 Other urban over 10K<br />
to 25K<br />
1786 11.4%<br />
14 Other urban over 3K<br />
to 10K<br />
1163 7.4%<br />
15 Rural 2566 16.3%<br />
Total 15695 100%<br />
Variable H154 is based on the<br />
definition of urban areas at the timeof<br />
the 2001 Population Census. In simple<br />
terms, an urban area is a continuous<br />
built-up area, of at least 20 hectares<br />
and with at least 1,500 residents. Each<br />
NTS household was assigned to an<br />
urban/rural category using a look-up<br />
file from their postcode to the H154<br />
urban/rural category.<br />
Accessibility of public transport<br />
H13-H17 and H136-H138 describe the<br />
neighbourhood in terms of the nearest<br />
public transport. Information relates to<br />
the nearest stop/station, even if this is<br />
not the one normally used.
Interviewers are advised that anyone<br />
in the household can answer these<br />
questions, if it is felt that they have a<br />
better knowledge of local services than<br />
the HRP.<br />
These questions are measures of fact,<br />
not of opinion. Interviewers are<br />
encouraged to make use of<br />
information other than that provided by<br />
the household if this provides a more<br />
accurate indication of the true position.<br />
‘Walk time’ assumes a walk speed of<br />
three miles per hour, and takes no<br />
account of, for example, any infirmity<br />
or disability of the respondent.<br />
Where a respondent replies that they<br />
do not know how far away facilities<br />
are, they are encouraged to provide<br />
their best estimate.<br />
H13 Walk time to bus stop<br />
1 6 minutes or less 13521 86.1%<br />
2 7-13 minutes 1578 10.1%<br />
3 14-26 minutes 420 2.7%<br />
4 27-43 minutes 75 0.5%<br />
5 44 minutes or more 101 0.6%<br />
Total 15695 100%<br />
H14 Frequency of bus service<br />
1 Less than once a day 143 0.9%<br />
2 At least once a day 1087 6.9%<br />
3 At least 1 an hour 3070 19.6%<br />
4 At least 1 every half<br />
hour<br />
5800 37.0%<br />
5 At least 1 every<br />
quarter hour<br />
5595 35.6%<br />
Total 15695 100%<br />
H15 Walk time to railway station<br />
1 6 minutes or less 957 6.1%<br />
2 7-13 minutes 1487 9.5%<br />
3 14-26 minutes 3846 24.5%<br />
4 27-43 minutes 2749 17.5%<br />
5 44 minutes or longer 6656 42.4%<br />
Total 15695 100%<br />
H16 Bus time to railway station<br />
1 No bus/quicker to walk 4157 26.5%<br />
National Centre for Social Research<br />
60<br />
H16 Bus time to railway station<br />
2 6 minutes or less 1163 7.4%<br />
3 7-13 minutes 2350 15.0%<br />
4 14-26 minutes 4341 27.7%<br />
5 27 to 43 minutes 2210 14.1%<br />
6 44 minutes or longer 1474 9.4%<br />
Total 15695 100%<br />
H17 Type of railway station<br />
1 Frequent service all<br />
day<br />
13848 88.2%<br />
2 Frequent service rush<br />
hour only<br />
656 4.2%<br />
3 Less frequent service 1191 7.6%<br />
Total 15695 100%<br />
H136 Light rail / metro / tram stop closer<br />
than railway<br />
1 London Underground 683 59.4%<br />
2 Metro 292 25.4%<br />
3 Light Rail 74 6.4%<br />
4 Tram 100 8.7%<br />
Total 1149 100%<br />
None 14525<br />
NA 21<br />
H137 Walk time to LU/light rail/tram stop<br />
1 6 mins or less 335 29.2%<br />
2 7-13 mins 312 27.2%<br />
3 14-26 mins 337 29.4%<br />
4 27-43 mins 78 6.8%<br />
5 44 mins or longer 85 7.4%<br />
Total 1147 100%<br />
NA / DNA 14548<br />
H138 Bus time to LU/light rail/tram stop<br />
1 No bus / quicker to<br />
walk<br />
548 47.9%<br />
2 6 minutes or less 52 4.5%<br />
3 7-13 minutes 67 5.9%<br />
4 14-26 minutes 247 21.6%<br />
5 27-43 minutes 227 19.9%<br />
6 44 minutes 2 0.2%<br />
Total 1143 100%<br />
NA / DNA 14552<br />
The questions which define H137 and<br />
H138 are only asked where there is a<br />
tube/light rail/tram stop closer than the<br />
nearest surface railway station.
Accessibility of services<br />
Variables H18-H29 describe the<br />
neighbourhood in terms of the<br />
available amenities. Some of these<br />
questions are rotated, and were<br />
therefore asked either in 2002 or in<br />
<strong>2003</strong>.<br />
As above, walking speed is assumed<br />
to be three miles per hour.<br />
H18 Walk distance to doctor’s surgery<br />
2002 only – modular<br />
1 6 minutes or less 1222 16.5%<br />
2 7-13 minutes 1478 19.9%<br />
3 14-26 minutes 2296 31.0%<br />
4 27-43 minutes 1074 14.5%<br />
5 44 minutes or more 1345 18.1%<br />
Total 7415 100%<br />
NA/DNA 8280<br />
H19 Bus time to doctor’s surgery<br />
2002 only – modular<br />
1 No bus service /<br />
quicker to walk<br />
National Centre for Social Research<br />
3704 50.2<br />
%<br />
2 6 minutes or less 939 12.7<br />
%<br />
3 7-13 minutes 988 13.4<br />
%<br />
4 14-26 minutes 1129 15.3<br />
%<br />
5 27-43 minutes 416 5.6%<br />
6 44 minutes or more 202 2.7%<br />
Total 7378 100%<br />
NA/DNA 8317<br />
H20 Walk distance to nearest Post Office<br />
<strong>2003</strong> only, modular<br />
1 6 minutes or less 3333 40.4%<br />
2 7-13 minutes 2609 31.7%<br />
3 14-26 minutes 1756 21.3%<br />
4 27-43 minutes 339 4.1%<br />
5 44 minutes or more 205 2.5%<br />
Total 8242 100%<br />
NA/DNA 7453<br />
H21 Bus distance to nearest Post Office<br />
<strong>2003</strong> only, modular<br />
1 No bus service /<br />
quicker to walk<br />
6320 77.0%<br />
61<br />
2 6 minutes or less 897 10.9%<br />
3 7-13 minutes 629 7.7%<br />
4 14-26 minutes 293 3.6%<br />
5 27-43 minutes 49 0.6%<br />
6 44 minutes or more 17 0.2%<br />
Total 8205 100%<br />
NA/DNA 7490<br />
H22 Walk distance to nearest chemist<br />
2002 only, modular<br />
1 6 minutes or less 2286 30.8%<br />
2 7-13 minutes 2102 28.3%<br />
3 14-26 minutes 1901 25.6%<br />
4 27-43 minutes 501 6.7%<br />
5 44 minutes or more 640 8.6%<br />
Total 7430 100%<br />
NA/DNA 8265<br />
H23 Bus time to nearest chemist<br />
2002 only, modular<br />
1 No bus service /<br />
quicker to walk<br />
4567 61.8<br />
2 6 minutes or less 1190 16.1<br />
3 7-13 minutes 803 10.9<br />
4 14-26 minutes 597 8.1<br />
5 27-43 minutes 172 2.3<br />
6 44 minutes or more 62 0.8<br />
Total 7391 100%<br />
NA/DNA 8304<br />
H24 Walk time to nearest food store<br />
1 6 minutes or less 8835 56.3%<br />
2 7-13 minutes 3892 24.8%<br />
3 14-26 minutes 2069 13.2%<br />
4 27-43 minutes 476 3.0%<br />
5 44 minutes or more 413 2.6%<br />
Total 15685 100%<br />
NA 10<br />
H25 Bus time to nearest food store<br />
1 No bus service/quicker<br />
to walk<br />
12232 78.4%<br />
2 6 minutes or less 1884 12.1%<br />
3 7-13 minutes 889 5.7%<br />
4 14-26 minutes 437 2.8%<br />
5 27-43 minutes 104 0.7%<br />
6 44 minutes or more 56 0.4%<br />
Total 15602 100%<br />
NA 93
H26 Walk time to nearest shopping centre<br />
<strong>2003</strong> only, modular<br />
1 6 minutes or less 787 9.5%<br />
2 7-13 minutes 1329 16.1%<br />
3 14-26 minutes 2669 32.4%<br />
4 27-43 minutes 1390 16.8%<br />
5 44 minutes or more 2075 25.2%<br />
Total 8250 100%<br />
NA/DNA 7445<br />
H27 Bus time to nearest shopping centre<br />
<strong>2003</strong> only, modular<br />
1 No bus service/quicker<br />
to walk<br />
2291 27.9%<br />
2 6 minutes or less 773 9.4%<br />
3 7-13 minutes 1812 22.1%<br />
4 14-26 minutes 2365 28.8%<br />
5 27-43 minutes 712 8.7%<br />
6 44 minutes or more 257 3.1%<br />
Total 8210 100%<br />
NA/DNA 7485<br />
H28 Walk time to nearest general hospital<br />
2002 only, modular<br />
1 6 minutes or less 182 2.5%<br />
2 7-13 minutes 329 4.5%<br />
3 14-26 minutes 972 13.2%<br />
4 27-43 minutes 1056 14.3%<br />
5 44 minutes or more 4845 65.6%<br />
Total 7384 100%<br />
NA/DNA 8311<br />
H29 Bus time to nearest general hospital<br />
2002 only, modular<br />
1 No bus service/quicker<br />
to walk<br />
1074 14.6%<br />
2 6 minutes or less 244 3.3%<br />
3 7-13 minutes 645 8.8%<br />
4 14-26 minutes 1831 24.9%<br />
5 27-43 minutes 1754 23.8%<br />
6 44 minutes or more 1810 24.6%<br />
Total 7358 100%<br />
NA/DNA 8337<br />
Household vehicle access<br />
The number of bicycles covers all nonmotorised<br />
bicycles or tricycles (other<br />
than toy cycles) in the household’s<br />
possession and used by members of<br />
the household aged six or older.<br />
National Centre for Social Research<br />
62<br />
Missing values are imputed from the<br />
number of bicycle trips made in the<br />
Travel Week, and the number of<br />
children in the household.<br />
H35 Number of bicycles<br />
1 No bikes 8339 53.1%<br />
2 One bike 3408 21.7%<br />
3 Two bikes 2376 15.1%<br />
4 Three bikes 912 5.8%<br />
5 Four bikes 536 3.4%<br />
6 Five or more bikes 124 0.8%<br />
Total 15695 100%<br />
Variables H52-H55 are derived from<br />
variable V3. These variables are<br />
counts of the numbers of vehicles of<br />
various types owned or in regular use<br />
by the household (including any not in<br />
use at the time but which might come<br />
into use in the next month).<br />
Motorcycles (H53) include motor<br />
scooters, sidecar combinations and<br />
mopeds.<br />
Cars/light vans (H55) include threewheeled<br />
vehicles, light vans, Land<br />
Rovers, Jeeps (or similar vehicles),<br />
minibuses, motor caravans and<br />
dormobiles.<br />
H52 Number of household 3 and 4<br />
wheeled cars<br />
1 None 4460 28.4%<br />
2 One 7375 47.0%<br />
3 Two 3374 21.5%<br />
4 Three 419 2.7%<br />
5 Four 52 0.3%<br />
6 Five or more 15 0.1%<br />
Total 15695 100%
H53 Number of motorcycles<br />
1 None 15268 97.3%<br />
2 One 373 2.4%<br />
3 Two 42 0.3%<br />
4 Three or more 12 0.1%<br />
Total 15695 100%<br />
H54 Number of vans/lorries<br />
1 None 14959 95.3%<br />
2 One 701 4.5%<br />
3 Two 30 0.2%<br />
4 Three 5 0.0%<br />
5 Four 0 0.0%<br />
6 Five or more 0 0.0%<br />
Total 15695 100%<br />
H55 Number of cars/light vans<br />
1 None 4223 26.9%<br />
2 One 6944 44.2%<br />
3 Two 3852 24.5%<br />
4 Three 566 3.6%<br />
5 Four 80 0.5%<br />
6 Five or more 30 0.2%<br />
Total 15695 100%<br />
H56 Car/light van availability<br />
1 Car/light van (including<br />
pool car)<br />
11438 72.9%<br />
2 Only new car/light van 19 0.1%<br />
3 Only “Possibly come<br />
into use”<br />
52 0.3%<br />
4 No car/light van<br />
available<br />
4185 26.7%<br />
Total 15694 100%<br />
NA 1<br />
H56 is derived from the vehicle<br />
questionnaire. It distinguishes<br />
households with vehicles that are in<br />
everyday use throughout the Travel<br />
Week from those which are acquired<br />
during the week, and from those which<br />
are unavailable (eg. broken down) at<br />
the time of the placement interview,<br />
but which may be usable by the last<br />
day of the Travel Week.<br />
National Centre for Social Research<br />
63<br />
H57 Household vehicle availability<br />
1 Three or more<br />
cars/vans<br />
676 4.3%<br />
2 Two cars/vans 3852 24.5%<br />
3 One car/van (private) 6470 41.2%<br />
4 One car/van (not<br />
private)<br />
469 3.0%<br />
5 Company pool car only 37 0.2%<br />
6 Two wheel motor<br />
vehicles only<br />
33 0.2%<br />
7 Other motor vehicles<br />
only<br />
6 0.0%<br />
8 One or more bicycles<br />
only<br />
960 6.1%<br />
9 No vehicles 3192 20.3%<br />
Total 15695 100%<br />
H57 is derived from variables V3, V15<br />
and H35.<br />
Missing values are imputed from the<br />
count of household motor vehicles and<br />
the count of household bicycles.<br />
H63 Persons with full car licence<br />
1 None 3329 21.2%<br />
2 One 5636 35.9%<br />
3 Two 5995 38.2%<br />
4 Three 612 3.9%<br />
5 Four or more 123 0.8%<br />
Total 15695 100%<br />
H63 is derived from variable I182. The<br />
count includes holders of licences for<br />
car only or for car and motorcycle.<br />
H107 Number of household company cars<br />
1 None 14783 94.2%<br />
2 One 846 5.4%<br />
3 Two 62 0.4%<br />
4 Three 2 0.0%<br />
5 Four 2 0.0%<br />
Total 15695 100%<br />
H107 is derived from variable V112.
Household composition<br />
All members of a household were<br />
required to complete a travel record.<br />
The size of the household is,<br />
therefore, equivalent to the number of<br />
responding individuals in the sample.<br />
For household variables, a child is<br />
defined as somebody aged 0-15;<br />
anyone aged 16+ is defined as an<br />
adult. Adult children refer to children of<br />
the HRP aged 16+.<br />
H58 Number of people in household<br />
1 4651 29.6%<br />
2 5791 36.9%<br />
3 2256 14.4%<br />
4 2023 12.9%<br />
5 705 4.5%<br />
6 194 1.2%<br />
7 45 0.3%<br />
8 19 0.1%<br />
9 6 0.0%<br />
10 5 0.0%<br />
Total 15695 100%<br />
H59 Household structure (family)<br />
1 2 adults youngest child<br />
0-4<br />
1456 9.3%<br />
2 1 adult youngest child<br />
0-4<br />
302 1.9%<br />
3 2 adults youngest child<br />
5-12<br />
1507 9.6%<br />
4 1 adult youngest child<br />
5-12<br />
401 2.6%<br />
5 2 adults youngest child<br />
13-15<br />
513 3.3%<br />
6 1 adult youngest child<br />
13-15<br />
88 0.6%<br />
7 Family adult child(ren) 1516 9.7%<br />
8 Adults include parent<br />
of HRP<br />
121 0.8%<br />
9 Pensioner household 4453 28.4%<br />
10 Other household 5338 34.0%<br />
Total 15695 100%<br />
Missing values are imputed from the<br />
working status of the individuals in the<br />
household.<br />
National Centre for Social Research<br />
64<br />
H60 Household structure<br />
1 Single person under<br />
65<br />
2375 15.1%<br />
2 Single person 65 and<br />
older<br />
2276 14.5%<br />
3 Two people, HRP<br />
under 30<br />
554 3.5%<br />
4 Two people, HRP 30-<br />
64<br />
3284 20.9%<br />
5 Two people, HRP 65+ 1953 12.4%<br />
6 Three persons (1-2<br />
children)<br />
1281 8.2%<br />
7 Three adults 975 6.2%<br />
8 Four people (2-3<br />
children)<br />
1384 8.8%<br />
9 Four people (1 child) 313 2.0%<br />
10 Four adults 326 2.1%<br />
11 Five or more people<br />
(3+ children)<br />
596 3.8%<br />
12 Five or more people<br />
(1-2 children)<br />
287 1.8%<br />
13 Five or more adults 91 0.6%<br />
Total 15695 100%<br />
H61 Household structure (NTS)<br />
1 1 man under 65 1241 7.9%<br />
2 1 man 65 and over 656 4.2%<br />
3 1 woman under 60 898 5.7%<br />
4 1 woman 60 and over 1856 11.8%<br />
5 1 man, 1 child 26 0.2%<br />
6 1 woman, 1 child 381 2.4%<br />
7 1 man, 2+ children 21 0.1%<br />
8 1 woman, 2+ children 363 2.3%<br />
9 1 man, 1 woman (HRP<br />
pensioner)<br />
1979 12.6%<br />
10 1 man, 1 woman<br />
(HRP not pensioner)<br />
3059 19.5%<br />
11 2 men or 2 women 346 2.2%<br />
12 1 man, 1 woman, 1<br />
child<br />
978 6.2%<br />
13 2 men or 2 women, 1<br />
child<br />
40 0.3%<br />
14 1 man, 1 woman, 2<br />
children<br />
1281 8.2%<br />
15 2 men or 2 women, 2<br />
children<br />
17 0.1%<br />
16 1 man, 1 woman, 3<br />
children<br />
379 2.4%<br />
17 2 men or 2 women, 3 5 0.0%<br />
children<br />
18 2 adults, 4 children 86 0.5%<br />
19 2 adults, 5 children 15 0.1%<br />
20 2 adults, 6 children 6 0.0%<br />
21 2 adults, 7+ children 3 0.0%
H61 Household structure (NTS)<br />
22 3 adults 975 6.2%<br />
23 3 adults, 1 child 313 2.0%<br />
24 3 adults, 2 children 145 0.9%<br />
25 3 adults, 3 children 38 0.2%<br />
26 3 adults, 4+ children 8 0.1%<br />
27 4 adults 326 2.1%<br />
28 4 adults, 1 child 84 0.5%<br />
29 4 adults, 2+ children 43 0.3%<br />
30 5 adults 68 0.4%<br />
31 5 adults, 1+ children 27 0.2%<br />
32 All other, no children 23 0.1%<br />
33 All other with children 9 0.1%<br />
Total 15695 100%<br />
Household structure variables H59-<br />
H61 are derived from I2-I6 and I177.<br />
H62 Disabled adult in household<br />
1 HRP only 2647 16.9%<br />
2 Spouse/cohabitee only 786 5.0%<br />
3 Child only 56 0.4%<br />
4 Parent only 85 0.5%<br />
5 Other person only 38 0.2%<br />
6 HRP and<br />
449 2.9%<br />
spouse/cohabitee<br />
7 Other (2 or more) 105 0.7%<br />
8 None disabled 11529 73.5%<br />
Total 15695 100%<br />
H62 is derived from variables I2, I5<br />
(the numeric variable that defines I6)<br />
and I165. The NTS use the term<br />
‘disabled’ to describe a person who<br />
has difficulty, for reasons of longstanding<br />
poor health or physical<br />
disability, in using buses or cars or in<br />
going out of the house on foot. This<br />
includes problems attributable to old<br />
age.<br />
H74 Number of adults<br />
1 5442 34.7%<br />
2 8194 52.2%<br />
3 1479 9.4%<br />
4 453 2.9%<br />
5 95 0.6%<br />
6 24 0.2%<br />
7 or more 8 0.1%<br />
Total 15695 100%<br />
National Centre for Social Research<br />
65<br />
H75 Number of children<br />
1 0 11427 72.8%<br />
2 1 1843 11.7%<br />
3 2 1743 11.1%<br />
4 3 524 3.3%<br />
5 4 120 0.8%<br />
6 5 25 0.2%<br />
7 6 or more 13 0.1%<br />
Total 15695 100%<br />
Social and economic<br />
H65 HRP working status<br />
1 Full time 7829 49.9%<br />
2 Part time 1211 7.7%<br />
3 Unemployed 237 1.5%<br />
4 Retired/ permanently<br />
sick<br />
5437 34.6%<br />
5 Student 144 0.9%<br />
6 Looking after<br />
home/family<br />
652 4.2%<br />
7 Other non-working 185 1.2%<br />
Total 15695 100%<br />
H65 is derived from the HRP’s<br />
response to I177.<br />
H66 Employment status<br />
1 Self employed 1763 11.2%<br />
2 Employed manager 2045 13.0%<br />
3 Other employee 11370 72.4%<br />
4 Never worked 517 3.3%<br />
Total 15695 100%<br />
H66 is derived from I2, I78 and I80.<br />
H69 HRP Industry type<br />
1 Agriculture etc. 278 1.9%<br />
2 Fishing 15 0.1%<br />
3 Mining, quarrying 185 1.2%<br />
4 Manufacturing 3106 20.7%<br />
5 Energy, water 237 1.6%<br />
6 Construction 1223 8.1%<br />
7 Wholesale, retail and<br />
motor trade<br />
1809 12.0%<br />
8 Hotels and restaurants 495 3.3%<br />
9 Transport, storage and<br />
communication<br />
1196 8.0%<br />
10 Financial 591 3.9%
H69 HRP Industry type<br />
11 Real estate, renting<br />
and business activities<br />
1541 10.3%<br />
12 Public administration<br />
and defence<br />
1165 7.8%<br />
13 Education 1159 7.7%<br />
14 Health and social<br />
work<br />
1399 9.3%<br />
15 Other community,<br />
social and personal<br />
544 3.6%<br />
16 Private households<br />
with employed persons<br />
71 0.5%<br />
17 Extra-territorial<br />
organisations<br />
7 0.0%<br />
18 Workplace outside<br />
UK<br />
0 0.0%<br />
Total 15021 100%<br />
NA 166<br />
DNA 508<br />
For the purposes of H65-H66 and<br />
H68-H69, the household is classified<br />
according to the characteristics or the<br />
circumstances of the HRP, and is<br />
derived from I79. ‘Unemployed’<br />
combines those waiting for and looking<br />
for a job.<br />
H70 Household income<br />
1 Less than £1000 92 0.6%<br />
2 £1000-£1999 104 0.7%<br />
3 £2000-£2999 142 0.9%<br />
4 £3000-£3999 270 1.7%<br />
5 £4000-£4999 580 3.7%<br />
6 £5000-£5999 816 5.2%<br />
7 £6000-£6999 585 3.7%<br />
8 £7000-£7999 535 3.4%<br />
9 £8000-£8999 882 5.6%<br />
10 £9000-£9999 498 3.2%<br />
11 £10000-£12499 974 6.2%<br />
12 £12500-£14999 942 6.0%<br />
13 £15000-£17499 1044 6.7%<br />
14 £17500-£19999 863 5.5%<br />
15 £20000-£24999 1415 9.0%<br />
16 £25000-£29999 1373 8.7%<br />
17 £30000-£34999 1131 7.2%<br />
18 £35000-£39999 922 5.9%<br />
19 £40000-£49999 1134 7.2%<br />
20 £50000-£74999 797 5.1%<br />
21 £75000 or more 596 3.8%<br />
Total 15695 100%<br />
When the household contains only one<br />
adult, the household’s income is that<br />
National Centre for Social Research<br />
66<br />
of the HRP. When the household<br />
contains more than one adult, the<br />
income of the whole household is an<br />
estimate by one household member<br />
only – either the HRP or the HRP’s<br />
spouse. Where information was not<br />
supplied, values were imputed by<br />
totalling the individual incomes of the<br />
household members, the best estimate<br />
being the midpoint of the income band.<br />
When the individual incomes required<br />
for this process were missing, they<br />
were imputed first, using comparable<br />
cases for which income had been<br />
reported (see I178).<br />
H83 Employed in household<br />
1 None 5883 37.5%<br />
2 1 part time, no full time 973 6.2%<br />
3 1 full time, no part time 3346 21.3%<br />
4 2 part time, no full time 153 1.0%<br />
5 1 full time, 1 part time 2000 12.7%<br />
6 2 full time, no part time 2366 15.1%<br />
7 1 full time, 2+ part time 157 1.0%<br />
8 2 full time, 1+ part time 336 2.1%<br />
9 3+ part time, no full<br />
time<br />
20 0.1%<br />
10 3+ full time, no part<br />
time<br />
368 2.3%<br />
11 3+ full time, 1+ part<br />
time<br />
93 0.6%<br />
Total 15695 100%<br />
H83 is derived from I177.<br />
H84 Real household equivalent semideciles<br />
(2002-<strong>2003</strong> basis)<br />
1 st (lowest) 785 5.0%<br />
2 nd<br />
785 5.0%<br />
3 rd<br />
785 5.0%<br />
4 th<br />
784 5.0%<br />
5 th<br />
785 5.0%<br />
6 th<br />
785 5.0%<br />
7 th<br />
785 5.0%<br />
8 th<br />
784 5.0%<br />
9 th<br />
785 5.0%<br />
10 th<br />
785 5.0%<br />
11 th<br />
785 5.0%<br />
12 th<br />
784 5.0%<br />
13 th<br />
785 5.0%<br />
14 th<br />
785 5.0%<br />
15 th<br />
785 5.0%<br />
16 th<br />
784 5.0%
H84 Real household equivalent semideciles<br />
(2002-<strong>2003</strong> basis)<br />
17 th<br />
785 5.0%<br />
18 th<br />
785 5.0%<br />
19 th<br />
785 5.0%<br />
20 th (highest) 784 5.0%<br />
Total 15695 100%<br />
Households are assigned to one of<br />
twenty groups, ranked in ascending<br />
order of affluence. Households with an<br />
income straddling two or more code<br />
bands are randomly allocated to one<br />
of the bands, whilst ensuring the<br />
bands remain equal in size.<br />
In addition to semi-deciles based upon<br />
2002-<strong>2003</strong>, there exist variables H84k<br />
and H84l, based upon 2002 and <strong>2003</strong><br />
individual years only.<br />
H85 Real household income equivalent<br />
quintiles (2002-<strong>2003</strong> basis)<br />
1 Lowest real income 3139 20.0%<br />
2 Second level 3139 20.0%<br />
3 Third level 3139 20.0%<br />
4 Fourth level 3139 20.0%<br />
5 Highest real income 3139 20.0%<br />
Total 15695 100%<br />
H85 is aggregated from H84.<br />
Correspondingly, there exist variables<br />
H85K and H85L, which relate to<br />
individual years 2002 and <strong>2003</strong><br />
respectively.<br />
H108 ACORN® classification<br />
1 Wealthy suburbs, large<br />
detached houses<br />
392 2.5%<br />
2 Villages with wealthy<br />
commuters<br />
465 3.0%<br />
3 Mature affluent homeowning<br />
areas<br />
469 3.0%<br />
4 Affluent suburbs, older<br />
families<br />
575 3.7%<br />
5 Mature well-off<br />
suburbs<br />
358 2.3%<br />
6 Agricultural villages,<br />
home-based workers<br />
255 1.3%<br />
7 Holiday areas, older<br />
people, home-based<br />
workers<br />
95 0.6%<br />
8 Home-owning areas, 214 1.4%<br />
National Centre for Social Research<br />
67<br />
H108 ACORN® classification<br />
well-off older residents<br />
9 Private flats, elderly<br />
people<br />
204 1.3%<br />
10 Affluent working<br />
families and mortgages<br />
453 2.9%<br />
11 Affluent working<br />
couples and mortgages,<br />
new homes<br />
186 1.2%<br />
12 Transient workforces,<br />
living at place of work<br />
37 0.2%<br />
13 Home-owning family<br />
areas<br />
319 2.0%<br />
14 Home-owning family<br />
areas, older children<br />
422 2.7%<br />
15 Families and<br />
mortgages, younger<br />
children<br />
321 2.0%<br />
16 Well-off town and city<br />
areas<br />
141 0.9%<br />
17 Flats and mortgages,<br />
singles/young working<br />
couples<br />
160 1.0%<br />
18 Furnished<br />
flats/bedsits, younger<br />
single people<br />
44 0.3%<br />
19 Apartments, young<br />
professional<br />
singles/couples<br />
136 0.9%<br />
20 Gentrified multi-ethnic<br />
areas<br />
117 0.7%<br />
21 Prosperous enclaves,<br />
highly qualified<br />
executives<br />
79 0.5%<br />
22 Academic centres,<br />
students/young<br />
professionals<br />
83 0.5%<br />
23 Affluent city centre<br />
areas, tenements/flats<br />
130 0.8%<br />
24 Partially gentrified<br />
multi-ethnic areas<br />
116 0.7%<br />
25 Converted<br />
flats/bedsits, single<br />
people<br />
116 0.7%<br />
26 Mature established<br />
home-owning areas<br />
557 3.5%<br />
27 Rural areas, mixed<br />
occupations<br />
496 3.2%<br />
28 Established homeowning<br />
areas<br />
692 4.4%<br />
29 Home-owning areas,<br />
council tenants/retired<br />
people<br />
423 2.7%<br />
30 Established homeowning<br />
areas, skilled<br />
workers<br />
600 3.8%<br />
31 Home owners in older<br />
properties, younger<br />
570 3.6%
H108 ACORN® classification<br />
workers<br />
32 Home-owning areas<br />
with skilled workers<br />
715 4.6%<br />
33 Council areas, some<br />
new home owners<br />
498 3.2%<br />
34 Mature home-owning<br />
areas, skilled workers<br />
494 3.1%<br />
35 Low-rise estates,<br />
older workers, new<br />
home owners<br />
515 3.3%<br />
36 Home-owning multiethnic<br />
areas, young<br />
families<br />
179 1.1%<br />
37 Multi-occupied town<br />
centres, mixed<br />
occupations<br />
267 1.7%<br />
38 Multi-ethnic areas,<br />
white collar workers<br />
224 1.4%<br />
39 Home owners, small<br />
council flats, single<br />
pensioners<br />
395 2.5%<br />
40 Council areas, older<br />
people, health problems<br />
304 1.9%<br />
41 Better-off council<br />
areas, new home<br />
owners<br />
345 2.2%<br />
42 Council areas, young<br />
families, some new<br />
home owners<br />
386 2.5%<br />
43 Council areas, young<br />
families, many lone<br />
parents<br />
262 1.7%<br />
44 Multi-occupied<br />
terraces, multi-ethnic<br />
areas<br />
93 0.6%<br />
45 Low-rise council<br />
housing, less well-off<br />
families<br />
350 2.2%<br />
46 Council areas,<br />
residents with health<br />
problems<br />
280 1.8%<br />
47 Estates with high<br />
unemployment<br />
162 1.0%<br />
48 Council flats, elderly<br />
people, health problems<br />
236 1.5%<br />
49 Council flats, very<br />
high unemployment<br />
178 1.1%<br />
50 Council areas, high<br />
unemployment, lone<br />
parents<br />
216 1.4%<br />
51 Council flats, greatest<br />
hardship, many lone<br />
parents<br />
68 0.4%<br />
52 Multi-ethnic, large<br />
families, overcrowding<br />
48 0.3%<br />
53 Multi-ethnic, severe<br />
unemployment, lone<br />
183 1.2%<br />
National Centre for Social Research<br />
68<br />
H108 ACORN® classification<br />
parents<br />
54 Multi-ethnic, high<br />
unemployment,<br />
overcrowding<br />
49 0.3%<br />
55 Could not classify 23 0.1%<br />
Total 15695 100%<br />
Developed by CACI®, ACORN® is a<br />
geodemographic targeting<br />
classification, which combines<br />
geographic and demographic<br />
information from the 1991 census to<br />
produce a tool for classifying different<br />
types of people in different areas<br />
throughout Great Britain.<br />
H121 Index of multiple deprivation<br />
1 (most deprived) 1849 13.9%<br />
2 1895 14.2%<br />
3 1554 11.6%<br />
4 1390 10.4%<br />
5 1264 9.5%<br />
6 1180 8.8%<br />
7 1041 7.8%<br />
8 1034 7.7%<br />
9 552 4.1%<br />
10 (least deprived) 1589 11.9%<br />
Total 13348 100%<br />
NA 2347<br />
The Index of Multiple Deprivation is<br />
based upon the premise that multiple<br />
deprivation is made up of separate<br />
dimensions or ‘domains’ of<br />
deprivation. These domains reflect<br />
different aspects of deprivation. Six<br />
domain indices (income, employment,<br />
health deprivation and disability,<br />
education skills and training, housing<br />
and geographical access to services)<br />
are combined to make the overall<br />
Index of Multiple Deprivation.<br />
The index of multiple deprivation<br />
applies only to households in England.<br />
Households in Scotland or Wales are<br />
coded as NA.
H132 Household working structure<br />
1 2+ full time 1+ part<br />
time<br />
429 2.7%<br />
2 2+ full time 0 part time 2734 17.4%<br />
3 1 full time 0 part time 3346 21.3%<br />
4 1 full time 1+ part time 2157 13.7%<br />
5 0 full time 1+ part time 1146 7.3%<br />
6 0 full time 0 part time 5883 37.5%<br />
Total 15695 100%<br />
H151 Index of multiple deprivation (<strong>2004</strong><br />
basis)<br />
1 (most deprived) 1257 9.4%<br />
2 1217 9.1%<br />
3 1422 10.6%<br />
4 1367 10.2%<br />
5 1390 10.4%<br />
6 1293 9.7%<br />
7 1315 9.8%<br />
8 1339 10.0%<br />
9 1405 10.5%<br />
10 (least deprived) 1348 10.1%<br />
Total 13353 100%<br />
NA 2342 17.5%<br />
Opinions of local transport options<br />
Variables H122 to H127 were included<br />
from 2001. However, to reduce the<br />
total number of questions in the<br />
questionnaire, these questions are<br />
only asked in alternate years.<br />
Answers are based entirely upon<br />
respondents’ opinions.<br />
H122 Rate the frequency of local buses<br />
Modular, 2002 only<br />
1 Very frequent 1194 22.2%<br />
2 Fairly frequent 2948 54.8%<br />
3 Neither frequent nor 432 8.0%<br />
infrequent<br />
4 Fairly infrequent 514 9.6%<br />
5 Very infrequent 293 5.4%<br />
Total 5381 100%<br />
No local service 8<br />
Do not use 1649<br />
No opinion/ don’t know 75<br />
DNA 8582<br />
National Centre for Social Research<br />
69<br />
H123 Rate the reliability of local buses<br />
Modular, 2002 only<br />
1 Very reliable 1265 24.3%<br />
2 Fairly reliable 2926 56.2%<br />
3 Neither reliable nor<br />
unreliable<br />
308 5.9%<br />
4 Fairly reliable 446 8.6%<br />
5 Very unreliable 263 5.0%<br />
Total 5208 100%<br />
No local service 54<br />
Do not use 1905<br />
No opinion/ don’t know 270<br />
DNA 8258<br />
H124 Rate the frequency of<br />
trains/underground/metro<br />
Modular, 2002 only<br />
1 Very frequent 925 23.5%<br />
2 Fairly frequent 2270 57.7%<br />
3 Neither frequent nor 301 7.7%<br />
infrequent<br />
4 Fairly infrequent 311 7.9%<br />
5 Very infrequent 126 3.2%<br />
Total 3933 100%<br />
No local service 10<br />
Do not use 2749<br />
No opinion/ don’t know 139<br />
DNA 8864<br />
H125 Rate the reliability of<br />
trains/underground/metro<br />
Modular, 2002 only<br />
1 Very reliable 865 22.2%<br />
2 Fairly reliable 2081 53.5%<br />
3 Neither reliable nor<br />
unreliable<br />
275 7.1%<br />
4 Fairly unreliable 403 10.4%<br />
5 Very unreliable 265 6.8%<br />
Total 3889 100%<br />
No local service 155<br />
Do not use 2942<br />
No opinion/don’t know 451<br />
DNA 8258
H126 Rate the quality of local pavements<br />
Modular, 2002 only<br />
1 Very good 330 4.7%<br />
2 Fairly good 2570 36.7%<br />
3 Neither good nor poor 994 14.2%<br />
4 Fairly poor 1535 21.9%<br />
5 Very poor 1565 22.4%<br />
Total 6994 100%<br />
Not many pavements in<br />
area 369<br />
Do not use 51<br />
No opinion/don’t know 23<br />
DNA 8258<br />
H127 Rate the provision of local cycle<br />
lanes/paths<br />
Modular, 2002 only<br />
1 Very good 399 9.9%<br />
2 Fairly good 1298 32.1%<br />
3 Neither good nor poor 482 11.9%<br />
4 Fairly poor 868 21.5%<br />
5 Very poor 994 24.6%<br />
Total 4041 100%<br />
No local cycle lanes 1846<br />
Do not use 1057<br />
No opinion/ don’t know 493<br />
DNA 8258<br />
Shopping<br />
H139 Ordering by phone/post or Internet<br />
Multicoded<br />
1 Food and drink 1996 19.5%<br />
2 Clothes 5771 56.5%<br />
3 Books 5012 49.1%<br />
4 Furniture 2308 22.6%<br />
5 Travel 5215 51.0%<br />
6 Tickets (non travel) 3255 31.9%<br />
7 Plants/bulbs 1173 11.5%<br />
8 Health goods 735 7.2%<br />
9 Other 1721 16.8%<br />
Total 10216 100%<br />
DNA 5479<br />
H139 asks respondents whether they<br />
(or anyone else in the household) ever<br />
ordered goods over the phone, by post<br />
or on the Internet, and recorded all<br />
that applied.<br />
Values were recorded for variables<br />
H140-H143 only for respondents who<br />
had ordered goods in one of these<br />
ways.<br />
National Centre for Social Research<br />
70<br />
H140 How often delivered<br />
1 3 or more times a<br />
week<br />
92 0.9%<br />
2 Once or twice a week 559 5.5%<br />
3 More than twice a<br />
month<br />
797 7.8%<br />
4 Once or twice a month 2782 27.2%<br />
5 More than twice a year 3484 34.1%<br />
6 Once or twice a year 2173 21.3%<br />
7 Less than once a year 324 3.2%<br />
Total 10211 100%<br />
NA 5<br />
DNA 5479<br />
H141 Goods in last delivery<br />
Multicoded<br />
1 Food and drink 818 8.3%<br />
2 Clothes 2832 28.7%<br />
3 Books 2060 20.9%<br />
4 Furniture 518 5.2%<br />
5 Travel 1535 15.5%<br />
6 Tickets (non travel) 677 6.9%<br />
7 Plants/bulbs 251 2.5%<br />
8 Health goods 212 2.1%<br />
9 Other 1017 10.3%<br />
Total 9880 100%<br />
NA 7<br />
DNA 5808<br />
In contrast to H139, variable H141<br />
asked respondents to tell us the goods<br />
that arrived in their last delivery of<br />
goods ordered by phone, post or<br />
Internet. The question is only asked of<br />
those who had ordered goods in the<br />
preceding year.<br />
Where respondents ordered more than<br />
one type of goods together,<br />
interviewers recorded all that applied.<br />
Plants/bulbs and health goods were<br />
included from <strong>2003</strong> onwards and were<br />
previously coded as ‘other’.<br />
H142 How goods were ordered<br />
Phone 5609 56.9%<br />
Post 1433 14.5%<br />
Internet 2814 28.6%<br />
Total 9856 100%<br />
NA 24<br />
DNA 5815
H143 How bought otherwise<br />
1 In person 6154 62.5%<br />
2 By phone 1074 10.9%<br />
3 By post 942 9.6%<br />
4 Over the Internet 621 6.3%<br />
5 By fax 36 0.4%<br />
6 On the doorstep 8 0.1%<br />
7 Asked someone else 129 1.3%<br />
to buy<br />
8 Would not have bought 844 8.6%<br />
9 Other 39 0.4%<br />
Total 9847 100%<br />
NA 9<br />
DNA 5839<br />
Variable H143 records how<br />
respondents think they would<br />
otherwise have bought the goods<br />
received in their last delivery of goods<br />
ordered by phone, post or Internet.<br />
H147 Reasons for no main food shopping<br />
1 Delivered by shop 10 28.6%<br />
2 Most food eaten out 4 11.4%<br />
3 Other 21 60.0%<br />
Total 35 100%<br />
DNA 15660<br />
Rail and bus tickets<br />
H149 Combined rail and bus tickets<br />
available in area<br />
Modular, 2002 only<br />
1 Yes 1936 26.1%<br />
2 No 1440 19.4%<br />
3 Don’t know 3939 53.1%<br />
4 No local service 109 1.5%<br />
Total 7424 100%<br />
NA 13<br />
DNA 8258<br />
5.5 Vehicle level variables<br />
The majority of vehicle-level variables<br />
are asked explicitly of respondents in<br />
the vehicle questionnaire. However,<br />
respondents are asked to provide their<br />
vehicle’s registration mark. If the<br />
respondent agrees to do so, the<br />
correct values for variables V15, V88-<br />
V91, V130-V131 and V164 are<br />
National Centre for Social Research<br />
71<br />
extracted directly from the DVLA<br />
database.<br />
If the respondent refuses to provide<br />
their registration mark, the questions<br />
that provide values for these variables<br />
are asked explicitly of the respondent<br />
or, in the case of V164, the variable is<br />
coded as NA.<br />
Vehicle reference<br />
V92 Rank of car in household<br />
1 First 4528 26.9%<br />
2 Second 4528 26.9%<br />
3 Third 676 4.0%<br />
4 Fourth 110 0.7%<br />
5 Fifth 30 0.2%<br />
6 Sixth or lower 9 0.1%<br />
7 Only car 6944 41.3%<br />
8 Secondary vehicle 74 0.4%<br />
Total 16825 100%<br />
DNA 560<br />
For the purposes of variable V92,<br />
vehicles are ranked in descending<br />
order of annual mileage. V92 applies<br />
only to cars, light vans, Land<br />
Rovers/Jeeps, minibuses, motor<br />
caravans and dormobiles.<br />
A ‘secondary vehicle’ is one that the<br />
household acquires during the Travel<br />
Week. These are not assigned a rank,<br />
as the length of time the vehicle has<br />
been available is too short to make<br />
such a judgement.<br />
Missing values for V92 are imputed<br />
using V45 (Estimated annual mileage).<br />
Each household vehicle is linked to its<br />
main driver in the household. The NTS<br />
defines the main driver as the<br />
household member who drives the<br />
most miles in the vehicle over the<br />
course of a year
VI3 Gender of main driver<br />
1 Male 10356 59.3%<br />
2 Female 7008 40.1%<br />
3 No main driver 95 0.5%<br />
Total 17459 100%<br />
VI6P Pensionable status of main driver<br />
1 Pensionable age 3024 17.3%<br />
2 Not pensionable age 14340 82.1%<br />
3 No main driver 95 0.5%<br />
Total 17459 100%<br />
Vehicle details<br />
V3 Type of vehicle<br />
1 4-wheel car 15715 90.0%<br />
2 3 wheel car 18 0.1%<br />
3 Invalid car 0 0.0%<br />
4 Motorcycle/scooter 37 0.2%<br />
with sidecar<br />
5 Motorcycle/scooter 421 2.4%<br />
6 Moped 46 0.3%<br />
7 Land Rover / Jeep 370 2.1%<br />
8 Light van 744 4.3%<br />
9 Other van/lorry 38 0.2%<br />
10 Minibus,<br />
motorcaravan, dormobile<br />
52 0.3%<br />
11 Other 18 0.1%<br />
Total 17459 100%<br />
V3 is coded from the household<br />
questionnaire.<br />
‘Four-wheeled cars’ include multipurpose<br />
vehicles (MPVs) and people<br />
carriers (which have side windows<br />
behind the driver). The category does<br />
not include Land Rovers, Jeeps and<br />
other off-road vehicles, which are<br />
included in category 7.<br />
A ‘light van’ is a van with a gross<br />
weight of 3.5 tons or less. This<br />
includes pick-up vehicles and carbased<br />
vans (which do not have side<br />
windows behind the driver).<br />
A ‘minibus’ has a maximum of 12<br />
seats including the driver’s seat. A<br />
vehicle with more seats is considered<br />
National Centre for Social Research<br />
72<br />
to be a bus, and coded here as an<br />
‘other’ vehicle.<br />
Other vehicles included in the ‘other’<br />
category include tractors, ambulances<br />
etc.<br />
V15 Taxation class<br />
1 Private & light goods<br />
(1.5 tons or less)<br />
16176 92.8%<br />
2 Taxi (Hackney) 2 0.0%<br />
3 3 wheel car (tricycle) 10 0.1%<br />
4 Disabled 609 3.5%<br />
5 Motorcycle, scooter,<br />
moped<br />
499 2.9%<br />
6 Heavy goods (over 1.5<br />
tons)<br />
17 0.1%<br />
7 Historic vehicle 50 0.3%<br />
8 Other 75 0.4%<br />
Total 17438 100%<br />
DNA 21<br />
Missing values for V15 are imputed<br />
from V3 (type of vehicle)<br />
V87 Engine capacity<br />
Based on numeric variable V86<br />
1 Up to 50 124 0.7%<br />
2 51-125 93 0.5%<br />
3 126-250 24 0.1%<br />
4 251-700 164 0.9%<br />
5 701-1000 1072 6.2%<br />
6 1001-1300 2889 16.6%<br />
7 1301-1400 2192 12.6%<br />
8 1401-1500 311 1.8%<br />
9 1501-1800 5122 29.4%<br />
10 1801-2000 3477 20.0%<br />
11 2001-2500 1183 6.8%<br />
12 2501-3000 452 2.6%<br />
13 3001 and over 292 1.7%<br />
Total 17395 100%<br />
NA 37<br />
DNA 27<br />
An exact estimate for engine capacity<br />
was sought from respondents. Where<br />
none could be given, respondents<br />
were asked for a banded estimate<br />
based upon the bands in the above<br />
table.<br />
Missing values for V87 were patched<br />
from V3, V46, V88 and V91.
V91 Age<br />
1 Up to 6 months 942 5.4%<br />
2 6 months to 1 year 828 4.8%<br />
3 Over 1 to 1.5 years 871 5.0%<br />
4 Over 1.5 to 2 years 850 4.9%<br />
5 Over 2 to 3 years 1483 8.5%<br />
6 Over 3 to 4 years 1386 8.0%<br />
7 Over 4 to 5 years 1434 8.3%<br />
8 Over 5 to 6 years 1351 7.8%<br />
9 Over 6 to 7 years 1257 7.2%<br />
10 Over 7 to 8 years 1121 6.5%<br />
11 Over 8 to 10 years 1997 11.5%<br />
12 Over 10 to 13 years 2032 11.7%<br />
13 Over 13 to 18 years 1354 7.8%<br />
14 Over 18 years 440 2.5%<br />
Total 17346 100%<br />
NA 92<br />
DNA 21<br />
Missing values for V91 are imputed<br />
using V3, V46, V87, V89, V90, V94,<br />
V96 and V112.<br />
V130 Make and model<br />
1 Small Fiat 265 1.5%<br />
2 Small Ford 973 5.6%<br />
3 Small Nissan/Datsun 372 2.2%<br />
4 Small Rover/Austin 205 1.2%<br />
5 Other small car 1837 10.6%<br />
6 Small/medium Ford 1093 6.3%<br />
7 Small/medium<br />
Nissan/Datsun<br />
149 0.9%<br />
8 Small/medium<br />
Peugeot/Talbot<br />
402 2.3%<br />
9 Small/medium<br />
Rover/Austin<br />
96 0.6%<br />
10 Small/medium<br />
Vauxhall<br />
649 3.8%<br />
11 Small/medium<br />
VW/Audi<br />
396 2.3%<br />
12 Other small/medium<br />
car<br />
1935 11.2%<br />
13 Medium Ford 565 3.3%<br />
14 Medium Rover/Austin 597 3.5%<br />
15 Medium Vauxhall 777 4.5%<br />
16 Other medium car 2902 16.8%<br />
17 Large Ford 178 1.0%<br />
18 Large Rover/Austin 68 0.4%<br />
19 Other large car 1844 10.7%<br />
20 Land Rover, Jeep or 491 2.8%<br />
similar<br />
21 Light van 590 3.4%<br />
22 Other (motorcycle, 910 5.3%<br />
National Centre for Social Research<br />
73<br />
V130 Make and model<br />
lorry etc.)<br />
Total 17294 100%<br />
NA 165<br />
Missing values for V130 are imputed<br />
from V3 and V87.<br />
V150 Car adapted for disabled driver<br />
1 Car adapted 49 0.3%<br />
2 Invalid car 77 0.4%<br />
3 Other 17333 99.3%<br />
Total 17459 100%<br />
V164 CO2 emissions<br />
Based on numeric variable V163<br />
Band AAA 0 0.0%<br />
Band AA 44 1.6%<br />
Band A 658 24.5%<br />
Band B 687 25.6%<br />
Band C 548 20.4%<br />
Band D 751 27.9%<br />
Total 2688 100%<br />
NA 14771<br />
V164 is only available for cars<br />
registered since March 2002.<br />
Mileage<br />
V46 Estimate of annual mileage<br />
Based on numeric variable V45<br />
1 Under 500 283 1.6%<br />
2 500-999 229 1.3%<br />
3 1000-1999 668 3.8%<br />
4 2000-2999 923 5.3%<br />
5 3000-3999 1157 6.6%<br />
6 4000-4999 1026 5.9%<br />
7 5000-6999 3234 18.5%<br />
8 7000-8999 2330 13.4%<br />
9 9000-11999 3105 17.8%<br />
10 12000-14999 1888 10.8%<br />
11 15000-17999 987 5.7%<br />
12 18000-20999 687 3.9%<br />
13 21000-29999 452 2.6%<br />
14 30000 miles and over 472 2.7%<br />
Total 17441 100%<br />
DNA 18<br />
46 represents the main driver’s<br />
estimate of the vehicle’s total mileage<br />
in a year, including mileage ineligible
for the travel record. It is not recorded<br />
for vehicles borrowed or hired for less<br />
than 12 months.<br />
Missing values for V45 are patched<br />
from V3, V87, V91, V96 and V112.<br />
V94 Total mileage<br />
Based on numeric variable V93<br />
1 Up to 2000 miles 551 3.6%<br />
2 2001-4000 399 2.6%<br />
3 4001-6000 369 2.4%<br />
4 6001-8000 373 2.4%<br />
5 8001-10000 389 2.5%<br />
6 10001-15000 845 5.5%<br />
7 15001-20000 824 5.4%<br />
8 20001-25000 855 5.6%<br />
9 25001-30000 743 4.8%<br />
10 30001-40000 1385 9.0%<br />
11 40001-50000 1240 8.1%<br />
12 50001-60000 1193 7.8%<br />
13 60001-75000 1609 10.5%<br />
14 75001-100000 2081 13.5%<br />
15 Over 100000 miles 2523 16.4%<br />
Total 15379 100%<br />
NA 2075<br />
DNA 5<br />
The vehicle’s total mileage is based<br />
upon the milometer reading at the end<br />
of the Travel Week (or the beginning if<br />
the end-week reading was not<br />
available), as reported by respondents<br />
(adjusted if the milometer was on the<br />
second cycle).<br />
V96 Mileage in Travel Week<br />
Based on numeric variable V95<br />
1 None 1555 9.0%<br />
2 1-9 miles 457 2.6%<br />
3 10-29 miles 1328 7.7%<br />
4 30-49 years 1528 8.9%<br />
5 50-74 miles 1903 11.0%<br />
6 75-99 miles 1716 9.9%<br />
7 100-149 miles 2686 15.6%<br />
8 150-199 miles 1849 10.7%<br />
9 200-299 miles 2035 11.8%<br />
10 300-399 miles 958 5.5%<br />
11 400-499 miles 530 3.1%<br />
12 500-749 miles 508 2.9%<br />
13 750 miles and over 211 1.2%<br />
Total 17264 100%<br />
NA 132<br />
DNA 63<br />
National Centre for Social Research<br />
74<br />
The main driver of each vehicle<br />
provided milometer readings at the<br />
start and end of the Travel Week.<br />
Missing values are patched using V3,<br />
V97 and V98.<br />
V98 Eligible mileage<br />
Based on numeric variable V97<br />
1 None 1674 9.7%<br />
2 1-9 miles 471 2.7%<br />
3 10-29 miles 1362 7.9%<br />
4 30-49 miles 1558 9.0%<br />
5 50-74 miles 1919 11.1%<br />
6 75-99 miles 1707 9.9%<br />
7 100-149 miles 2676 15.5%<br />
8 150-199 miles 1835 10.6%<br />
9 200-299 miles 1995 11.6%<br />
10 300-399 miles 919 5.3%<br />
11 400-499 miles 494 2.9%<br />
12 500-749 miles 478 2.8%<br />
13 750 miles and over 176 1.0%<br />
Total 17264 100%<br />
NA 132<br />
DNA 63<br />
The eligible mileage is calculated from<br />
the reported total mileage and<br />
ineligible mileage.<br />
Missing values are imputed using V3,<br />
V95, V96, S18 and S25.<br />
V121 Ineligible mileage<br />
1 None 16573 96.2%<br />
2 1-9 miles 131 0.8%<br />
3 10-29 miles 111 0.6%<br />
4 30-49 years 62 0.4%<br />
5 50-74 miles 51 0.3%<br />
6 75-99 miles 27 0.2%<br />
7 100-149 miles 56 0.3%<br />
8 150-199 miles 40 0.2%<br />
9 200-299 miles 57 0.3%<br />
10 300-399 miles 36 0.2%<br />
11 400-499 miles 27 0.2%<br />
12 500-749 miles 31 0.2%<br />
13 750 miles and over 25 0.1%<br />
Total 17227 100%<br />
NA 128<br />
DNA 104<br />
Ineligible mileage occurs for any of<br />
several reasons. These are shown in
the first four categories of variable<br />
V122.<br />
V121 can be derived from V95 and<br />
V97.<br />
V122 Reasons for ineligible mileage<br />
1 Driven by nonhousehold<br />
person<br />
369 45.1%<br />
2 Carrying goods in<br />
course of work<br />
272 33.3%<br />
3 Driven off public/GB<br />
roads<br />
94 11.5%<br />
4 Vehicle used as<br />
taxi/hire car<br />
42 5.1%<br />
5 Both 1 and 2 25 3.1%<br />
6 Both 1 and 3 6 0.7%<br />
7 Both 1 and 4 0 0.0%<br />
8 Both 2 and 3 9 1.1%<br />
9 Both 2 and 4 1 0.1%<br />
10 Both 3 and 4 0 0.0%<br />
11 1, 2 and 3 0 0.0%<br />
12 1, 2 and 4 0 0.0%<br />
13 1, 3 and 4 0 0.0%<br />
14 2, 3 and 4 0 0.0%<br />
15 All 1, 2, 3 and 4 0 0.0%<br />
Total 818 100%<br />
DNA 16641<br />
V140 Annual vehicle commuting mileage<br />
Based on numeric variable V139<br />
1 Nil 8307 47.6%<br />
2 1-2499 3774 21.6%<br />
3 2500-17999 5194 29.7%<br />
4 18000+ 184 1.1%<br />
Total 17459 100%<br />
Missing values for V140 are patched<br />
from V3 and V123.<br />
V142 Annual vehicle business mileage<br />
Based on numeric variable V141<br />
1 Nil 14149 81.0%<br />
2 1-2499 1770 10.1%<br />
3 2500-17999 1277 7.3%<br />
4 18000+ 263 1.5%<br />
Total 17459 100%<br />
Missing values for V142 are patched<br />
from V3 and V125.<br />
National Centre for Social Research<br />
75<br />
V144 Annual vehicle private mileage<br />
Based on numeric variable V143<br />
1 Nil 2243 12.8%<br />
2 1-2499 4191 24.0%<br />
3 2500-17999 10854 62.2%<br />
4 18000+ 171 1.0%<br />
Total 17459 100%<br />
Missing values for V144 are patched<br />
from V3 and V127.<br />
Vehicle registration<br />
V85 Registration – ownership<br />
1 Employer 845 4.8%<br />
2 Other firm – employerhired<br />
67 0.4%<br />
3 Own business 57 0.3%<br />
4 Other firm – own<br />
business hired<br />
3 0.0%<br />
5 Other firm 28 0.2%<br />
6 Household member 16291 93.3%<br />
7 Other firm – household<br />
hired<br />
27 0.2%<br />
8 Other person –<br />
borrowed/loaned<br />
82 0.5%<br />
9 Other person – no<br />
details<br />
59 0.3%<br />
Total 17459 100%<br />
Variable V85 records the relationship<br />
of the registered keeper of the vehicle<br />
to the household.<br />
‘Hire’ includes hire and leasing.<br />
If registration details were unknown,<br />
the question asked was who ‘owns’<br />
the vehicle.<br />
Missing values were imputed from<br />
V112.<br />
V89 Registration letter<br />
1 Suffix A 5 0.0%<br />
2 Suffix B 4 0.0%<br />
3 Suffix C 8 0.0%<br />
4 Suffix D 11 0.1%<br />
5 Suffix E 5 0.0%<br />
6 Suffix F 17 0.1%<br />
7 Suffix G 12 0.1%<br />
8 Suffix H 16 0.1%
V89 Registration letter<br />
9 Suffix J 24 0.1%<br />
10 Suffix K 19 0.1%<br />
11 Suffix L 18 0.1%<br />
12 Suffix M 15 0.1%<br />
13 Suffix N 17 0.1%<br />
14 Suffix P 13 0.1%<br />
15 Suffix R 19 0.1%<br />
16 Suffix S 15 0.1%<br />
17 Suffix T 18 0.1%<br />
18 Suffix V 33 0.2%<br />
19 Suffix W 27 0.2%<br />
20 Suffix X 41 0.2%<br />
21 Suffix Y 55 0.3%<br />
22 Prefix A 108 0.6%<br />
23 Prefix B 89 0.5%<br />
24 Prefix C 134 0.8%<br />
25 Prefix D 207 1.2%<br />
26 Prefix E 296 1.7%<br />
27 Prefix F 457 2.7%<br />
28 Prefix G 622 3.6%<br />
29 Prefix H 623 3.7%<br />
30 Prefix J 701 4.1%<br />
31 Prefix K 830 4.9%<br />
32 Prefix L 1071 6.3%<br />
33 Prefix M 1101 6.5%<br />
34 Prefix N 1153 6.8%<br />
35 Prefix P 1289 7.6%<br />
36 Prefix R 1308 7.7%<br />
37 Prefix S 777 4.6%<br />
38 Prefix T 751 4.4%<br />
39 Prefix V 625 3.7%<br />
40 Prefix W 718 4.2%<br />
41 Prefix X 720 4.2%<br />
42 Prefix Y 816 4.8%<br />
43 Year Identifier 51 804 4.7%<br />
44 Year Identifier 02 682 4.0%<br />
45 Year Identifier 52 458 2.7%<br />
46 Year Identifier 03 284 1.7%<br />
47 Year Identifier 53 52 0.3%<br />
Total 17068 100%<br />
97 No Letter 293<br />
NA 77<br />
DNA 21<br />
V89 records the letter (or two-digit<br />
numeric year identifier) which denotes<br />
the year of registration. Registration<br />
marks with no letters, or letters that do<br />
not represent a correct year (such as<br />
Q-plates) are coded as having no<br />
letter.<br />
Missing values for V89 are patched<br />
from H7, H92, V90 and V91<br />
National Centre for Social Research<br />
76<br />
V90 Year of first registration<br />
1 1965 or earlier 25 0.1%<br />
2 1966 11 0.1%<br />
3 1967 13 0.1%<br />
4 1968 13 0.1%<br />
5 1969 12 0.1%<br />
6 1970 21 0.1%<br />
7 1971 25 0.1%<br />
8 1972 16 0.1%<br />
9 1973 19 0.1%<br />
10 1974 15 0.1%<br />
11 1975 13 0.1%<br />
12 1976 17 0.1%<br />
13 1977 21 0.1%<br />
14 1978 15 0.1%<br />
15 1979 24 0.1%<br />
16 1980 31 0.2%<br />
17 1981 33 0.2%<br />
18 1982 59 0.3%<br />
19 1983 81 0.5%<br />
20 1984 116 0.7%<br />
21 1985 100 0.6%<br />
22 1986 172 1.0%<br />
23 1987 243 1.4%<br />
24 1988 376 2.2%<br />
25 1989 567 3.3%<br />
26 1990 632 3.6%<br />
27 1991 656 3.8%<br />
28 1992 739 4.3%<br />
29 1993 990 5.7%<br />
30 1994 1102 6.4%<br />
31 1995 1155 6.7%<br />
32 1996 1195 6.9%<br />
33 1997 1279 7.4%<br />
34 1998 1348 7.8%<br />
35 1999 1419 8.2%<br />
36 2000 1449 8.4%<br />
37 2001 1628 9.4%<br />
38 2002 1281 7.4%<br />
39 <strong>2003</strong> 433 2.5%<br />
40 <strong>2004</strong> 2 0.0%<br />
Total 17346 100%<br />
NA 92<br />
DNA 21<br />
V90 is patched using H7, H92, V89<br />
and V91.
Purchase/hire costs<br />
V103 Purchase/hire costs<br />
1 Firm paid (firm<br />
registered / hired)<br />
912 5.2%<br />
2 Own business 60 0.3%<br />
3 Firm paid (privately<br />
registered / hired)<br />
403 2.3%<br />
4 Not firm paid (privately<br />
registered / hired)<br />
15955 91.5%<br />
5 No information 110 0.6%<br />
Total 17440 100%<br />
DNA 19<br />
‘Firm paid’ includes the payment of<br />
any proportion of the purchase price.<br />
Firm-registered and firm-hired/leased<br />
vehicles are assumed to have been<br />
paid for by the firm.<br />
No information was collected for this<br />
variable in respect of borrowed<br />
vehicles or vehicles registered to an<br />
organisation other than an employer or<br />
hire/lease firm. In these cases, it is<br />
unlikely that the household paid the<br />
purchase/hire costs. These vehicles<br />
are coded to category 4 for the<br />
purposes of variable V103.<br />
Missing values were patched from V85<br />
and J28.<br />
V112 Company car summary<br />
1 Company car / any<br />
free fuel<br />
2 Company car / no free<br />
fuel<br />
3 Self-employed<br />
business car<br />
4 Employer pays some<br />
private costs<br />
5 Used for work / in<br />
course of work<br />
allowance only<br />
6 Used for work / no<br />
allowance<br />
7 Not used for work / 3<br />
years old or less<br />
8 Not used for work /<br />
over 3 years old<br />
9 Other non-company<br />
car<br />
National Centre for Social Research<br />
286 1.8%<br />
698 4.4%<br />
471 3.0%<br />
317 2.0%<br />
1139 7.2%<br />
568 3.6%<br />
2955 18.8%<br />
9245 58.8%<br />
54 0.3%<br />
77<br />
V112 Company car summary<br />
Total 15733 100%<br />
DNA 1726<br />
A company car is defined as vehicle<br />
such that:<br />
• It has a ‘car’ body type<br />
• A firm pays part or all of the<br />
purchase cost<br />
• The main driver is not selfemployed<br />
• The car is either in the firm’s<br />
name or registered privately<br />
with the individual paying extra<br />
income tax<br />
This differs from the DVLA definition,<br />
which includes all cars registered to a<br />
company. The free fuel in categories 1<br />
and 2 refers to any fuel knowingly paid<br />
by the employer for private mileage<br />
done in the vehicle.<br />
Category 3 includes those cars for<br />
which the main driver is self-employed<br />
and income tax relief is claimed on the<br />
vehicle.<br />
Category 4 contains cars for which the<br />
employer contributes to either the<br />
running costs or fuel costs for private<br />
mileage.<br />
Category 5 distinguishes cars that the<br />
respondent uses for work and for<br />
which the employer only contributes<br />
towards the fuel costs incurred in the<br />
course of work and not any private<br />
running costs.<br />
Category 6 includes those used by the<br />
respondent for business purposes but<br />
for which the respondent receives no<br />
allowance from the employer.<br />
Categories 7 and 8 contain cars that<br />
receive no support from the employer,<br />
or business if the main driver is selfemployed.<br />
Missing values were imputed from<br />
V85, V91 and J28.
V131 Month of registration<br />
1 January 1592 9.2%<br />
2 February 999 5.8%<br />
3 March 2033 11.7%<br />
4 April 1328 7.6%<br />
5 May 1546 8.9%<br />
6 June 1279 7.4%<br />
7 July 684 3.9%<br />
8 August 3039 17.5%<br />
9 September 1649 9.5%<br />
10 October 1198 6.9%<br />
11 November 1216 7.0%<br />
12 December 798 4.6%<br />
Total 17361 100%<br />
NA 77<br />
DNA 21<br />
Missing values for V131 are imputed<br />
at random to a month in the correct<br />
half of the year, determined from V89<br />
and V90.<br />
Fuel<br />
V88 Type of fuel<br />
1 Petrol 14257 81.7%<br />
5 Diesel 3168 18.2%<br />
6 Electric 6 0.0%<br />
7 LPG 6 0.0%<br />
8 Bi-fuel 5 0.0%<br />
9 Other 1 0.0%<br />
Total 17443 100%<br />
DNA 16<br />
Distinction in V88 is no longer made<br />
between unleaded, LRP and leaded<br />
petrol.<br />
Missing values are patched using V87<br />
and V90.<br />
V100 Fuel purchased<br />
Based on numeric variable V99<br />
1 None 8809 50.6%<br />
2 1-15 litres 1509 8.7%<br />
3 Over 15-30 litres 2885 16.6%<br />
4 Over 30-60 litres 3323 19.1%<br />
5 Over 60-120 litres 772 4.4%<br />
6 Over 120 litres 98 0.6%<br />
Total 17396 100%<br />
DNA 63 0.4%<br />
National Centre for Social Research<br />
78<br />
The main driver of the vehicle<br />
recorded all fuel put into the tank<br />
during the Travel Week. This was<br />
noted at the pickup interview. The<br />
amount of fuel recorded may be<br />
greater than that implied by the cost<br />
(V102) because some or all of it may<br />
have been provided free of charge.<br />
Missing values are imputed from V3,<br />
V87, V91 and V96.<br />
V102 Fuel cost<br />
Based on numeric variable V101<br />
1 None 8847 50.9%<br />
2 £1 to £7 264 1.5%<br />
3 Over £7 to £15 2018 11.6%<br />
4 Over £15 to £25 2680 15.4%<br />
5 Over £25 to £55 3070 17.6%<br />
6 Over £55 517 3.0%<br />
Total 17396 100%<br />
DNA 63<br />
Respondents were asked to record the<br />
cost of fuel put into the tank to the<br />
nearest pound. This is the cost to the<br />
household only. For individual<br />
vehicles, the unit will be inaccurate<br />
because of rounding in both source<br />
variables.<br />
Missing values were patched from H7,<br />
H92, V96 and V99.<br />
V135 Fuel consumed<br />
Based on numeric variable V134<br />
1 None 1648 9.5%<br />
2 1-15 litres 6965 40.2%<br />
3 Over 15-30 litres 4415 25.5%<br />
4 Over 30-60 litres 3235 18.7%<br />
5 Over 60-120 litres 941 5.4%<br />
6 Over 120 litres 137 0.8%<br />
Total 17341 100%<br />
NA 9<br />
DNA 109<br />
Questions are asked to ascertain the<br />
size of a vehicle’s fuel tank, and to<br />
obtain fuel gauge readings at the start<br />
and the end of the Travel Week. The<br />
answers to these questions are<br />
combined with the fuel purchased<br />
during the Travel Week to estimate<br />
fuel consumption.
Missing values are imputed from V3,<br />
V87, V88, V96 and V130.<br />
Parking<br />
V145 Parking – overnight location<br />
1 Garage 4042 23.2%<br />
2 Private property (not<br />
garaged)<br />
8814 50.6%<br />
3 Street 3946 22.7%<br />
4 Other 489 2.8%<br />
5 Not near home 129 0.7%<br />
Total 17420 100%<br />
NA 21<br />
DNA 18<br />
Questions V146-V149 are only asked<br />
of respondents whose vehicles are<br />
parked somewhere other than their<br />
own property. Respondents whose<br />
cars are parked in a garage or<br />
otherwise on their own private property<br />
are coded as DNA in the following<br />
questions.<br />
V146 Parking – distance from house<br />
1 Outside 2713 62.6%<br />
2 Less than 10 yards 820 18.9%<br />
3 10-34 yards 423 9.8%<br />
4 35-99 yards 208 4.8%<br />
5 100 yards or more<br />
(less than 10 minutes<br />
walk)<br />
149 3.4%<br />
6 100 yards or more (10 24 0.6%<br />
minutes or more walk)<br />
Total 4337 100%<br />
NA 55<br />
DNA 13067<br />
V147 Type of parking payment<br />
1 Resident’s parking<br />
permit<br />
236 71.5%<br />
2 Other non-resident’s<br />
parking permit<br />
2 0.6%<br />
3 Hired garage 78 23.6%<br />
4 Other 14 4.2%<br />
Total 330 100%<br />
5 No payment due 4101<br />
NA 25<br />
DNA 13003<br />
National Centre for Social Research<br />
79<br />
V149 Annual parking fee<br />
Based on numeric variable V148<br />
1 Less than £35 91 28.3%<br />
2 £35 to less than £100 128 39.8%<br />
3 £100 to less than £200 39 12.1%<br />
4 £200 or more 64 19.9%<br />
Total 322 100%<br />
NA 33<br />
DNA 17104<br />
Delivery of goods<br />
V155 Frequency of delivery of goods in<br />
course of work<br />
1 3 or more times a<br />
week<br />
203 43.5%<br />
2 Once or twice a week 116 24.8%<br />
3 Less than once a week<br />
but more than twice a<br />
month<br />
20 4.3%<br />
4 Once or twice a month 71 15.2%<br />
5 Less than once a<br />
month but more than<br />
twice a year<br />
29 6.2%<br />
6 Once or twice a year 18 3.9%<br />
7 Less than once a year 7 1.5%<br />
8 Frequency unknown 3 0.6%<br />
Total 467 100%<br />
Goods not delivered 16942<br />
NA 32<br />
DNA 18<br />
V156 Number of delivery points<br />
1 1 239 51.2%<br />
2 2 to 4 126 27.0%<br />
3 5 to 9 43 9.2%<br />
4 10 to 19 21 4.5%<br />
5 20 or more 30 6.4%<br />
6 Frequency unknown 8 1.7%<br />
Total 467 100%<br />
Goods not delivered 16942<br />
NA 32<br />
DNA 18<br />
Variable V156 represents the number<br />
of stops the vehicle made to deliver<br />
goods on the last day that the vehicle<br />
was used to deliver goods in the<br />
course of work and records the<br />
number of drop-off points made, not
the number of times the vehicle went<br />
out.<br />
Travel outside GB<br />
V158 Number of miles outside GB<br />
Based on numeric variable V157<br />
1 Up to 100 100 20.2%<br />
2 Over 100 and up to<br />
200<br />
37 7.5%<br />
3 Over 200 and up to<br />
300<br />
28 5.6%<br />
4 Over 300 and up to<br />
400<br />
23 4.6%<br />
5 Over 400 and up to<br />
500<br />
34 6.9%<br />
6 Over 500 and up to<br />
1000<br />
123 24.8%<br />
7 Over 1000 and up to<br />
1500<br />
40 8.1%<br />
8 Over 1500 and up to<br />
2000<br />
66 13.3%<br />
9 Over 2000 40 8.1%<br />
Driven outside GB – 5 1.0%<br />
mileage unknown<br />
Total 496 100%<br />
Not driven outside GB 7650<br />
NA 33<br />
DNA 9280<br />
Although mileage travelled in Northern<br />
Ireland is recorded separately (in<br />
V161), all such mileage is also<br />
included in the total for V158.<br />
V159 Purpose of trip outside GB<br />
1 Holiday 335 67.5%<br />
2 Business trip 19 3.8%<br />
3 Shopping trip 97 19.6%<br />
4 Visiting friends or<br />
relations<br />
34 6.9%<br />
5 Another reason 11 2.2%<br />
Total 496 100%<br />
Not driven outside GB 7650<br />
NA 33<br />
DNA 9280<br />
V161 Number of miles in NI<br />
Based on numeric variable V160<br />
1 Up to 100 8 29.6%<br />
2 Over 100 and up to<br />
200<br />
6 22.2%<br />
3 Over 200 and up to 2 7.4%<br />
National Centre for Social Research<br />
80<br />
V161 Number of miles in NI<br />
300<br />
4 Over 300 and up to<br />
400<br />
0 0.0%<br />
5 Over 400 and up to<br />
500<br />
5 18.5%<br />
6 Over 500 and up to<br />
1000<br />
5 18.5%<br />
7 Over 1000 and up to<br />
1500<br />
0 0.0%<br />
8 Over 2000 0 0.0%<br />
9 Driven in NI – mileage 1 3.7%<br />
unknown<br />
Total 27 100%<br />
Not driven in NI 8121<br />
NA 31<br />
DNA 9280<br />
V162 Purpose of trip in NI<br />
1 Holiday 13 48.1%<br />
2 Business trip 0 0.0%<br />
3 Shopping trip 0 0.0%<br />
4 Visiting friends or<br />
relations<br />
13 48.1%<br />
5 Another reason 1 3.7%<br />
6 Reason not known 0 0.0%<br />
Total 27 100%<br />
Not driven in NI 8121<br />
NA 31<br />
DNA 9280<br />
5.6 Individual level variables<br />
Fully responding households on the<br />
2002/<strong>2003</strong> database contain 36,353<br />
individuals of all ages (16,886 in 2002<br />
and 19,467 in <strong>2003</strong>). Demographic<br />
information about individuals was<br />
collected on the household<br />
questionnaire; the rest of the<br />
information about individuals was<br />
obtained via the individual<br />
questionnaire.<br />
Most individuals are interviewed faceto-face.<br />
However, there are some<br />
circumstances where the individual<br />
questionnaire is completed by proxy.<br />
Children under 11 are interviewed by<br />
proxy, as are individuals unable to
provide the information themselves<br />
(e.g. because of mental illness or<br />
because they were away from home<br />
throughout the interview period).<br />
Personal details<br />
Values for the variables in this section<br />
are taken from the household<br />
questionnaire.<br />
I2 Relationship to household reference<br />
person<br />
1 Household reference<br />
person<br />
15695 43.2%<br />
2 Spouse 7961 21.9%<br />
3 Cohabitee 1293 3.6%<br />
4 Son/daughter 9764 26.9%<br />
5 Stepson /<br />
stepdaughter<br />
429 1.2%<br />
6 Foster child 21 0.1%<br />
7 Son-in-law / daughterin-law<br />
34 0.1%<br />
8 Parent/guardian 160 0.4%<br />
9 Step-parent 1 0.0%<br />
10 Foster parent 0 0.0%<br />
11 Parent-in-law 41 0.1%<br />
12 Brother/sister 193 0.5%<br />
13 Stepbrother /<br />
stepsister<br />
10 0.0%<br />
14 Foster brother / foster<br />
sister<br />
8 0.0%<br />
15 Brother-in-law /<br />
sister-in-law<br />
22 0.1%<br />
16 Grandchild 161 0.4%<br />
17 Grandparent 3 0.0%<br />
18 Other relative 87 0.2%<br />
19 Other non-relative 470 1.3%<br />
Total 36353 100%<br />
Missing values for I2 are patched from<br />
I3, I5 and I268.<br />
I3 Gender<br />
1 Male 17445 48.0%<br />
2 Female 18908 52.0%<br />
Total 36353 100%<br />
National Centre for Social Research<br />
81<br />
I6 Age<br />
Based on numeric variable I5<br />
1 Less than 1 year 427 1.2%<br />
2 1-2 years 857 2.4%<br />
3 3-4 years 923 2.5%<br />
4 5-10 years 2909 8.0%<br />
5 11-15 years 2475 6.8%<br />
6 16 years 445 1.2%<br />
7 17 years 415 1.1%<br />
8 18 years 340 0.9%<br />
9 19 years 345 0.9%<br />
10 20 years 338 0.9%<br />
11 21-25 years 1704 4.7%<br />
12 26-29 years 1634 4.5%<br />
13 30-39 years 5323 14.6%<br />
14 40-49 years 5043 13.9%<br />
15 50-59 years 4804 13.2%<br />
16 60-64 years 2076 5.7%<br />
17 65-69 years 1831 5.0%<br />
18 70-74 years 1644 4.5%<br />
19 75-79 years 1332 3.7%<br />
20 80-84 years 968 2.7%<br />
85 years or older 520 1.4%<br />
Total 36353 100%<br />
I268 Legal marital status<br />
1 Married and living with<br />
spouse<br />
16085 55.9%<br />
2 Separated 649 2.3%<br />
3 Single 7461 25.9%<br />
4 Divorced 2140 7.4%<br />
5 Widowed 2427 8.4%<br />
Total 28762 100%<br />
DNA 7591<br />
Missing values for I268 are patched<br />
from I2 and I5.<br />
I269 Living arrangements<br />
1 Married 16085 55.9%<br />
2 Cohabiting 2661 9.3%<br />
3 Single 5555 19.3%<br />
4 Separated 558 1.9%<br />
5 Divorced 1529 5.3%<br />
6 Widowed 2374 8.3%<br />
Total 28762 100%<br />
DNA 7591<br />
I268 and I269 are only recorded for<br />
those aged 16 or over. The remainder<br />
are coded DNA.
I277 Why no spouse in household<br />
1 Married, spouse not<br />
in household<br />
14 100%<br />
2 Other 0 0%<br />
3 Total 14 100%<br />
I277 is only asked of those who record<br />
their marital status as ‘married and<br />
living with spouse’, but where no<br />
spouse is listed as a household<br />
member.<br />
I275 Ethnic group<br />
1 British 32667 89.9%<br />
2 Other white<br />
background<br />
821 2.3%<br />
3 White and black<br />
Caribbean<br />
122 0.3%<br />
4 White and black<br />
African<br />
75 0.2%<br />
5 White and Asian 90 0.2%<br />
6 Any other mixed<br />
background<br />
117 0.3%<br />
7 Indian 625 1.7%<br />
8 Pakistani 433 1.2%<br />
9 Bangladeshi 113 0.3%<br />
10 Any other Asian<br />
background<br />
216 0.6%<br />
11 Caribbean 302 0.8%<br />
12 African 271 0.7%<br />
13 Any other black<br />
background<br />
78 0.2%<br />
14 Chinese 86 0.2%<br />
15 Any other 328 0.9%<br />
Total 36344 100%<br />
NA 9<br />
Social and economic<br />
Applying to all who had ever been in<br />
paid employment, the categories in<br />
this variable are the divisions of the<br />
Standard Industrial Classification<br />
1992. However, this remains primarily<br />
to provide consistency with older data.<br />
The NTS now uses the breakdown<br />
given by SOC2000 (This is held in<br />
variable I274, although this is not listed<br />
here.)<br />
National Centre for Social Research<br />
82<br />
I79 Industry type<br />
1 Agriculture etc 467 1.8%<br />
2 Fishing 21 0.1%<br />
3 Mining, quarrying 222 0.8%<br />
4 Manufacturing 4775 18.0%<br />
5 Energy, water 327 1.2%<br />
6 Construction 1743 6.6%<br />
7 Wholesale, retail and<br />
motor trade<br />
3820 14.4%<br />
8 Hotels and restaurants 1153 4.3%<br />
9 Transport, storage and<br />
communication<br />
1737 6.5%<br />
10 Financial 1061 4.0%<br />
11 Real estate, renting<br />
and business activities<br />
2618 9.9%<br />
12 Public administration<br />
and defence<br />
1998 7.5%<br />
13 Education 2369 8.9%<br />
14 Health and social<br />
work<br />
3016 11.4%<br />
15 Other community,<br />
social and personal<br />
1076 4.1%<br />
16 Private households<br />
with employed persons<br />
145 0.5%<br />
17 Extra-territorial 9 0.0%<br />
organizations<br />
Total 26557 100%<br />
NA 294<br />
DNA 9502<br />
I80 Employee/self-employed<br />
1 Employee (current or<br />
last job)<br />
24136 89.9%<br />
2 Self-employed (current<br />
or last job)<br />
2719 10.1%<br />
Total 26855 100%<br />
DNA 9498<br />
Missing values for I80 are coded to 1,<br />
the most likely value.<br />
Both I79 and I80 refer to the<br />
respondent’s current job. For<br />
unemployed respondents, the<br />
questions refer to the respondent’s<br />
most recent employment.<br />
I177 Working status<br />
1 Employees: full-time 10891 37.9%<br />
2 Employees: part-time 3746 13.0%<br />
3 Self-employed: fulltime<br />
1504 5.2%
I177 Working status<br />
4 Self-employed: parttime<br />
415 1.4%<br />
5 ILO unemployed 575 2.0%<br />
6 Economically inactive:<br />
retired<br />
6982 24.3%<br />
7 Economically inactive:<br />
student<br />
962 3.3%<br />
8 Economically inactive: 1973 6.9%<br />
looking after family/home<br />
9 Economically inactive:<br />
permanently<br />
sick/disabled<br />
10 Economically<br />
inactive: temporarily<br />
sick/injured<br />
11 Economically<br />
inactive: other<br />
National Centre for Social Research<br />
1271 4.4%<br />
82 0.3%<br />
361 1.3%<br />
Total 28762 100%<br />
DNA 7591<br />
Applying to all persons aged 16 and<br />
over, this is the person’s working<br />
status in the preceding week. A<br />
‘student’ is someone attending a<br />
school or college full-time.<br />
Missing values are coded using the<br />
respondent’s age and sex.<br />
I178 Individual income<br />
1 Less than £1000 2267 7.9%<br />
2 £1000-£1999 818 2.8%<br />
3 £2000-£2999 1220 4.2%<br />
4 £3000-£3999 1231 4.3%<br />
5 £4000-£4999 1587 5.5%<br />
6 £5000-£5999 1968 6.8%<br />
7 £6000-£6999 1323 4.6%<br />
8 £7000-£7999 1054 3.7%<br />
9 £8000-£8999 2453 8.5%<br />
10 £9000-£9999 1046 3.6%<br />
11 £10000-£12499 2090 7.3%<br />
12 £12500-£14999 1842 6.4%<br />
13 £15000-£17499 1653 5.7%<br />
14 £17500-£19999 1858 6.5%<br />
15 £20000-£24999 2617 9.1%<br />
16 £25000-£29999 1388 4.8%<br />
17 £30000-£34999 840 2.9%<br />
18 £35000-£39999 544 1.9%<br />
19 £40000-£49999 489 1.7%<br />
20 £50000-£74999 315 1.1%<br />
21 £75000 or more 159 0.6%<br />
Total 28762 100%<br />
DNA 7591<br />
83<br />
I178 is asked of all respondents, and<br />
represents their gross income, before<br />
deductions are made for tax or<br />
National Insurance. This information<br />
was requested only as a weekly or<br />
annual banded figure, selected from a<br />
show card.<br />
In some cases where the related<br />
question was not answered, income is<br />
estimated by subtraction of the income<br />
of other household members from that<br />
of the whole household (H70). In<br />
others, it is imputed using data from<br />
the nearest record with income known,<br />
matching on various socio-economic<br />
factors such as age, sex and working<br />
status.<br />
I243 Government training scheme<br />
1 Yes 62 1.0%<br />
2 No 6412 99.0%<br />
Total 6474 100%<br />
NA 4<br />
DNA 29875<br />
I245 Unpaid work for family business<br />
1 Yes 46 0.4%<br />
2 No 12231 99.6%<br />
Total 12277 100%<br />
DNA 24076<br />
Variables I243 and I245 record<br />
whether the respondent was attending<br />
a government training course, or<br />
undertook any unpaid work for a family<br />
business in a seven-day period to the<br />
Sunday before the placement<br />
interview.<br />
The questions are asked of all<br />
respondents who say they did not do<br />
any paid work in this period (either as<br />
an employee, or as a self-employed<br />
person).
I276 Responsibility for supervising other<br />
employees<br />
1 Yes 7400 30.7%<br />
2 No 16678 69.3%<br />
Total 24078 100%<br />
NA 18<br />
DNA 12257<br />
I397 Employment status<br />
1 Self-employed: large<br />
establishment<br />
60 0.2%<br />
2 Self-employed: small<br />
establishment<br />
625 2.3%<br />
3 Self-employed: no<br />
employees<br />
2034 7.6%<br />
4 Manager: large<br />
establishment<br />
1842 6.9%<br />
5 Manager: small<br />
establishment<br />
933 3.5%<br />
6 Foreman or supervisor 5092 19.0%<br />
7 Employee 16229 60.5%<br />
Total 26815 100%<br />
NA 40<br />
DNA 9498<br />
I398 NS-SEC<br />
1 Employers in large<br />
organization<br />
43 0.2%<br />
2 Higher managerial 1162 4.4%<br />
3 Higher professional:<br />
traditional employees<br />
956 3.6%<br />
4 Higher professional:<br />
new employees<br />
357 1.3%<br />
5 Higher professional:<br />
traditional self-employed<br />
202 0.8%<br />
6 Higher professional:<br />
new self-employed<br />
43 0.2%<br />
7 Lower professional:<br />
traditional employees<br />
3044 11.4%<br />
8 Lower professional:<br />
new employees<br />
216 0.8%<br />
9 Lower professional:<br />
traditional self-employed<br />
237 0.9%<br />
10 Lower professional:<br />
new self-employed<br />
19 0.1%<br />
11 Lower managerial 1595 6.0%<br />
12 Higher supervisory 1017 3.8%<br />
13 Intermediate: clerical<br />
and admin<br />
1908 7.2%<br />
14 Intermediate: sales<br />
and service<br />
1247 4.7%<br />
National Centre for Social Research<br />
84<br />
I398 NS-SEC<br />
15 Intermediate:<br />
technical and auxiliary<br />
336 1.3%<br />
16 Intermediate:<br />
engineering<br />
109 0.4%<br />
17 Small organisation:<br />
non-professional<br />
486 1.8%<br />
18 Small organisation:<br />
agriculture<br />
37 0.1%<br />
19 Own account: nonprofessional<br />
1505 5.7%<br />
20 Own account:<br />
agriculture<br />
109 0.4%<br />
21 Lower supervisory 1931 7.3%<br />
22 Lower technical: craft 770 2.9%<br />
23 Lower technical:<br />
process operative<br />
214 0.8%<br />
24 Semi-routine: sales 1589 6.0%<br />
25 Semi-routine: service 1617 6.1%<br />
26 Semi-routine:<br />
technical<br />
435 1.6%<br />
27 Semi-routine:<br />
operative<br />
651 2.4%<br />
28 Semi-routine:<br />
agricultural<br />
88 0.3%<br />
29 Semi-routine: clerical 495 1.9%<br />
30 Semi-routine:<br />
childcare<br />
276 1.0%<br />
31 Routine: sales and 636 2.4%<br />
service<br />
32 Routine: productive 672 2.5%<br />
33 Routine: technical 1123 4.2%<br />
34 Routine: operative 1424 5.4%<br />
35 Routine: agricultural 53 0.2%<br />
Total 26602 100%<br />
DNA 9751<br />
I398 (National Statistics socioeconomic<br />
classification) was<br />
introduced from 2001 to replace the<br />
former SC (social class) and SEG<br />
(socio-economic group)<br />
measurements in all National Statistics<br />
surveys. It is based upon information<br />
given by the respondent, including<br />
their occupation (classified using the<br />
SOC2000 classification) and their<br />
employment status (whether they<br />
supervise other staff, are employed or<br />
self-employed etc.)<br />
Both I397 and I398 refer to the<br />
respondent’s current or most recent<br />
job.
Unemployment<br />
I244 Away from work on training scheme<br />
1 Yes 448 3.5%<br />
2 No 12238 96.2%<br />
3 Waiting to take up new<br />
job/business<br />
39 0.3%<br />
Total 12725 100%<br />
DNA 23628<br />
This question is asked of people who<br />
were not in paid work at the time of the<br />
placement interview.<br />
I247 Looking for work/training in last 4<br />
weeks<br />
1 Yes 602 5.0%<br />
2 No 11530 95.0%<br />
Total 12132 100%<br />
NA 1<br />
DNA 24220<br />
I248 Immediate availability for government<br />
training scheme<br />
1 Yes 572 85.5%<br />
2 No 97 14.5%<br />
Total 669 100%<br />
NA 4<br />
DNA 35680<br />
This question asks respondents over<br />
16, who were not working or on a<br />
training scheme whether they would<br />
have been able to attend a<br />
government training scheme within<br />
two weeks, had an opportunity to<br />
attend arisen.<br />
I249 Why not available for work<br />
1 Student 962 8.3%<br />
2 Looking after the<br />
family/home<br />
1972 17.0%<br />
3 Temporarily<br />
sick/injured<br />
82 0.7%<br />
4 Long-term sick or<br />
disabled<br />
1271 10.9%<br />
5 Retired from paid work 6979 60.0%<br />
6 Other 361 3.1%<br />
Total 11627 100%<br />
DNA 24726<br />
National Centre for Social Research<br />
85<br />
Some combination of questions to<br />
derive I244 and I247-I249 were asked<br />
of all people who did not do any paid<br />
work in the seven-day period to the<br />
Sunday prior to the placement<br />
interview. Exactly which of these<br />
questions were asked depended on<br />
their answers to other questions in this<br />
group.<br />
I250 Left last paid job<br />
1 Last 3 months 321 3.2%<br />
2 Last 3 to 6 months 280 2.8%<br />
3 6 months to 1 year 439 4.3%<br />
4 1-2 years 638 6.3%<br />
5 2-3 years 563 5.5%<br />
6 3-4 years 514 5.1%<br />
7 4-5 years 450 4.4%<br />
8 Over 5 years 6973 68.5%<br />
Total 10178 100%<br />
NA 129<br />
DNA 26046<br />
Variable I250 is recorded for all<br />
economically inactive people apart<br />
from those who have never worked.<br />
I300 Turned down job because of<br />
transport difficulties<br />
Multicoded<br />
1 Too far 29 40.8%<br />
2 Car not available 15 21.1%<br />
3 Can’t drive 16 22.5%<br />
4 Cost of petrol 0 0.0%<br />
5 Lack of parking 0 0.0%<br />
6 Cost of parking 0 0.0%<br />
7 Traffic<br />
congestion/roadworks<br />
1 1.4%<br />
8 Inadequate public<br />
transport<br />
40 56.3%<br />
9 Cost of public transport 9 12.7%<br />
10 Safety concerns 0 0.0%<br />
11 Physical<br />
1 1.4%<br />
difficulties/disability<br />
Other 5 7.0%<br />
Total 71 100%<br />
Haven’t turned down job 481<br />
DNA 35801<br />
This question asks applicable<br />
respondents whether, in the preceding<br />
12 months, they had turned down an
offer of employment owing to transport<br />
difficulties.<br />
I301 Transport difficulties preventing work<br />
Multicoded<br />
1 Too far 22 26.2%<br />
2 Car not available 34 40.5%<br />
3 Can’t drive 24 28.6%<br />
4 Cost of petrol 3 3.6%<br />
5 Lack of parking 1 1.2%<br />
6 Cost of parking 2 2.4%<br />
7 Traffic<br />
congestion/roadworks<br />
2 2.4%<br />
8 Inadequate public<br />
transport<br />
36 42.9%<br />
9 Cost of public transport 11 13.1%<br />
10 Safety concerns 6 7.1%<br />
11 Physical<br />
0 0.0%<br />
difficulties/disability<br />
Other 5 6.0%<br />
Total 84 100%<br />
NA 2<br />
DNA 35801<br />
I300 and I301 are derived for all<br />
economically inactive respondents of<br />
working age (except students).<br />
Work travel benefits<br />
I302 is asked of all employees, and<br />
records whether any employees at<br />
their place of work receive any of the<br />
benefits listed. I303 is asked of all<br />
those that answered I302 in the<br />
affirmative; it records benefits offered<br />
to the respondent themselves.<br />
The remaining questions in this<br />
section (I304-8, I395-6) indicate<br />
whether the respondent took<br />
advantage of the travel benefits<br />
offered to them.<br />
I302 Travel benefits at work<br />
Multi-coded<br />
1 Cut price or free bus<br />
tickets<br />
402 5.1%<br />
2 Cut price or free rail<br />
tickets<br />
397 5.0%<br />
3 Interest-free loan for a<br />
season ticket<br />
803 10.1%<br />
4 Interest-free loan for<br />
parking<br />
156 2.0%<br />
National Centre for Social Research<br />
86<br />
I302 Travel benefits at work<br />
5 Cut price or free car<br />
parking<br />
5388 67.8%<br />
6 Company car or<br />
alternative<br />
3317 41.7%<br />
7 Use of car from<br />
company pool<br />
938 11.8%<br />
8 Special bus or van for<br />
journey to work<br />
727 9.1%<br />
9 Other transport-related<br />
benefits<br />
973 12.2%<br />
Total 7946 100%<br />
None 6570<br />
NA 97<br />
DNA 21740<br />
I303 Travel benefits offered to me<br />
Multi-coded<br />
1 Cut price or free bus<br />
tickets<br />
263 4.1%<br />
2 Cut price or free rail<br />
tickets<br />
289 4.5%<br />
3 Interest-free loan for a<br />
season ticket<br />
502 7.8%<br />
4 Interest-free loan for<br />
parking<br />
74 1.1%<br />
5 Cut price or free car<br />
parking<br />
4543 70.6%<br />
6 Company car or<br />
alternative<br />
1277 19.8%<br />
7 Use of car from<br />
company pool<br />
503 7.8%<br />
8 Special bus or van for<br />
journey to work<br />
369 5.7%<br />
9 Other transport-related<br />
benefits<br />
678 10.5%<br />
Total 6437 100%<br />
None 1507<br />
NA 3<br />
DNA 28406<br />
I304 Use free/reduced price bus tickets<br />
1 Yes 215 76.5%<br />
2 No 66 23.5%<br />
Total 281 100%<br />
DNA 36072<br />
I305 Use free/reduced price train tickets<br />
1 Yes 215 76.5%<br />
2 No 66 23.5%<br />
Total 281 100%<br />
DNA 36072
I306 Use interest free travel loan<br />
1 Yes 172 34.4%<br />
2 No 328 65.6%<br />
Total 500 100%<br />
NA 1<br />
DNA 35852<br />
I307 Use employer’s bus/van<br />
1 Yes 242 66.1%<br />
2 No 124 33.9%<br />
Total 366 100%<br />
DNA 35987<br />
I308 Alternative to company car<br />
1 Offered a choice: took<br />
company car<br />
261 21.0%<br />
2 Offered a choice: took<br />
alternative<br />
304 24.4%<br />
3 No choice given 679 54.6%<br />
Total 1244 100%<br />
NA 3<br />
DNA 35106<br />
I395 Use interest free loan for parking<br />
season ticket<br />
1 Yes 14 18.9%<br />
2 No 60 81.1%<br />
Total 74 100%<br />
DNA 36279<br />
I396 Use cut price or free car parking<br />
1 Yes 4100 90.3%<br />
2 No 440 9.7%<br />
Total 4540 100%<br />
NA 1<br />
DNA 31812<br />
Tickets and passes<br />
The variables in this section record<br />
details of special tickets and transport<br />
passes held by respondents.<br />
Respondents were asked about details<br />
of each special ticket or transport pass<br />
they held, up to a maximum of six<br />
passes/tickets. Details for each<br />
ticket/pass were recorded in a different<br />
set of fields.<br />
National Centre for Social Research<br />
87<br />
The counts and percentages listed<br />
below apply only to the first ticket held<br />
by the respondent, and consequently,<br />
to the first variable listed in each title.<br />
The further variables listed apply to the<br />
second, third tickets and so forth, for<br />
which counts and percentages are not<br />
given here.<br />
I106/I126/I146/I357/I358/I359 Ticket/pass<br />
mode(s)<br />
1 Surface Rail 1217 15.3%<br />
2 LT/ Glasgow tube/<br />
Newcastle metro<br />
52 0.7%<br />
3 Bus 3862 48.5%<br />
4 Combined surface rail<br />
and bus – not London<br />
847 10.6%<br />
5 Combined tube and<br />
bus<br />
230 2.9%<br />
6 Combined surface rail<br />
and bus<br />
1370 17.2%<br />
7 Other single method 69 0.9%<br />
8 Other combination of<br />
methods<br />
313 3.9%<br />
Total 7960 100%<br />
DNA 28393<br />
Variable I106 (et al) records the<br />
modes of transport for which the<br />
respondent can use their special<br />
tickets. Missing values are patched<br />
from P2, P5, I5 and from other<br />
ticket/pass data.<br />
I185/I191/I197/I342/I347/I352 Ticket/pass<br />
type<br />
1 Season Ticket 572 7.2%<br />
2 Area travel card 682 8.6%<br />
3 Combined season<br />
ticket/area travel card<br />
130 1.6%<br />
4 Rail card 504 6.3%<br />
5 Other non-<br />
152 1.9%<br />
concessionary<br />
6 OAP pass 4087 51.3%<br />
7 Scholar’s pass 678 8.5%<br />
8 Disabled pass 321 4.0%<br />
9 Employee pass 210 2.6%<br />
10 Unemployed pass 0 0.0%<br />
11 Subsidised tokens 220 2.8%<br />
12 Other concessionary 404 5.1%<br />
Total 7960 100%<br />
DNA 28393
Non-concessionary tickets and passes<br />
(codes 1-5) refer to schemes devised<br />
by operators for commercial reasons.<br />
A season ticket is valid for trips within<br />
a specified period on one specific<br />
route. An area travel card is valid for<br />
travel within a specified period on any<br />
route within a specified area. A<br />
combined season/area travel card<br />
functions as a season ticket at one<br />
end of the route and as an area travel<br />
card at the other. Rail card includes<br />
Young Persons Railcard.<br />
Missing values are patched using P2,<br />
P5, I5, I79, I177 and other ticket<br />
details.<br />
I186/I192/I198/I343/I348/I353 Ticket/pass<br />
mode priority<br />
1 Surface rail only 1217 15.3%<br />
2 Surface rail and bus 183 2.3%<br />
3 Surface rail and<br />
underground<br />
93 1.2%<br />
4 Surface rail, bus and<br />
underground<br />
334 4.2%<br />
5 Surface rail and other 40 0.5%<br />
6 Underground / metro<br />
only<br />
52 0.7%<br />
7 underground / metro<br />
and surface rail<br />
12 0.2%<br />
8 Underground / metro<br />
and bus<br />
115 1.4%<br />
9 Underground / metro,<br />
surface rail and bus<br />
331 4.2%<br />
10 Underground and<br />
other<br />
22 0.3%<br />
11 Bus only 3865 48.6%<br />
12 Bus and surface rail 657 8.3%<br />
13 Bus and underground 110 1.4%<br />
14 Bus, surface rail and<br />
underground<br />
606 7.6%<br />
15 Bus and other 142 1.8%<br />
16 Other 181 2.3%<br />
Total 7960<br />
DNA 28393<br />
I186 (et al) is constructed from I106 (et<br />
al) and a further question asking<br />
respondents by which mode they<br />
travelled the furthest using the relevant<br />
special ticket.<br />
National Centre for Social Research<br />
88<br />
Missing values are patched using<br />
other ticket details, S2, S26 and S35.<br />
I187/I192/I199/I344/I349/I354 Ticket/pass<br />
validity<br />
1 One week 704 9.2%<br />
2 One month 526 6.9%<br />
3 3 months/ school term 156 2.0%<br />
4 6 months 28 0.4%<br />
5 1 year 2688 35.1%<br />
6 More than 1 year 2268 29.6%<br />
7 Unlimited 1227 16.0%<br />
8 Other period 66 0.9%<br />
9 Tokens etc. 0 0.0%<br />
Total 7663 100%<br />
NA 77<br />
DNA 28613<br />
I187 does not apply to subsidised<br />
tokens, which cover a set number of<br />
trips rather than a specified time<br />
period.<br />
I189/I195/I201/I346/I351/I356 Ticket/pass<br />
use<br />
Based on numeric variables<br />
I188/I194/I200/I345/I350/I355<br />
1 Less than 1 per year / 687 8.9%<br />
never<br />
2 1-2 times per year 440 5.7%<br />
3 3-4 times per year 527 6.8%<br />
4 5-12 times per year 582 7.5%<br />
5 12+ times per year, 422 5.5%<br />
less than once per week<br />
6 1-2 times per week 1099 14.2%<br />
7 3-4 times per week 718 9.3%<br />
8 5-6 times per week 628 8.1%<br />
9 7-8 times per week 276 3.6%<br />
10 9-10 times per week 1351 17.5%<br />
11 11-15 times per week 685 8.9%<br />
12 16-20 times per week 214 2.8%<br />
13 21+ time per week 111 1.4%<br />
Total 7740 100%<br />
DNA 28613<br />
I189 does not apply to subsidised<br />
tokens, which cover a set number of<br />
trips rather than a specified time<br />
period.<br />
Missing values are patched from other<br />
ticket details.
I205/I206/I207/I360/I361/I362 Ticket/pass<br />
weekly cost<br />
1 Nil 5136 66.4%<br />
2 1 to 49p 969 12.5%<br />
3 50 to 99p 44 0.6%<br />
4 £1 to £1.99 23 0.3%<br />
5 £2 to £2.99 22 0.3%<br />
6 £3 to £3.99 55 0.7%<br />
7 £4 to £4.99 114 1.5%<br />
8 £5 to £5.99 79 1.0%<br />
9 £6 to £7.99 244 3.2%<br />
10 £8 to £9.99 222 2.9%<br />
11 £10 to £14.99 255 3.3%<br />
12 £15 to £19.99 219 2.8%<br />
13 £20 and over 358 4.6%<br />
Total 7740 100%<br />
DNA 28613<br />
Missing values are imputed using<br />
other ticket details.<br />
Travel difficulties<br />
The questions in this section focus on<br />
difficulties in undertaking three travel<br />
activities: going out on foot, using<br />
buses, and getting in and out of a car.<br />
The variables identify people with<br />
mobility problems and give some<br />
indication of difficulty. Elderly people<br />
who felt that old age was the cause of<br />
their difficulty are included.<br />
I165 Travel difficulties<br />
1 Foot and bus 2235 7.8%<br />
2 Foot 2356 8.2%<br />
3 Bus 144 0.5%<br />
4 Disabled (Data NA) 0 0.0%<br />
5 No difficulties 24024 83.5%<br />
Total 28759 100%<br />
NA 3<br />
DNA 7591<br />
National Centre for Social Research<br />
89<br />
I212 Disabled drivers<br />
1 Disabled driver 2070 43.7%<br />
2 No longer drives<br />
(disability)<br />
446 9.4%<br />
3 No longer drives (other<br />
reason)<br />
150 3.2%<br />
4 Never had a license 2071 43.7%<br />
Total 4737 100%<br />
NA 1<br />
DNA 31615<br />
Variable I212 is derived from more<br />
than one question in the individual<br />
questionnaire. Respondents who<br />
reported difficulty going out on foot or<br />
using a bus, are asked whether they<br />
hold driving licences, whether they still<br />
drive and, if not, whether the reason<br />
they stopped driving was due to their<br />
disability, or for some other reason.<br />
I214 Years since last drove<br />
Based on numeric variable I213<br />
1 0-4 years 198 33.8%<br />
2 5-9 years 130 22.2%<br />
3 10-19 years 146 25.0%<br />
4 20+ years 111 19.0%<br />
Total 585 100%<br />
NA 13<br />
DNA 35755<br />
Variable I214 is recorded for all those<br />
who no longer drive (as recorded in<br />
I212).<br />
I290 Why difficult to use a bus<br />
Multi-coded<br />
1 Getting to the bus stop 1475 62.0%<br />
2 Identifying destination 110 4.6%<br />
3 Standing waiting at the<br />
bus stop<br />
1276 53.6%<br />
4 Getting on or off buses 1594 67.0%<br />
5 Getting to and from the<br />
seat<br />
980 41.2%<br />
6 Communicating with<br />
the driver/conductor<br />
157 6.6%<br />
7 Finding out timetable 125 5.3%<br />
information<br />
Other 321 13.5%<br />
Total 2379 100%<br />
DNA 33974
I363 Difficulties travelling by foot<br />
1 No walking difficulties 24168 84.0%<br />
2 Walking difficulties,<br />
can go out on own<br />
2963 10.3%<br />
3 Walking difficulties,<br />
needs assistance,<br />
impossible alone<br />
228 0.8%<br />
4 Walking difficulties,<br />
needs assistance,<br />
difficult alone<br />
571 2.0%<br />
5 Walking difficulties,<br />
doesn’t go out,<br />
impossible to go out<br />
443 1.5%<br />
6 Walking difficulties,<br />
doesn’t go out, difficult to<br />
go out<br />
386 1.3%<br />
Total 28759 100%<br />
NA 3<br />
DNA 7591<br />
I364 Disability causes difficulties in using<br />
local bus<br />
1 No difficulties 26383 91.7%<br />
2 Some difficulties, do<br />
use bus<br />
696 2.4%<br />
3 Some difficulties, don’t 1451 5.0%<br />
use bus, health reasons<br />
4 Some difficulties, don’t<br />
use bus, poor bus<br />
service<br />
73 0.3%<br />
5 Some difficulties, don’t<br />
use bus, other reasons<br />
159 0.6%<br />
Total 28762 100%<br />
DNA 7591<br />
Questions I363 and I364 are asked<br />
only of those over 15.<br />
I292 Special transport services available<br />
Multicoded<br />
1 Dial-a-ride service 1998 5.5%<br />
2 Supermarket bus 1384 3.8%<br />
3 Hospital car or service 1921 5.3%<br />
4 Day centre or service 890 2.4%<br />
5 Shared taxi scheme 128 0.4%<br />
6 Taxi voucher scheme 389 1.1%<br />
7 Postbus 61 0.2%<br />
8 Community-owned 599 1.6%<br />
minibus<br />
9 Other special service 163 0.4%<br />
Total 36353 100%<br />
Don’t know type 144<br />
Not aware of any of 1022<br />
these services<br />
NA 19<br />
DNA 31513<br />
National Centre for Social Research<br />
90<br />
The question that relates to variable<br />
I292 is asked of all who report<br />
problems with travelling on foot, by car<br />
or on the bus.<br />
The question asks respondents to<br />
answer 'as far as they know or have<br />
heard' and may not reflect the true<br />
picture in some cases.<br />
The scheme may not necessarily be<br />
available to the respondent<br />
themselves, or relevant to their<br />
particular needs.<br />
Travel to work<br />
Many of the questions in this section<br />
refer to a respondent’s ‘workplace’.<br />
Where there is any question about a<br />
person’s ‘usual workplace’, it is<br />
defined as the place visited regularly<br />
for work on at least two consecutive<br />
days per week (if the respondent<br />
works more than one day per week),<br />
for at least four consecutive weeks.<br />
Where this definition provides two (or<br />
more) possible candidates, the usual<br />
workplace is that visited more<br />
frequently. If the respondent visits all<br />
such locations with equal frequency,<br />
the one furthest from home is the<br />
usual workplace.<br />
I92 Workplace<br />
1 Same place 12710 76.9%<br />
2 Same place at least<br />
two consecutive days<br />
1259 7.6%<br />
3 Different places 2055 12.4%<br />
4 Home/same building<br />
as home<br />
505 3.1%<br />
Total 16529 100%<br />
NA 29<br />
DNA 19795<br />
I92 records whether working<br />
respondents worked at same place all<br />
through their preceding working week,<br />
or if the location of work varied.
Missing values are coded using I177.<br />
I180 Usual means of travel to work<br />
1 Car/van driver 9732 60.7%<br />
2 Car/van passenger 1110 6.9%<br />
3 Car/van either driver or 292 1.8%<br />
passenger<br />
4 Car no details 0 0.0%<br />
5 2 wheel motor vehicle 190 1.2%<br />
6 Bicycle 516 3.2%<br />
7 Bus 1249 7.8%<br />
8 Surface Rail 603 3.8%<br />
9 LT Underground / light<br />
rail<br />
380 2.4%<br />
10 Walk 1751 10.9%<br />
11 Taxi/minicab 75 0.5%<br />
12 Other 126 0.8%<br />
Total 16024 100%<br />
DNA 20329<br />
I180 is asked of respondents in paid<br />
employment, and working somewhere<br />
that is not their own home.<br />
Respondents who used a mixture of<br />
methods were asked to nominate one<br />
that they considered the ‘main’<br />
method. ‘Bus’ includes coaches and<br />
buses provided by an employer.<br />
Missing values are patched using<br />
I184, J28, I177 and I188.<br />
I220 County of workplace<br />
1 Avon 227 1.6%<br />
2 Bedfordshire 112 0.8%<br />
3 Berkshire 217 1.6%<br />
4 Buckinghamshire 149 1.1%<br />
5 Cambridgeshire 260 1.9%<br />
6 Cheshire 252 1.8%<br />
7 Cleveland 87 0.6%<br />
8 Cornwall 58 0.4%<br />
9 Cumbria 218 1.6%<br />
10 Derbyshire 206 1.5%<br />
11 Devon 342 2.4%<br />
12 Dorset 110 0.8%<br />
13 Durham 96 0.7%<br />
14 East Sussex 110 0.8%<br />
15 Essex 333 2.4%<br />
16 Gloucestershire 224 1.6%<br />
17 Greater Manchester 589 4.2%<br />
18 Hampshire 408 2.9%<br />
19 Hereford and<br />
Worcester<br />
145 1.0%<br />
20 Hertfordshire 169 1.2%<br />
National Centre for Social Research<br />
91<br />
I220 County of workplace<br />
21 Humberside 208 1.5%<br />
22 Isle of Wight 20 0.1%<br />
23 Kent 328 2.3%<br />
24 Lancashire 265 1.9%<br />
25 Leicestershire 243 1.7%<br />
26 Lincolnshire 210 1.5%<br />
27 London Central 640 4.6%<br />
28 Other Inner London 456 3.3%<br />
31 Other London not 702 5.0%<br />
Central<br />
32 Merseyside 268 1.9%<br />
33 Norfolk 178 1.3%<br />
34 Northamptonshire 114 0.8%<br />
35 Northumberland 119 0.9%<br />
36 North Yorkshire 254 1.8%<br />
37 Nottinghamshire 294 2.1%<br />
38 Oxfordshire 218 1.6%<br />
39 Shropshire 121 0.9%<br />
40 Somerset 185 1.3%<br />
41 South Yorkshire 243 1.7%<br />
42 Staffordshire 234 1.7%<br />
43 Suffolk 206 1.5%<br />
44 Surrey 174 1.2%<br />
45 Tyne and Wear 274 2.0%<br />
46 Warwickshire 111 0.8%<br />
47 West Midlands 687 4.9%<br />
48 West Sussex 180 1.3%<br />
49 West Yorkshire 503 3.6%<br />
50 Wiltshire 219 1.6%<br />
51 Clwyd 102 0.7%<br />
52 Dyfed 77 0.6%<br />
53 Gwent 115 0.8%<br />
54 Gwynedd 104 0.7%<br />
55 Mid Glamorgan 109 0.8%<br />
56 Powys 14 0.1%<br />
57 South Glamorgan 127 0.9%<br />
58 West Glamorgan 64 0.5%<br />
59 Borders 16 0.1%<br />
60 Central 113 0.8%<br />
61 Dumfries and 12 0.1%<br />
Galloway<br />
62 Fife 62 0.4%<br />
63 Grampian 154 1.1%<br />
64 Highlands 56 0.4%<br />
65 Lothian 233 1.7%<br />
66 Strathclyde 522 3.7%<br />
67 Tayside 82 0.6%<br />
68 Essex within M25 0 0.0%<br />
69 Hertfordshire within 39 0.3%<br />
M25<br />
70 Kent within M25 3 0.0%<br />
71 Surrey within M25 18 0.1%<br />
Total 13988 100%<br />
DNA 22365
Missing values are patched using J24,<br />
J26, J57 and J58.<br />
I267 UA of workplace<br />
1 Bath and North East<br />
Somerset<br />
30 0.2%<br />
2 Bedfordshire 59 0.4%<br />
3 Blackburn with Darwen 52 0.4%<br />
4 Blackpool 32 0.2%<br />
5 Bournemouth 19 0.1%<br />
6 Bracknell Forest 21 0.2%<br />
7 Brighton and Hove 33 0.2%<br />
8 Bristol, City of 152 1.1%<br />
9 Buckinghamshire 100 0.7%<br />
10 Cambridgeshire 178 1.3%<br />
11 Cheshire 177 1.3%<br />
12 Cornwall and Isles of<br />
Scilly<br />
58 0.4%<br />
13 Cumbria 218 1.3%<br />
14 Darlington 11 0.1%<br />
15 Derby 65 0.5%<br />
16 Derbyshire 141 1.0%<br />
17 Devon 296 2.1%<br />
18 Dorset 66 0.5%<br />
19 Durham 85 0.6%<br />
20 East Riding of<br />
Yorkshire<br />
46 0.3%<br />
21 East Sussex 76 0.5%<br />
22 Essex (area outside<br />
M25)<br />
276 2.0%<br />
23 Essex (area within<br />
M25)<br />
0 0.0%<br />
24 Gloucestershire 223 1.6%<br />
25 Greater Manchester 589 4.2%<br />
26 Halton 32 0.2%<br />
27 Hampshire 236 1.7%<br />
28 Hartlepool 11 0.1%<br />
29 Herefordshire 74 0.5%<br />
30 Hertfordshire (area<br />
outside M25)<br />
169 1.2%<br />
31 Hertfordshire (area<br />
within M25)<br />
39 0.3%<br />
32 Inner London 454 3.3%<br />
33 Isle of Wight 20 0.1%<br />
34 Kent (area outside<br />
M25)<br />
305 2.2%<br />
35 Kent (area within<br />
M25)<br />
3 0.0%<br />
36 Kingston upon Hull,<br />
City of<br />
63 0.5%<br />
37 Lancashire 181 1.3%<br />
38 Leicester 97 0.7%<br />
39 Leicestershire 141 1.0%<br />
40 Lincolnshire 210 1.5%<br />
National Centre for Social Research<br />
92<br />
I267 UA of workplace<br />
41 London Central 640 4.6%<br />
42 London Outer 699 5.0%<br />
43 Luton 53 0.4%<br />
44 Medway Towns 19 0.1%<br />
45 Merseyside 268 1.9%<br />
46 Middlesbrough 23 0.2%<br />
47 Milton Keynes 49 0.4%<br />
48 Newbury 14 0.1%<br />
49 Norfolk 178 1.3%<br />
50 North East<br />
45 0.3%<br />
Lincolnshire<br />
51 North Lincolnshire 53 0.4%<br />
52 North Somerset 33 0.2%<br />
53 North Yorkshire 190 1.4%<br />
54 Northamptonshire 113 0.8%<br />
55 Northumberland 117 0.8%<br />
56 Nottingham 156 1.1%<br />
57 Nottinghamshire 137 1.0%<br />
58 Oxfordshire 216 1.5%<br />
59 Peterborough 82 0.6%<br />
60 Plymouth 12 0.1%<br />
61 Poole 24 0.2%<br />
62 Portsmouth 96 0.7%<br />
63 Reading 58 0.4%<br />
64 Redcar & Cleveland 21 0.2%<br />
65 Rutland 4 0.0%<br />
66 Shropshire 72 0.5%<br />
67 Slough 49 0.4%<br />
68 Somerset 186 1.3%<br />
69 South<br />
12 0.1%<br />
Gloucestershire<br />
70 South Yorkshire 243 1.7%<br />
71 Southampton 76 0.5%<br />
72 Southend on Sea 36 0.3%<br />
73 Staffordshire 141 1.0%<br />
74 Stockton-on-Tees 31 0.2%<br />
75 Stoke-on-Trent 91 0.7%<br />
76 Suffolk 205 1.5%<br />
77 Surrey (area outside<br />
M25)<br />
174 1.2%<br />
78 Surrey (area within 18 0.1%<br />
M25)<br />
79 Swindon 107 0.8%<br />
80 The Wrekin 48 0.3%<br />
81 Thurrock 18 0.1%<br />
82 Torbay 33 0.2%<br />
83 Tyne and Wear 273 2.0%<br />
84 Warrington 42 0.3%<br />
85 Warwickshire 111 0.8%<br />
86 West Midlands 684 4.9%<br />
87 West Sussex 180 1.3%<br />
88 West Yorkshire 503 3.6%<br />
89 Wiltshire 111 0.8%<br />
90 Windsor & 48 0.3%
I267 UA of workplace<br />
Maidenhead<br />
91 Wokingham 27 0.2%<br />
92 Worcestershire 69 0.5%<br />
93 York 64 0.5%<br />
94 Aberdeen City 142 1.0%<br />
95 Aberdeenshire 10 0.1%<br />
96 Angus 28 0.2%<br />
97 Argyll and Bute 34 0.2%<br />
98 Clackmannshire 5 0.0%<br />
99 Dumfries & Galloway 12 0.1%<br />
100 Dundee, City of 31 0.2%<br />
101 East Ayrshire 31 0.2%<br />
102 East Dunbartonshire 0 0.0%<br />
103 East Lothian 8 0.1%<br />
104 East Renfrewshire 10 0.1%<br />
105 Edinburgh, City of 166 1.2%<br />
106 Falkirk 67 0.5%<br />
107 Fife 62 0.4%<br />
108 Glasgow, City of 204 1.5%<br />
109 Highland 51 0.4%<br />
110 Inverclyde 19 0.1%<br />
111 Midlothian 15 0.1%<br />
112 Moray 2 0.0%<br />
113 North Ayrshire 24 0.2%<br />
114 North Lanarkshire 43 0.3%<br />
115 Orkney Islands 1 0.0%<br />
116 Perth and Kinross 22 0.2%<br />
117 Renfrewshire 33 0.2%<br />
118 Scottish Borders 16 0.1%<br />
119 Shetland Islands 1 0.0%<br />
120 South Ayrshire 15 0.1%<br />
121 South Lanarkshire 72 0.5%<br />
122 Stirling 41 0.3%<br />
123 West<br />
35 0.3%<br />
Dunbartonshire<br />
124 West Lothian 44 0.3%<br />
125 Western Isles 1 0.0%<br />
126 Blaenau Gwent 11 0.1%<br />
127 Bridgend 15 0.1%<br />
128 Caerphilly 32 0.2%<br />
129 Cardiff 119 0.9%<br />
130 Carmarthenshire 29 0.2%<br />
131 Ceredigion 28 0.2%<br />
132 Conwy 7 0.1%<br />
133 Denbighshire 38 0.3%<br />
134 Flintshire 34 0.2%<br />
135 Gwynedd 82 0.6%<br />
136 Isle of Anglesey 18 0.1%<br />
137 Merthyr Tydfil 40 0.3%<br />
138 Monmouthshire 41 0.3%<br />
139 Neath and Port<br />
Talbot<br />
32 0.2%<br />
140 Newport 49 0.4%<br />
141 Pembrokeshire 20 0.1%<br />
National Centre for Social Research<br />
93<br />
I267 UA of workplace<br />
142 Powys 14 0.1%<br />
143 Rhondda, Cynon,<br />
Taff<br />
28 0.2%<br />
144 Swansea 32 0.2%<br />
145 Torfaen 7 0.1%<br />
146 Vale of Glamorgan 8 0.1%<br />
147 Wrexham 27 0.2%<br />
Total 13946 100%<br />
NA 8<br />
DNA 22399<br />
Missing values are patched using J24,<br />
J26, J57 and J58.<br />
I270 Work place urban/rural<br />
1 Inner London 1094 7.8%<br />
2 Outer London built-up<br />
area<br />
912 6.5%<br />
3 West Midlands built-up<br />
area<br />
549 3.9%<br />
4 Greater Manchester<br />
built-up area<br />
582 4.2%<br />
5 West Yorkshire builtup<br />
area<br />
417 3.0%<br />
6 Glasgow built-up area 204 1.5%<br />
7 Liverpool built-up area 196 1.4%<br />
8 Tyneside built-up area 243 1.7%<br />
9 Other urban over 250K 1995 14.3%<br />
10 Other urban over<br />
100K to 250K<br />
1886 13.5%<br />
11 Other urban over 50K<br />
to 100K<br />
1329 9.5%<br />
12 Other urban over 25K<br />
to 50K<br />
1417 10.2%<br />
13 Other urban over 10K<br />
to 25K<br />
1435 10.3%<br />
14 Other urban over 3K<br />
to 10K<br />
849 6.1%<br />
15 Rural 838 6.0%<br />
Total 13946 100%<br />
NA 13<br />
DNA 22394<br />
I314 Difficulties with car trips going to work<br />
Multi-coded<br />
1 No difficulties 6812 60.3%<br />
2 Too far/long journey 188 1.7%<br />
3 Cost of petrol 196 1.7%<br />
4 Lack of parking<br />
facilities<br />
298 2.6%<br />
5 Cost of parking 127 1.1%<br />
6 Personal disability 9 0.1%<br />
7 Concerns over<br />
personal safety<br />
110 1.0%
I314 Difficulties with car trips going to work<br />
8 Traffic<br />
congestion/roadworks<br />
4142 36.7%<br />
9 The weather 324 2.9%<br />
10 Other 118 1.0%<br />
Total 11288 100%<br />
NA 35<br />
DNA 25030<br />
I315 Most difficult problem with car trips<br />
going to work<br />
1 No difficulties 6812 60.4%<br />
2 Too far / long journey 77 0.7%<br />
3 Cost of petrol 54 0.5%<br />
4 Lack of parking<br />
facilities<br />
137 1.2%<br />
5 Cost of parking 31 0.3%<br />
6 Personal disability 7 0.1%<br />
7 Concerns over<br />
personal safety<br />
33 0.3%<br />
8 Traffic<br />
3949 35.0%<br />
congestion/roadworks<br />
9 The weather 113 1.0%<br />
10 Other 74 0.7%<br />
Total 25030 100%<br />
NA 36<br />
DNA 25030<br />
I316 Travel to work another way<br />
1 Very easy 1599 14.2%<br />
2 Quite easy 2419 21.4%<br />
3 Neither easy nor<br />
difficult<br />
732 6.5%<br />
4 Quite difficult 2298 20.4%<br />
5 Very difficult 4235 37.5%<br />
Total 11283 100%<br />
NA 40<br />
DNA 25030<br />
I316 is recorded for all respondents<br />
who had a regular trip to work, for<br />
which they used a car or motorcycle<br />
as their usual main method of travel.<br />
The relevant question asks how easy<br />
the respondent would find it to make<br />
their trip to or from work using another<br />
method.<br />
National Centre for Social Research<br />
94<br />
I317 Why difficult to travel to work another<br />
way<br />
Multi-coded<br />
1 Too far/long journey 1907 29.2%<br />
2 Not possible by public<br />
transport<br />
3085 47.2%<br />
3 Distance to public<br />
transport<br />
294 4.5%<br />
4 Unreliable public<br />
transport<br />
1216 18.6%<br />
5 Cost of using public<br />
transport/taxis<br />
380 5.8%<br />
6 Poor information about<br />
public transport<br />
144 2.2%<br />
7 Poor connections 1944 29.8%<br />
8 Public transport<br />
unpleasant<br />
135 2.1%<br />
9 Personal disability 54 0.8%<br />
10 Concerns over<br />
personal safety<br />
105 1.6%<br />
11 Traffic<br />
congestion/roadworks<br />
210 3.2%<br />
12 Difficulties with<br />
dropping other people off<br />
168 2.6%<br />
13 Vehicle essential for 576 8.8%<br />
job<br />
14 The weather 86 1.3%<br />
15 Other 179 2.7%<br />
Total 6532 100%<br />
NA 1<br />
DNA 29820<br />
I318 Most difficult problem with travelling<br />
another way<br />
1 Too far/long journey 1061 16.5%<br />
2 Not possible by public<br />
transport<br />
2600 40.4%<br />
3 Distance to public<br />
transport<br />
86 1.3%<br />
4 Unreliable public<br />
transport<br />
564 8.8%<br />
5 Cost of using public<br />
transport/taxis<br />
69 1.1%<br />
6 Poor information about<br />
public transport<br />
36 0.6%<br />
7 Poor connections 1193 18.5%<br />
8 Public transport<br />
unpleasant<br />
28 0.4%<br />
9 Personal disability 45 0.7%<br />
10 Concerns over<br />
personal safety<br />
37 0.6%<br />
11 Traffic<br />
congestion/roadworks<br />
59 0.9%<br />
12 Difficulties with<br />
dropping other people off<br />
113 1.8%
I318 Most difficult problem with travelling<br />
another way<br />
13 Vehicle essential for<br />
job<br />
7 0.1%<br />
14 The weather 496 7.7%<br />
15 Other 138 2.1%<br />
Total 6439 100%<br />
NA 1<br />
DNA 29820<br />
I317 and I318 are recorded for all<br />
respondents who answer (in I316) that<br />
they would find it ‘quite difficult’ or<br />
‘very difficult’ to travel to work using an<br />
alternative method to car/motorbike.<br />
Variable I317 captures all difficulties<br />
reported; variable I318 captures only<br />
the one considered by the respondent<br />
to be the single most important.<br />
I319 Any difficulties travelling to work by<br />
other modes<br />
Multicoded<br />
1 No difficulties 3113 66.3%<br />
2 Too far/long journey 79 1.7%<br />
3 Journey not possible<br />
by public transport<br />
43 0.9%<br />
4 Unreliable public<br />
transport<br />
868 18.5%<br />
5 Cost of using public<br />
transport/taxis<br />
98 2.1%<br />
6 Poor information about<br />
public transport<br />
79 1.7%<br />
7 Poor connections 170 3.6%<br />
8 Public transport<br />
unpleasant<br />
250 5.3%<br />
9 Personal disability 27 0.6%<br />
10 Concerns over<br />
personal safety<br />
157 3.3%<br />
11 Traffic<br />
congestion/roadworks<br />
374 8.0%<br />
12 Lack of/no cycle 31 0.7%<br />
lanes<br />
13 The weather 190 4.0%<br />
14 Other 81 1.7%<br />
Total 4696 100%<br />
NA 4<br />
DNA 31653<br />
National Centre for Social Research<br />
95<br />
I320 Most difficult problem travelling by<br />
other modes<br />
1 No difficulties 3113 66.3%<br />
2 Too far/long journey 34 0.7%<br />
3 Journey not possible<br />
by public transport<br />
19 0.4%<br />
4 Unreliable public<br />
transport<br />
752 16.0%<br />
5 Cost of using public<br />
transport/taxis<br />
31 0.7%<br />
6 Poor information about<br />
public transport<br />
8 0.2%<br />
7 Poor connections 65 1.4%<br />
8 Public transport<br />
unpleasant<br />
81 1.7%<br />
9 Personal disability 15 0.3%<br />
10 Concerns over<br />
personal safety<br />
102 2.2%<br />
11 Traffic<br />
congestion/roadworks<br />
273 5.8%<br />
12 Lack of/no cycle<br />
lanes<br />
15 0.3%<br />
13 The weather 126 2.7%<br />
14 Other 61 1.3%<br />
Total 4695 100%<br />
NA 5<br />
DNA 31653<br />
I319 and I320 represent problems<br />
faced by those who travel to work by<br />
any method other than private car or<br />
motorcycle. I319 captures all such<br />
problems; I320 captures only the<br />
problem considered by the respondent<br />
to be the single most important.<br />
I321 Car unused while at work<br />
1 All cars usually in use 450 39.3%<br />
2 Car unused, but<br />
respondent not insured<br />
to drive it<br />
40 3.5%<br />
3 Car unused and<br />
respondent is insured to<br />
drive it<br />
656 57.2%<br />
Total 1146 100%<br />
NA 15<br />
DNA 35192
I322 Why don’t use car for work<br />
Multicoded<br />
1 Quicker by public<br />
transport<br />
663 56.4%<br />
2 Cheaper by public<br />
transport<br />
239 20.3%<br />
3 Enjoys using public<br />
transport<br />
206 17.5%<br />
4 Healthier to use public<br />
transport<br />
239 20.3%<br />
5 Can work/rest/read on<br />
train/bus etc.<br />
31 2.6%<br />
6 Too far/long journey 39 3.3%<br />
7 Don’t have current<br />
driving licence<br />
1 0.1%<br />
8 Don’t like driving 36 3.1%<br />
9 Cost of petrol 42 3.6%<br />
10 Lack of parking 261 22.2%<br />
11 Cost of parking 187 15.9%<br />
12 Personal disability 2 0.2%<br />
13 Concerns over public<br />
safety<br />
7 0.6%<br />
14 Traffic<br />
congestion/roadworks<br />
159 13.5%<br />
15 Environmental<br />
concerns<br />
64 5.4%<br />
Other 125 10.6%<br />
Total 1176 100%<br />
DNA 35177<br />
I323 Main reason don’t use car for work<br />
1 Quicker by public<br />
transport<br />
522 44.4%<br />
2 Cheaper by public<br />
transport<br />
71 6.0%<br />
3 Enjoys using public<br />
transport<br />
85 7.2%<br />
4 Healthier to use public<br />
transport<br />
111 9.4%<br />
5 Can work/rest/read on<br />
train/bus etc.<br />
7 0.6%<br />
6 Too far/long journey 13 1.1%<br />
7 Don’t have current<br />
driving licence<br />
1 0.1%<br />
8 Don’t like driving 16 1.4%<br />
9 Cost of petrol 3 0.3%<br />
10 Lack of parking 109 9.3%<br />
11 Cost of parking 75 6.4%<br />
12 Personal disability 0 0.0%<br />
13 Concerns over public<br />
safety<br />
1 0.1%<br />
14 Traffic<br />
congestion/roadworks<br />
61 5.2%<br />
15 Environmental<br />
concerns<br />
13 1.1%<br />
National Centre for Social Research<br />
96<br />
Other 88 7.5%<br />
Total 1176 100%<br />
DNA 35177<br />
Questions I321-I323 are asked of<br />
respondents who have driving<br />
licences, have household cars or vans<br />
and who list their usual method of<br />
travel to work as something other than<br />
car or motorcycle.<br />
Question I322 asks for all reasons that<br />
the respondent leaves their car<br />
unused while the respondent is at<br />
work, while variable I323 codes only<br />
the most important reason.<br />
Driving<br />
I182 Driving licence<br />
1 Full car/motorcycle <strong>2003</strong> 7.0%<br />
2 Full car only 17819 62.0%<br />
3 Full car only<br />
(automatic)<br />
136 0.5%<br />
4 Full car only (adapted) 11 0.0%<br />
5 Full motorcycle only 50 0.2%<br />
6 Full moped 7 0.0%<br />
7 Full invalid vehicle 0 0.0%<br />
8 Full no details 2 0.0%<br />
9 Provisional<br />
car/motorcycle<br />
310 1.1%<br />
10 Provisional car 1473 5.1%<br />
11 Provisional invalid car 0 0.0%<br />
12 Provisional other 22 0.1%<br />
13 Provisional no details 1 0.0%<br />
14 None 6928 24.1%<br />
Total 28762 100%<br />
DNA 7591<br />
Variable I182 is derived from several<br />
questions, asked of all respondents<br />
aged 16 and over. Respondents were<br />
specifically asked about licences valid<br />
in Great Britain to drive cars, twowheeled<br />
vehicles and invalid cars,<br />
distinguishing provisional licences<br />
from full, and the type(s) of vehicle for<br />
which they were valid.<br />
Foreign licences that are valid for use<br />
in this country are included.
Missing values are imputed from I3<br />
and I6.<br />
I183 Driving experience<br />
1 No licence 6928 24.2%<br />
2 Provisional only 1806 6.3%<br />
3 Full licence under 2<br />
years<br />
436 1.5%<br />
4 Full licence 2-3 years 536 1.9%<br />
5 Full licence 4-5 years 564 2.0%<br />
6 Full licence 6-7 years 636 2.2%<br />
7 Full licence 8-10 years 1168 4.1%<br />
8 Full licence 11-14<br />
years<br />
2043 7.1%<br />
9 Full licence 15-19<br />
years<br />
2479 8.7%<br />
10 Full licence 20-24<br />
years<br />
2458 8.6%<br />
11 Full licence 25-29<br />
years<br />
2087 7.3%<br />
12 Full licence 30-39<br />
years<br />
3937 13.7%<br />
13 Full licence 40-49<br />
years<br />
2416 8.4%<br />
14 Full licence 50+ years 1140 4.0%<br />
Total 28634 0.4%<br />
NA 128<br />
DNA 7591<br />
I183 is asked of all respondents with<br />
any type of driving licence.<br />
I203 Access to car<br />
1 Main driver of<br />
company car<br />
959 2.6%<br />
2 Other main driver 14762 40.6%<br />
3 Not main driver of<br />
household car<br />
3202 8.8%<br />
4 Household car but<br />
non-driver<br />
10246 28.2%<br />
5 Driver but no car 1048 2.9%<br />
6 Non driver and no car 6136 16.9%<br />
Total 36353 100%<br />
The definition of ‘car’ in this context<br />
includes ordinary cars, Jeeps, Land<br />
Rovers, light vans, minibuses and<br />
dormobiles.<br />
The ‘main driver’ of a vehicle is the<br />
person who generally drives the most<br />
miles in the car. This may not be the<br />
National Centre for Social Research<br />
97<br />
same person to whom the car is<br />
registered or assigned.<br />
A ‘driver’ is any person who holds a<br />
full driving licence valid for at least one<br />
household car.<br />
Conversely, a ‘non-driver’ is somebody<br />
who does not hold a full driving<br />
licence, valid for at least one<br />
household car.<br />
Some respondents may be the main<br />
driver of more than one household car.<br />
Missing values are patched from H55,<br />
V3, V9, V112, V160, I1, I5 and I182.<br />
Home working<br />
I257 Work at home instead of usual<br />
workplace<br />
1 Yes 820 5.1%<br />
2 No 15199 94.9%<br />
Total 16019 100%<br />
NA 5<br />
DNA 20329<br />
I257 is asked only of people who are<br />
employed, and do not normally work at<br />
home. It records whether the<br />
respondent worked at home, in the<br />
seven-day period to the Sunday prior<br />
to the placement interview.<br />
I258 Day of week worked at home<br />
Multicoded<br />
1 Monday 328 40.4%<br />
2 Tuesday 341 42.0%<br />
3 Wednesday 340 41.9%<br />
4 Thursday 327 40.3%<br />
5 Friday 328 40.4%<br />
6 Saturday 87 10.7%<br />
7 Sunday 89 11.0%<br />
Total 812 100%<br />
Day not known 8<br />
Worked at home status<br />
not known<br />
5<br />
DNA 35528<br />
I258 is asked of all people who<br />
recorded ‘Yes’ for I257, and records all
days worked at home in the same time<br />
period.<br />
I309 Possible to work at home?<br />
1 Yes 1638 10.8%<br />
2 No 13560 89.2%<br />
Total 15198 100%<br />
NA 1<br />
DNA 21154<br />
I309 is asked of all people who<br />
answered ‘No’ for the question relating<br />
to I257, and records whether it would<br />
be possible to do their kind of work at<br />
home. It records a ‘Yes’ value for all<br />
people who could sometimes work at<br />
home, and for those who could do so if<br />
it were possible to borrow appropriate<br />
equipment (a laptop, for example) from<br />
work.<br />
I310 How often worked at home<br />
1 3 or more times a<br />
week<br />
234 9.6%<br />
2 Once or twice a week 441 18.0%<br />
3 Less than once a<br />
week, more than twice a<br />
month<br />
161 6.6%<br />
4 Once or twice a month 394 16.1%<br />
5 Less than once a<br />
month, more than twice<br />
a year<br />
263 10.7%<br />
6 Once or twice a year 224 9.1%<br />
7 Less than once a year<br />
or never<br />
732 29.9%<br />
Total 2449 100%<br />
NA 9<br />
DNA 33895<br />
I310 records how often the respondent<br />
normally works at home. This figure<br />
excludes additional work done outside<br />
of the respondent’s normal working<br />
hours.<br />
I311 Why not work at home (more often)<br />
Multicoded<br />
1 Do not have<br />
equipment at home<br />
137 18.7%<br />
2 Employer does not<br />
allow it<br />
382 52.2%<br />
3 Just prefer not to 189 25.8%<br />
National Centre for Social Research<br />
98<br />
4 No space to work at<br />
home<br />
27 3.7%<br />
5 Children at home 19 2.6%<br />
6 Other reason 58 7.9%<br />
Total 732 100%<br />
DNA 35621<br />
I311 is only recorded for respondents<br />
who record that they work at home<br />
less than once a year or never. It<br />
codes all reasons that apply.<br />
I312 Possible to work at home without<br />
telephone<br />
1 Would be possible<br />
without<br />
65 4.7%<br />
2 Would sometimes be<br />
possible<br />
226 16.3%<br />
3 Would never be<br />
possible<br />
1092 79.0%<br />
Total 1383 100%<br />
Don’t use telephone 334<br />
DNA 34636<br />
I313 Possible to work at home without a<br />
computer<br />
1 Would be possible<br />
without<br />
75 5.2%<br />
2 Would sometimes be<br />
possible<br />
193 13.5%<br />
3 Would never be<br />
possible<br />
1166 81.3%<br />
Total 1434 100%<br />
Don’t use computer 283<br />
DNA 34636<br />
I312 and I313 are based upon<br />
questions asked of people who work at<br />
home at least once or twice a year<br />
(from I310), or worked at home in the<br />
preceding 7-day period (from I257).<br />
Public transport use<br />
I261 Frequency of bus use<br />
<strong>2003</strong> only, Modular<br />
1 3 or more times a<br />
week<br />
3094 15.9%<br />
2 Once or twice a week 2140 11.0%<br />
3 Less than once per<br />
week, more than twice a<br />
month<br />
795 4.1%
I261 Frequency of bus use<br />
4 Once or twice a month 1429 7.3%<br />
5 Less than once a<br />
month, more than twice<br />
a year<br />
1431 7.4%<br />
6 Once or twice a year 1913 9.8%<br />
7 Less than once a year<br />
or never<br />
8658 44.5%<br />
Total 19460 100%<br />
NA 7<br />
DNA 16886<br />
I262 Frequency of express bus/coach use<br />
<strong>2003</strong> only, Modular<br />
1 3 or more times a<br />
week<br />
48 0.2%<br />
2 Once or twice a week 76 0.4%<br />
3 Less than once per<br />
week, more than twice a<br />
month<br />
70 0.4%<br />
4 Once or twice a month 234 1.2%<br />
5 Less than once a<br />
month, more than twice<br />
a year<br />
676 3.5%<br />
6 Once or twice a year 2070 10.6%<br />
7 Less than once a year<br />
or never<br />
16287 83.7%<br />
Total 19461 100%<br />
NA 6<br />
DNA 16886<br />
I263 Frequency of surface rail use<br />
<strong>2003</strong> only, Modular<br />
1 3 or more times a<br />
week<br />
484 2.5%<br />
2 Once or twice a week 484 2.5%<br />
3 Less than once per<br />
week, more than twice a<br />
month<br />
453 2.3%<br />
4 Once or twice a month 1377 7.1%<br />
5 Less than once a<br />
month, more than twice<br />
a year<br />
2526 13.0%<br />
6 Once or twice a year 3872 19.9%<br />
7 Less than once a year<br />
or never<br />
10265 52.7%<br />
Total 19461 100%<br />
NA 6<br />
DNA 16886<br />
I264 Frequency of taxi/minicab use<br />
<strong>2003</strong> only, Modular<br />
1 3 or more times a<br />
week<br />
523 2.7%<br />
2 Once or twice a week 1687 8.7%<br />
National Centre for Social Research<br />
99<br />
I264 Frequency of taxi/minicab use<br />
3 Less than once per<br />
week, more than twice a<br />
month<br />
884 4.5%<br />
Once or twice a month 2328 12.0%<br />
Less than once a month,<br />
more than twice a year<br />
2548 13.1%<br />
Once or twice a year 3072 15.8%<br />
Less than once a year or<br />
never<br />
8419 43.3%<br />
Total 19461 100%<br />
NA 6<br />
DNA 16886<br />
I266 Frequency of domestic air flight use<br />
<strong>2003</strong> only, Modular<br />
1 3 or more times a<br />
week<br />
6 0.0%<br />
2 Once or twice a week 22 0.1%<br />
3 Less than once per<br />
week, more than twice a<br />
month<br />
46 0.2%<br />
4 Once or twice a month 92 0.5%<br />
5 Less than once a<br />
month, more than twice<br />
a year<br />
397 2.0%<br />
6 Once or twice a year 1222 6.3%<br />
7 Less than once a year<br />
or never<br />
17676 90.8%<br />
Total 19461 100%<br />
NA 6<br />
DNA 16886<br />
Cycling<br />
I265 Frequency of bicycle use<br />
<strong>2003</strong> only, Modular<br />
1 3 or more times a<br />
week<br />
1514 8.3%<br />
2 Once or twice a week 1109 6.1%<br />
3 Less than once per<br />
week, more than twice a<br />
month<br />
611 3.4%<br />
4 Once or twice a month 933 5.1%<br />
5 Less than once a<br />
month, more than twice<br />
a year<br />
691 3.8%<br />
6 Once or twice a year 804 4.4%<br />
7 Less than once a year<br />
or never<br />
12570 68.9%<br />
Total 18232 100%<br />
NA 10<br />
DNA 18111
I271 Own or use a bicycle<br />
1 Own a bicycle yourself 14060 41.2%<br />
2 Have use of household<br />
bicycle<br />
379 1.1%<br />
3 Have use of nonhousehold<br />
bicycle<br />
136 0.4%<br />
4 Have no use of a<br />
bicycle<br />
19560 57.3%<br />
Total 34135 100%<br />
NA 11<br />
DNA 2207<br />
‘Bicycle’ excludes exercise bikes, but<br />
includes all other bicycles, even if they<br />
are not in a roadworthy condition.<br />
I272 Ridden a bicycle in the last 12<br />
months<br />
1 Yes 12291 36.8%<br />
2 No 21139 63.2%<br />
Total 33430 100%<br />
Don’t know/can’t<br />
remember<br />
716<br />
DNA 2207<br />
I273 Where did you cycle<br />
1 Mainly on the road 5549 45.2%<br />
2 Pavement, cycle path<br />
or cycle lane<br />
3232 26.3%<br />
3 Parks, open country or<br />
private land<br />
1830 14.9%<br />
4 Variety of surfaces 1677 13.6%<br />
Total 12288 100%<br />
NA 3<br />
DNA 24062<br />
The questions that produce I271-I273<br />
are asked only of those over 4 years of<br />
age.<br />
Variable I273 asks where people<br />
cycled most often over the course of<br />
the preceding 12 months.<br />
School travel<br />
The majority of questions in this<br />
section are taken from the household<br />
survey.<br />
National Centre for Social Research<br />
100<br />
See also I339 for transport difficulties<br />
with trips to school.<br />
I278 Daily school trip<br />
1 Makes daily journey 3469 99.4%<br />
2 No daily journey 20 0.6%<br />
Total 3489 100%<br />
NA 1<br />
DNA 32863<br />
Those in the second category for I278<br />
include those educated at home,<br />
children at boarding school etc.<br />
I280 How far to school (time)<br />
Based on numeric variable I279<br />
1 Up to 5 minutes 719 35.9%<br />
2 6 to 10 minutes 545 27.2%<br />
3 11 to 15 minutes 341 17.0%<br />
4 16 to 20 minutes 190 9.5%<br />
5 21 to 25 minutes 69 3.4%<br />
6 26 to 30 minutes 89 4.4%<br />
7 31 to 45 minutes 40 2.0%<br />
8 46 to 60 minutes 6 0.3%<br />
9 Over 60 minutes 4 0.2%<br />
Total <strong>2003</strong> 73.1%<br />
Distance given 1465<br />
No daily journey 20<br />
NA 2<br />
DNA 22863<br />
I282 How far to school (distance)<br />
Based on numeric variable I281<br />
1 One mile and under 324 22.1%<br />
2 Over 1 mile to 2 miles 357 24.4%<br />
3 Over 2 to under 3<br />
miles<br />
252 17.2%<br />
4 Over 3 to under 4<br />
miles<br />
150 10.3%<br />
5 Over 4 to under 5<br />
miles<br />
113 7.7%<br />
6 Over 5 to under 10<br />
miles<br />
187 12.8%<br />
7 Over 10 to under 15 49 202%<br />
miles<br />
8 Over 15 miles 31 2.1%<br />
Total 1463 100%<br />
Time given <strong>2004</strong><br />
No daily journey 20<br />
NA 2<br />
DNA 32863
For I282 respondents had the option of<br />
giving the distance to school in miles,<br />
kilometres, yards or metres. Answers<br />
given in metres or yards were then<br />
used to calculate the distance in miles.<br />
I283 Method of school travel<br />
1 Underground, metro,<br />
light rail, tram<br />
10 0.3%<br />
2 Train 16 0.5%<br />
3 Public bus, minibus or<br />
coach<br />
265 7.6%<br />
4 School or LA bus,<br />
minibus or coach<br />
286 8.2%<br />
4 Motorcycle, scooter or<br />
moped<br />
2 0.1%<br />
5 Car or van 1093 31.5%<br />
6 Taxi/minicab 42 1.2%<br />
7 Bicycle 51 1.5%<br />
8 On foot 1704 49.1%<br />
Total 3469 100%<br />
No daily journey 20<br />
NA 1<br />
DNA 32863<br />
I283 is asked of the HRP, in the<br />
household questionnaire, about each<br />
child in the household. Where several<br />
modes are used, the usual mode used<br />
for the longest part of the trip is coded.<br />
I284 Accompanied to school by an adult<br />
1 Usually accompanied<br />
by an adult<br />
1991 57.4%<br />
2 Not usually<br />
accompanied by an adult<br />
1253 36.1%<br />
3 Sometimes<br />
accompanied and<br />
sometimes not<br />
171 4.9%<br />
4 Part of way<br />
accompanied, part of<br />
way not<br />
54 1.6%<br />
Total 3469 100%<br />
No daily journey 20<br />
NA 1<br />
DNA 32863<br />
I285 Reason accompanied to school<br />
Multicoded<br />
1 Traffic danger 1021 51.3%<br />
2 Child might get lost 193 9.7%<br />
3 Child might not arrive<br />
on time<br />
274 13.8%<br />
National Centre for Social Research<br />
101<br />
4 Fear of<br />
assault/molestation<br />
810 40.7%<br />
5 Fear of bullying 150 7.5%<br />
6 School too far away 517 26.0%<br />
7 Other 479 24.1%<br />
Total 1990 100%<br />
No daily journey 20<br />
Not accompanied 1478<br />
DNA 32864<br />
I286 Age first unaccompanied to school<br />
1 4 11 0.8%<br />
2 5 28 2.0%<br />
3 6 35 2.5%<br />
4 7 120 8.5%<br />
5 8 154 10.8%<br />
6 9 223 15.7%<br />
7 10 244 17.2%<br />
8 11 484 34.1%<br />
9 12 108 7.6%<br />
10 13 13 0.9%<br />
11 14 0 0.0%<br />
Total 1420 100%<br />
Age unknown 4<br />
Always accompanied 2045<br />
No daily journey 20<br />
NA 1<br />
DNA 32863<br />
I287 Reason accompanied to school<br />
before allowed alone<br />
Multicoded<br />
1 Traffic danger 819 57.6%<br />
2 Child might get lost 132 9.3%<br />
3 Child might not arrive<br />
on time<br />
180 12.7%<br />
4 Fear of<br />
574 40.4%<br />
assault/molestation<br />
5 Fear of bullying 165 11.6%<br />
6 School too far away 233 16.4%<br />
7 Other 284 20.0%<br />
Total 1422 100%<br />
No daily journey 20<br />
Not unaccompanied 2045<br />
DNA 32864<br />
I288 Allowed to cross roads<br />
1 Yes, almost always 1578 45.2%<br />
2 Yes,<br />
sometimes/depends<br />
1018 29.2%<br />
3 No, never 893 25.6%<br />
Total 3489 100%<br />
NA 1<br />
DNA 32863
I289 Allowed to cross main roads<br />
1 Main roads 2458 56.2%<br />
2 Minor roads 1137 43.8%<br />
Total 2595 100%<br />
NA 1<br />
DNA 33757<br />
Question I289 is asked only of those<br />
who advise that their child is allowed<br />
to cross roads alone.<br />
Walking<br />
I293 asks respondents how frequently<br />
they make walks of 20 minutes or<br />
more.<br />
The remainder of questions in this<br />
section ask respondents to elaborate<br />
on the last such trip that they made.<br />
I293 Frequency of walking<br />
1 3 or more times a<br />
week<br />
11573 33.4%<br />
2 Once or twice a week 7279 21.0%<br />
3 Less than once a week<br />
but more than twice a<br />
month<br />
1969 5.7%<br />
4 Once or twice a month 2879 8.3%<br />
5 Less than once a<br />
month but more than<br />
twice a year<br />
1370 4.0%<br />
6 Once or twice a year 953 2.8%<br />
7 Less than once a year<br />
or never<br />
8587 24.8%<br />
Total 34610 100%<br />
NA 36<br />
DNA 1707<br />
I294 Where respondent walked<br />
1 Mostly on pavements<br />
alongside a road<br />
17423 67.0%<br />
2 Mostly on country<br />
roads without pavements<br />
1533 5.9%<br />
3 Mostly in a town or city<br />
park, or other urban area<br />
1476 5.7%<br />
4 Mostly in the<br />
countryside<br />
3453 13.3%<br />
5 A mixture of these 1927 7.4%<br />
6 Other 186 0.7%<br />
National Centre for Social Research<br />
102<br />
Total 25998 100%<br />
NA 25<br />
DNA 10330<br />
I296 Duration of walk<br />
Based on numeric variable I295<br />
1 20-24 minutes 10946 42.3%<br />
2 25-29 minutes 3060 11.8%<br />
3 30-34 minutes 6345 24.5%<br />
4 35-39 minutes 462 1.8%<br />
5 40-44 minutes 897 3.5%<br />
6 45-49 minutes 1110 4.3%<br />
7 50-54 minutes 118 0.5%<br />
8 55-59 minutes 17 0.1%<br />
9 60-64 minutes 1665 6.4%<br />
10 65-59 minutes 13 0.1%<br />
11 70-74 minutes 21 0.1%<br />
12 75-79 minutes 86 0.3%<br />
13 80-84 minutes 28 0.1%<br />
14 85-89 minutes 3 0.0%<br />
15 90-119 minutes 436 1.7%<br />
16 120-179 minutes 416 1.6%<br />
17 180-239 minutes 142 0.5%<br />
18 240-299 minutes 56 0.2%<br />
19 300-359 minutes 26 0.1%<br />
20 360-419 minutes 14 0.1%<br />
21 420-479 minutes 1 0.0%<br />
22 480 minutes and over 38 0.1%<br />
Total 25900 100%<br />
NA 123<br />
DNA 10330<br />
I298 Distance walked<br />
Based on numeric variable I297<br />
1 1 mile 9 29.0%<br />
2 2 miles 6 19.4%<br />
3 3 miles 0 0.05<br />
4 4 miles 0 0.0%<br />
5 5 miles 3 9.75<br />
6 6 miles 3 9.7%<br />
7 7 miles 1 3.2%<br />
8 8 miles 2 6.5%<br />
9 9 miles 1 3.2%<br />
10 10 miles 2 6.5%<br />
11 11-15 miles 2 6.55<br />
12 16-20 miles 2 6.5%<br />
13 21-25 miles 0 0.0%<br />
14 26 miles and over 0 0.0%<br />
Total 31 100%<br />
NA 36321 100<br />
DNA 36321
I299 Method of travel to start of walk<br />
1 Didn’t travel 20365 78.3%<br />
2 Underground, metro,<br />
light rail, tram<br />
111 0.4%<br />
3 Train 274 1.1%<br />
4 Bus, minibus or coach 610 2.3%<br />
5 Motorcycle, scooter or<br />
moped<br />
9 0.0%<br />
6 Car or van 4489 17.3%<br />
7 Taxi/minicab 39 0.2%<br />
8 Bicycle 43 0.2%<br />
9 Other mode 56 0.2%<br />
Total 25996 100%<br />
NA 27<br />
DNA 10330<br />
Shopping<br />
Questions in this section were asked<br />
only of people who were recorded as<br />
doing the main household shopping<br />
(from the household questionnaire).<br />
Where the shopping is split evenly, the<br />
main shopper is considered to be the<br />
person who shopped most recently.<br />
I325-I327 were coded for all people<br />
recorded as using a private vehicle in<br />
I324. I325 records all problems<br />
experienced by the respondent in<br />
using a car (or other private vehicle),<br />
while I326 records only the most<br />
difficult problem. I328-I330 are<br />
recorded only for people who record in<br />
I327 that it would be ‘quite difficult’ or<br />
‘very difficult’ to do the shopping<br />
another way.<br />
I328-I332 are coded for all those<br />
recorded (in I324) as using public<br />
transport, while I333 and I334 are<br />
coded for all those in I332 who advise<br />
that there is a vehicle that they are<br />
insured to drive, which is usually<br />
unused whilst they are doing the<br />
shopping.<br />
I324 Usual mode when travelling for main<br />
food shopping<br />
1 Underground, metro,<br />
light rail, tram<br />
38 0.2%<br />
2 Train 9 0.1%<br />
3 Bus, minibus or coach 1197 7.9%<br />
National Centre for Social Research<br />
103<br />
4 Motorcycle, scooter or<br />
moped<br />
31 0.2%<br />
5 Car or van 11511 75.7%<br />
6 Taxi/minicab 438 2.9%<br />
7 Bicycle 90 0.6%<br />
8 On foot 1753 11.5%<br />
9 Other 143 0.9%<br />
Total 15210 100%<br />
NA 14<br />
DNA 21129<br />
I325 Difficulties with car travel for main<br />
food shopping<br />
Multicoded<br />
1 No difficulties 10127 87.9%<br />
2 Too far 30 0.3%<br />
3 Cost of petrol 42 0.4%<br />
4 Lack of parking 406 3.5%<br />
5 Cost of parking 64 0.6%<br />
6 Personal disability 121 1.0%<br />
7 Difficulty carrying<br />
shopping to car<br />
60 0.5%<br />
8 Concerns over<br />
personal safety<br />
29 0.3%<br />
9 Traffic<br />
congestion/roadworks<br />
814 7.1%<br />
10 Relies on household 60 0.5%<br />
member<br />
11 The weather 42 0.4%<br />
12 Other 44 0.4%<br />
Total 11525 100%<br />
NA 17<br />
DNA 24811<br />
I326 Most difficult problem with using car<br />
for main food shopping<br />
1 No difficulties 10127 87.9%<br />
2 Too far 20 0.2%<br />
3 Cost of petrol 23 0.2%<br />
4 Lack of parking 346 3.0%<br />
5 Cost of parking 24 0.2%<br />
6 Personal disability 94 0.8%<br />
7 Difficulty carrying<br />
shopping<br />
36 0.3%<br />
8 Concerns over<br />
personal safety<br />
20 0.2%<br />
9 Traffic<br />
congestion/roadworks<br />
724 6.3%<br />
10 Relies on household 53 0.5%<br />
member<br />
11 The weather 24 0.2%<br />
12 Other 34 0.3%<br />
Total 11525 100%<br />
NA 17<br />
DNA 24811
I327 Main food shopping another way<br />
1 Very easy 1045 9.1%<br />
2 Quite easy 2987 25.9%<br />
3 Neither easy nor<br />
difficult<br />
979 8.5%<br />
4 Quite difficult 2933 25.5%<br />
5 Very difficult 3570 31.0%<br />
Total 11514 100%<br />
NA 28<br />
DNA 24811<br />
I328 Why difficult to do main shopping<br />
another way<br />
Multicoded<br />
1 Too far/long journey 1272 19.6%<br />
2 Journey not possible<br />
by public transport<br />
1256 19.3%<br />
3 Distance to public<br />
transport<br />
200 3.1%<br />
4 Unreliable public<br />
transport<br />
747 11.5%<br />
5 Cost of using public<br />
transport/taxis<br />
462 7.1%<br />
6 Poor information about<br />
public transport<br />
113 1.7%<br />
7 Poor connections 603 9.3%<br />
8 Public transport<br />
unpleasant<br />
118 1.8%<br />
9 Personal disability 685 10.5%<br />
10 Concerns over<br />
personal safety<br />
43 0.7%<br />
11 Traffic<br />
congestion/roadworks<br />
84 1.3%<br />
12 Difficulties carrying<br />
the shopping<br />
5191 79.8%<br />
13 Difficulties managing 500 7.7%<br />
with children<br />
14 The weather 104 1.6%<br />
15 Other 100 1.5%<br />
Total 6502 100%<br />
NA 1<br />
DNA 29850<br />
I328 is asked of those who do not do<br />
the main food shopping in a car or on<br />
a motorbike.<br />
National Centre for Social Research<br />
104<br />
I329 Main difficulty to do main shopping<br />
another way<br />
1 Too far/long journey 462 7.1%<br />
2 Journey not possible<br />
by public transport<br />
725 11.2%<br />
3 Distance to public<br />
transport<br />
59 0.9%<br />
4 Unreliable public<br />
transport<br />
251 3.9%<br />
5 Cost of using public<br />
transport/taxis<br />
107 1.6%<br />
6 Poor information about<br />
public transport<br />
18 0.3%<br />
7 Poor connections 192 3.0%<br />
8 Public transport<br />
unpleasant<br />
22 0.3%<br />
9 Personal disability 492 7.6%<br />
10 Concerns over<br />
personal safety<br />
2 0.0%<br />
11 Traffic<br />
congestion/roadworks<br />
13 0.2%<br />
12 Difficulties carrying<br />
the shopping<br />
1868 28.8%<br />
13 Difficulties managing<br />
with children<br />
2141 33.0%<br />
14 The weather 86 1.3%<br />
15 Other 58 0.9%<br />
Total 6496 100%<br />
NA 5<br />
DNA 29850<br />
I330 Difficulties with public transport for<br />
main food shopping<br />
Multicoded<br />
1 No difficulties 2606 71.0%<br />
2 Too far/long journey 36 1.0%<br />
3 Not possible by public<br />
transport<br />
31 0.8%<br />
4 Unreliable public<br />
transport<br />
157 4.3%<br />
5 Cost of using public<br />
transport<br />
70 1.9%<br />
6 Poor information about<br />
services<br />
9 0.2%<br />
7 Poor connections 26 0.7%<br />
8 Public transport<br />
unpleasant<br />
54 1.5%<br />
9 Personal disability 212 5.8%<br />
10 Concerns over<br />
personal safety<br />
68 1.8%<br />
11 Traffic<br />
78 2.1%<br />
congestion/roadworks<br />
12 Difficulties carrying<br />
the shopping<br />
618 16.8%
I330 Difficulties with public transport for<br />
main food shopping<br />
13 Difficulties managing<br />
with children<br />
71 1.9%<br />
14 The weather 79 2.2%<br />
15 Other 56 1.5%<br />
Total 3668 100%<br />
NA 0<br />
DNA 32685<br />
I331 Main difficulty with public transport for<br />
main food shopping<br />
1 No difficulties 2606 71.0%<br />
2 Too far/long journey 20 0.5%<br />
3 Not possible by public<br />
transport<br />
10 0.3%<br />
4 Unreliable public<br />
transport<br />
108 2.9%<br />
5 Cost of using public<br />
transport<br />
39 1.1%<br />
6 Poor information about<br />
services<br />
1 0.0%<br />
7 Poor connections 9 0.2%<br />
8 Public transport<br />
unpleasant<br />
30 0.8%<br />
9 Personal disability 158 4.3%<br />
10 Concerns over<br />
personal safety<br />
43 1.2%<br />
11 Traffic<br />
congestion/roadworks<br />
43 1.2%<br />
12 Difficulties carrying<br />
the shopping<br />
489 13.3%<br />
13 Difficulties managing<br />
with children<br />
29 0.8%<br />
14 The weather 32 0.9%<br />
15 Other 51 1.4%<br />
Total 3668 100%<br />
NA 0<br />
DNA 32865<br />
I332 Car unused while doing main food<br />
shopping<br />
1 All cars usually in use 90 18.6%<br />
2 Car unused, but<br />
respondent not insured<br />
to drive it<br />
33 6.8%<br />
3 Car unused and<br />
respondent is insured to<br />
drive it<br />
360 74.5%<br />
Total 483 100%<br />
NA 4<br />
DNA 35866<br />
National Centre for Social Research<br />
105<br />
I333 Why car not used for main food<br />
shopping<br />
Multicoded<br />
1 Quicker by public<br />
transport<br />
219 60.8%<br />
2 Cheaper by public<br />
transport<br />
63 17.5%<br />
3 Enjoys using public<br />
transport<br />
92 25.6%<br />
4 Healthier to use public<br />
transport<br />
69 19.2%<br />
5 Can work/rest/read on<br />
public transport<br />
1 0.3%<br />
6 Combines with another<br />
journey<br />
5 1.4%<br />
7 Too far/long journey 0 0.0%<br />
8 Don’t have current<br />
driving licence<br />
0 0.0%<br />
9 Don’t like driving 11 3.1%<br />
10 Cost of petrol 12 3.3%<br />
11 Lack of parking<br />
facilities<br />
43 11.9%<br />
12 Cost of parking 10 2.8%<br />
13 Personal disability 5 1.4%<br />
14 Concerns over<br />
personal safety<br />
0 0.0%<br />
15 Traffic<br />
congestion/roadworks<br />
12 3.3%<br />
16 Environmental 21 5.8%<br />
concerns<br />
17 Other 38 10.6%<br />
Total 360 100%<br />
NA 0<br />
DNA 35993<br />
I334 Main reason why car not used for<br />
main food shopping<br />
1 Quicker by public<br />
transport<br />
180 50.0%<br />
2 Cheaper by public<br />
transport<br />
13 3.6%<br />
3 Enjoys using public<br />
transport<br />
49 13.6%<br />
4 Healthier to use public<br />
transport<br />
28 7.8%<br />
5 Can work/rest/read on<br />
public transport<br />
0 0.0%<br />
6 Combines with another<br />
journey<br />
4 1.1%<br />
7 Too far/long journey 0 0.0%<br />
8 Don’t have current<br />
driving licence<br />
0 0.0%<br />
9 Don’t like driving 8 2.2%<br />
10 Cost of petrol 5 1.4%<br />
11 Lack of parking<br />
facilities<br />
25 6.9%
I334 Main reason why car not used for<br />
main food shopping<br />
12 Cost of parking 2 0.6%<br />
13 Personal disability 4 1.1%<br />
14 Concerns over<br />
personal safety<br />
0 0.0%<br />
15 Traffic<br />
congestion/roadworks<br />
1 0.3%<br />
16 Environmental 10 2.8%<br />
concerns<br />
17 Other 31 8.6%<br />
Total 360 100%<br />
NA 0<br />
DNA 35993<br />
Difficulties accessing other<br />
services<br />
Respondents were asked specifically<br />
whether they have any problems with<br />
travel to work and for the main food<br />
shopping. I335-I341 cover problems<br />
with travel to other facilities. The<br />
questions are asked only of those who<br />
record (in I335) that they experience<br />
problems with any of these trips.<br />
I335 Any other travel difficulties<br />
Multicoded<br />
1 Travelling to the<br />
doctors/hospital<br />
2094 7.3%<br />
2 Visiting<br />
friends/relatives at their<br />
home<br />
2037 7.1%<br />
3 Travelling to other<br />
social activities<br />
1335 4.6%<br />
4 Taking the children to<br />
school/social activities<br />
384 1.3%<br />
5 Travelling to<br />
school/college/university<br />
340 1.2%<br />
6 Travelling for any other<br />
reason<br />
393 1.4%<br />
7 No difficulties with any<br />
of these<br />
24562 85.4%<br />
Total 28749 100%<br />
NA 13<br />
DNA 7591<br />
I336 Difficulties with travel to<br />
doctor/hospital<br />
Multicoded<br />
1 Too far/long journey 459 22.0%<br />
2 Journey not possible<br />
by public transport<br />
300 14.4%<br />
3 Unreliable public 346 16.6%<br />
National Centre for Social Research<br />
106<br />
transport<br />
4 Cost of using public<br />
transport/taxis<br />
213 10.2%<br />
5 Poor information about<br />
public transport<br />
41 2.0%<br />
6 Poor connections 341 16.4%<br />
7 Public transport<br />
unpleasant<br />
51 2.4%<br />
8 Don’t have current<br />
driving licence<br />
92 4.4%<br />
9 Cost of petrol 11 0.5%<br />
10 Lack of parking<br />
facilities<br />
342 16.4%<br />
11 Cost of parking 103 4.9%<br />
12 Personal disability 563 27.0%<br />
13 Concerns over<br />
personal safety<br />
42 2.0%<br />
14 Traffic<br />
congestion/roadworks<br />
204 9.8%<br />
15 Environmental<br />
concerns<br />
72 3.5%<br />
Total 2085 100%<br />
NA 0<br />
DNA 34268<br />
I337 Difficulties with travel to<br />
friends/relatives<br />
Multicoded<br />
1 Too far/long journey 543 26.7%<br />
2 Journey not possible<br />
by public transport<br />
302 14.9%<br />
3 Unreliable public<br />
transport<br />
421 20.7%<br />
4 Cost of using public<br />
transport/taxis<br />
210 10.3%<br />
5 Poor information about<br />
public transport<br />
50 2.5%<br />
6 Poor connections 366 18.0%<br />
7 Public transport<br />
unpleasant<br />
61 3.0%<br />
8 Don’t have current<br />
driving licence<br />
88 4.3%<br />
9 Cost of petrol 13 0.6%<br />
10 Lack of parking<br />
facilities<br />
76 3.7%<br />
11 Cost of parking 15 0.7%<br />
12 Personal disability 464 22.8%<br />
13 Concerns over<br />
personal safety<br />
45 2.2%<br />
14 Traffic<br />
congestion/roadworks<br />
397 19.5%<br />
15 Environmental<br />
concerns<br />
58 2.9%<br />
Total 2032 100%<br />
NA 0<br />
DNA 34321
I338 Difficulties with travel to social<br />
activities<br />
Multicoded<br />
1 Too far/long journey 154 11.9%<br />
2 Journey not possible<br />
by public transport<br />
250 19.3%<br />
3 Unreliable public<br />
transport<br />
317 24.5%<br />
4 Cost of using public<br />
transport/taxis<br />
152 11.7%<br />
5 Poor information about<br />
public transport<br />
21 1.6%<br />
6 Poor connections 144 11.1%<br />
7 Public transport<br />
unpleasant<br />
35 2.7%<br />
8 Don’t have current<br />
driving licence<br />
80 6.2%<br />
9 Cost of petrol 7 0.5%<br />
10 Lack of parking<br />
facilities<br />
52 4.0%<br />
11 Cost of parking 15 1.2%<br />
12 Personal disability 368 28.4%<br />
13 Concerns over<br />
personal safety<br />
58 4.5%<br />
14 Traffic<br />
congestion/roadworks<br />
159 12.3%<br />
15 Environmental 55 4.2%<br />
concerns<br />
Total 1295 100%<br />
NA 3<br />
DNA 35055<br />
I339 Difficulties with travel with children to<br />
school<br />
Multicoded<br />
1 Too far/long journey 42 11.1%<br />
2 Journey not possible<br />
by public transport<br />
54 14.3%<br />
3 Unreliable public<br />
transport<br />
53 14.0%<br />
4 Cost of using public<br />
transport/taxis<br />
30 7.9%<br />
5 Poor information about<br />
public transport<br />
5 1.3%<br />
6 Poor connections 29 7.7%<br />
7 Public transport<br />
unpleasant<br />
3 0.8%<br />
8 Don’t have current<br />
driving licence<br />
9 2.4%<br />
9 Cost of petrol 4 1.1%<br />
10 Lack of parking<br />
facilities<br />
58 15.3%<br />
11 Cost of parking 1 0.3%<br />
12 Personal disability 38 10.1%<br />
13 Concerns over<br />
personal safety<br />
17 4.5%<br />
National Centre for Social Research<br />
107<br />
14 Traffic<br />
congestion/roadworks<br />
132 34.9%<br />
15 Environmental<br />
concerns<br />
16 4.2%<br />
Total 378 100%<br />
NA 0<br />
DNA 35975<br />
I340 Difficulties with travel to<br />
college/university<br />
Multicoded<br />
1 Too far/long journey 50 14.9%<br />
2 Journey not possible<br />
by public transport<br />
45 13.4%<br />
3 Unreliable public<br />
transport<br />
118 35.2%<br />
4 Cost of using public<br />
transport/taxis<br />
27 8.1%<br />
5 Poor information about<br />
public transport<br />
8 2.4%<br />
6 Poor connections 55 16.4%<br />
7 Public transport<br />
unpleasant<br />
18 5.4%<br />
8 Don’t have current<br />
driving licence<br />
14 4.2%<br />
9 Cost of petrol 4 1.2%<br />
10 Lack of parking<br />
facilities<br />
19 5.7%<br />
11 Cost of parking 8 2.4%<br />
12 Personal disability 21 6.3%<br />
13 Concerns over<br />
personal safety<br />
18 5.4%<br />
14 Traffic<br />
congestion/roadworks<br />
79 23.6%<br />
15 Environmental 11 3.3%<br />
concerns<br />
Total 335 100%<br />
NA 0<br />
DNA 36018<br />
I341 Difficulties with other travel<br />
Multicoded<br />
1 Too far/long journey 55 11.6%<br />
2 Journey not possible<br />
by public transport<br />
52 11.0%<br />
3 Unreliable public<br />
transport<br />
86 18.1%<br />
4 Cost of using public<br />
transport/taxis<br />
32 6.8%<br />
5 Poor information about<br />
public transport<br />
14 3.0%<br />
6 Poor connections 48 10.1%<br />
7 Public transport<br />
unpleasant<br />
21 4.4%<br />
8 Don’t have current<br />
driving licence<br />
16 3.4%
I341 Difficulties with other travel<br />
9 Cost of petrol 4 0.8%<br />
10 Lack of parking<br />
facilities<br />
19 4.0%<br />
11 Cost of parking 18 3.8%<br />
12 Personal disability 92 19.4%<br />
13 Concerns over<br />
personal safety<br />
21 4.4%<br />
14 Traffic<br />
congestion/roadworks<br />
146 30.8%<br />
15 Environmental<br />
concerns<br />
41 8.6%<br />
Total 474 100%<br />
NA 1<br />
DNA 35878<br />
Playing in the street<br />
From 2002, the Young Person’s Travel<br />
record contains an additional section<br />
on Day 7, which records all periods<br />
that children spent playing in the<br />
street.<br />
The database holds fifteen variables<br />
on playing in the street in total. These<br />
hold information for start time, end<br />
time and total elapsed time, for each of<br />
a maximum of five periods spent<br />
playing in the street. The counts and<br />
percentages given in this section apply<br />
to the first of these periods only.<br />
I366/I372/I378/I384/I390 Playtime start<br />
time<br />
Based on numeric variables<br />
I365/I371/I377/I383/I389<br />
1 0000-0059 0 0.0%<br />
2 0100-0159 0 0.0%<br />
3 0200-0259 0 0.0%<br />
4 0300-0359 0 0.0%<br />
5 0400-0459 0 0.0%<br />
6 0500-0559 1 0.1%<br />
7 0600-0659 0 0.0%<br />
8 0700-0759 7 0.7%<br />
9 0800-0859 21 2.2%<br />
10 0900-0959 39 4.1%<br />
11 1000-1059 96 10.0%<br />
12 1100-1159 69 7.2%<br />
13 1200-1259 51 5.3%<br />
14 1300-1359 42 4.4%<br />
15 1400-1459 59 6.1%<br />
16 1500-1559 172 17.9%<br />
17 1600-1659 227 23.6%<br />
18 1700-1759 87 9.1%<br />
National Centre for Social Research<br />
108<br />
I366/I372/I378/I384/I390 Playtime start<br />
time<br />
19 1800-1859 57 5.9%<br />
20 1900-1959 26 2.7%<br />
21 2000-2059 3 0.3%<br />
22 2100-2159 4 0.4%<br />
23 2200-2259 0 0.0%<br />
24 2300-2359 0 0.0%<br />
Total 961 100%<br />
No playtime data 4423<br />
Under 5 years old 2207<br />
Adult 28762<br />
I368/I374/I380/I386/I392 Playtime end<br />
time<br />
Based on numeric variables<br />
I367/I373/I379/I385/I391<br />
1 0000-0059 0 0.0<br />
2 0100-0159 0 0.0<br />
3 0200-0259 0 0.0<br />
4 0300-0359 0 0.0<br />
5 0400-0459 0 0.0<br />
6 0500-0559 0 0.0<br />
7 0600-0659 0 0.0<br />
8 0700-0759 1 0.1<br />
9 0800-0859 23 2.4<br />
10 0900-0959 7 0.7<br />
11 1000-1059 26 2.7<br />
12 1100-1159 43 4.5<br />
13 1200-1259 75 7.8<br />
14 1300-1359 54 5.6<br />
15 1400-1459 35 3.6<br />
16 1500-1559 68 7.1<br />
17 1600-1659 129 13.4<br />
18 1700-1759 207 21.5<br />
19 1800-1859 120 12.5<br />
20 1900-1959 83 8.6<br />
21 2000-2059 52 5.4<br />
22 2100-2159 31 3.2<br />
23 2200-2259 7 0.7<br />
24 2300-2359 0 0.0<br />
Total 961 100<br />
No playtime data 4423<br />
Under 5 years old 2207<br />
Adult 28762<br />
I370/I376/I382/I388/I394 Playtime elapsed<br />
time<br />
Based on numeric variables<br />
I369/I375/I381/I387/I393<br />
1 Less than 15 minutes 55 5.7%<br />
2 15 minutes to under 30<br />
minutes<br />
70 7.3%<br />
3 30 minutes to under 45<br />
minutes<br />
96 10.0%
4 45 minutes to under 60<br />
minutes<br />
65 6.8%<br />
5 60 minutes to under 90<br />
minutes<br />
197 20.5%<br />
6 90 minutes to under 2<br />
hours<br />
98 10.2%<br />
7 2 hours to under 3<br />
hours<br />
217 22.6%<br />
8 3 hours to under 4<br />
hours<br />
94 9.8%<br />
9 4 hours and over 69 7.2%<br />
Total 961 100%<br />
No playtime data 4423<br />
Under 5 years old 2207<br />
Adult 28762<br />
5.7 Long distance trip variables<br />
Long-distance trips are trips of 50<br />
miles or more. Due to the low number<br />
of such trips that people make,<br />
respondents are also asked (in the<br />
individual questionnaire) to tell us<br />
about any such trips made in the three<br />
week period prior to the Travel Week.<br />
This record is combined with all longdistance<br />
trips in the Travel Week to<br />
construct the variables in this section.<br />
Further notes relevant to these<br />
variables can be found accompanying<br />
the corresponding trip-level variables,<br />
later in this chapter.<br />
L3 Calendar month<br />
1 January 2826 6.7%<br />
2 February 2820 6.7%<br />
3 March 3363 8.0%<br />
4 April 3623 8.6%<br />
5 May 3700 8.8%<br />
6 June 3545 8.4%<br />
7 July 3883 9.2%<br />
8 August 4675 11.1%<br />
9 September 3808 9.0%<br />
10 October 3734 8.8%<br />
11 November 2951 7.0%<br />
12 December 3290 7.8%<br />
Total 42218 100%<br />
Missing values for L3 are patched by<br />
inspection, looking at the respondent’s<br />
whole trip record.<br />
National Centre for Social Research<br />
109<br />
L5 Origin (county)<br />
1 Avon 796 1.9%<br />
2 Bedfordshire 395 0.9%<br />
3 Berkshire 720 1.7%<br />
4 Buckinghamshire 581 1.4%<br />
5 Cambridgeshire 931 2.2%<br />
6 Cheshire 700 1.7%<br />
7 Cleveland 155 0.4%<br />
8 Cornwall 412 1.0%<br />
9 Cumbria 863 2.0%<br />
10 Derbyshire 625 1.5%<br />
11 Devon 1201 2.8%<br />
12 Dorset 635 1.5%<br />
13 Durham 221 0.5%<br />
14 East Sussex 611 1.4%<br />
15 Essex 1170 2.8%<br />
16 Gloucestershire 721 1.7%<br />
17 Greater Manchester 1213 2.9%<br />
18 Hampshire 1396 3.3%<br />
19 Hereford and<br />
561 1.3%<br />
Worcester<br />
20 Hertfordshire 453 1.1%<br />
21 Humberside 518 1.2%<br />
22 Isle of Wight 59 0.1%<br />
23 Kent 1429 3.4%<br />
24 Lancashire 874 2.1%<br />
25 Leicestershire 779 1.8%<br />
26 Lincolnshire 731 1.7%<br />
27 London Central 1137 2.7%<br />
28 Other Inner London 1028 2.4%<br />
31 Other London not 2106 5.0%<br />
Central<br />
32 Merseyside 613 1.5%<br />
33 Norfolk 810 1.9%<br />
34 Northamptonshire 466 1.1%<br />
35 Northumberland 330 0.8%<br />
36 North Yorkshire 875 2.1%<br />
37 Nottinghamshire 814 1.9%<br />
38 Oxfordshire 955 2.3%<br />
39 Shropshire 286 0.7%<br />
40 Somerset 733 1.7%<br />
41 South Yorkshire 650 1.5%<br />
42 Staffordshire 587 1.4%<br />
43 Suffolk 678 1.6%<br />
44 Surrey 744 1.8%<br />
45 Tyne and Wear 505 1.2%<br />
46 Warwickshire 493 1.2%<br />
47 West Midlands 1634 3.9%<br />
48 West Sussex 522 1.2%<br />
49 West Yorkshire 1179 2.8%<br />
50 Wiltshire 680 1.6%<br />
51 Clwyd 343 0.8%<br />
52 Dyfed 367 0.9%
L5 Origin (county)<br />
53 Gwent 258 0.6%<br />
54 Gwynedd 456 1.1%<br />
55 Mid Glamorgan 191 0.5%<br />
56 Powys 90 0.2%<br />
57 South Glamorgan 354 0.8%<br />
58 West Glamorgan 158 0.4%<br />
59 Borders 127 0.3%<br />
60 Central 188 0.4%<br />
61 Dumfries and 132 0.3%<br />
Galloway<br />
62 Fife 228 0.5%<br />
63 Grampian 300 0.7%<br />
64 Highlands 320 0.8%<br />
65 Lothian 605 1.4%<br />
66 Strathclyde 1031 2.4%<br />
67 Tayside 286 0.7%<br />
68 Essex within M25 0 0.0%<br />
69 Hertfordshire within 106 0.3%<br />
M25<br />
70 Kent within M25 5 0.0%<br />
71 Surrey within M25 98 0.2%<br />
Total 42218 100%<br />
Missing values are imputed using P15<br />
for all trips that begin at ‘home’. For all<br />
other cases, missing values are<br />
patched by inspecting all other details<br />
of the long distance trip.<br />
L14 Origin (UA)<br />
1 Bath and North East<br />
Somerset<br />
181 0.4%<br />
2 Bedfordshire 209 0.5%<br />
3 Blackburn with Darwen 109 0.3%<br />
4 Blackpool 270 0.6%<br />
5 Bournemouth 126 0.3%<br />
6 Bracknell Forest 49 0.1%<br />
7 Brighton and Hove 217 0.5%<br />
8 Bristol, City of 464 1.1%<br />
9 Buckinghamshire 414 1.0%<br />
10 Cambridgeshire 642 1.5%<br />
11 Cheshire 558 1.3%<br />
12 Cornwall and Isles of<br />
Scilly<br />
410 1.0%<br />
13 Cumbria 862 2.0%<br />
14 Darlington 55 0.1%<br />
15 Derby 183 0.4%<br />
16 Derbyshire 442 1.0%<br />
17 Devon 1024 2.4%<br />
18 Dorset 428 1.0%<br />
19 Durham 164 0.4%<br />
20 East Riding of<br />
Yorkshire<br />
181 0.4%<br />
National Centre for Social Research<br />
110<br />
L14 Origin (UA)<br />
21 East Sussex 388 0.9%<br />
22 Essex (area outside<br />
M25)<br />
998 2.4%<br />
23 Essex (area within<br />
M25)<br />
0 0.0%<br />
24 Gloucestershire 719 1.7%<br />
25 Greater Manchester 1213 2.9%<br />
26 Halton 45 0.1%<br />
27 Hampshire 827 2.0%<br />
28 Hartlepool 22 0.1%<br />
29 Herefordshire 264 0.6%<br />
30 Hertfordshire (area<br />
outside M25)<br />
453 1.1%<br />
31 Hertfordshire (area<br />
within M25)<br />
106 0.3%<br />
32 Inner London 1027 2.4%<br />
33 Isle of Wight 59 0.1%<br />
34 Kent (area outside<br />
M25)<br />
1384 3.3%<br />
35 Kent (area within<br />
M25)<br />
5 0.0%<br />
36 Kingston upon Hull,<br />
City of<br />
148 0.4%<br />
37 Lancashire 493 1.2%<br />
38 Leicester 279 0.7%<br />
39 Leicestershire 477 1.1%<br />
40 Lincolnshire 727 1.7%<br />
41 London Central 1136 2.7%<br />
42 London Outer 2098 5.0%<br />
43 Luton 186 0.4%<br />
44 Medway Towns 43 0.1%<br />
45 Merseyside 610 1.4%<br />
46 Middlesbrough 54 0.1%<br />
47 Milton Keynes 167 0.4%<br />
48 Newbury 69 0.2%<br />
49 Norfolk 810 1.9%<br />
50 North East<br />
Lincolnshire<br />
92 0.2%<br />
51 North Lincolnshire 97 0.2%<br />
52 North Somerset 131 0.3%<br />
53 North Yorkshire 618 1.5%<br />
54 Northamptonshire 466 1.1%<br />
55 Northumberland 331 0.8%<br />
56 Nottingham 487 1.2%<br />
57 Nottinghamshire 327 0.8%<br />
58 Oxfordshire 954 2.3%<br />
59 Peterborough 286 0.7%<br />
60 Plymouth 19 0.0%<br />
61 Poole 81 0.2%<br />
62 Portsmouth 318 0.8%<br />
63 Reading 175 0.4%<br />
64 Redcar & Cleveland 45 0.1%<br />
65 Rutland 21 0.0%<br />
66 Shropshire 171 0.4%<br />
67 Slough 91 0.2%
L14 Origin (UA)<br />
68 Somerset 733 1.7%<br />
69 South<br />
Gloucestershire<br />
19 0.0%<br />
70 South Yorkshire 649 1.5%<br />
71 Southampton 247 0.6%<br />
72 Southend on Sea 104 0.2%<br />
73 Staffordshire 346 0.8%<br />
74 Stockton-on-Tees 34 0.1%<br />
75 Stoke-on-Trent 239 0.6%<br />
76 Suffolk 678 1.6%<br />
77 Surrey (area outside<br />
M25)<br />
743 1.8%<br />
78 Surrey (area within<br />
M25)<br />
98 0.2%<br />
79 Swindon 300 0.7%<br />
80 The Wrekin 116 0.3%<br />
81 Thurrock 67 0.2%<br />
82 Torbay 158 0.4%<br />
83 Tyne and Wear 505 1.2%<br />
84 Warrington 94 0.2%<br />
85 Warwickshire 493 1.2%<br />
86 West Midlands 1632 3.9%<br />
87 West Sussex 521 1.2%<br />
88 West Yorkshire 1176 2.8%<br />
89 Wiltshire 380 0.9%<br />
90 Windsor &<br />
Maidenhead<br />
195 0.5%<br />
91 Wokingham 140 0.3%<br />
92 Worcestershire 296 0.7%<br />
93 York 249 0.6%<br />
94 Aberdeen City 186 0.4%<br />
95 Aberdeenshire 63 0.1%<br />
96 Angus 56 0.1%<br />
97 Argyll and Bute 124 0.3%<br />
98 Clackmannshire 4 0.0%<br />
99 Dumfries & Galloway 132 0.3%<br />
100 Dundee, City of 78 0.2%<br />
101 East Ayrshire 96 0.2%<br />
102 East Dunbartonshire 0 0.0%<br />
103 East Lothian 44 0.1%<br />
104 East Renfrewshire 20 0.0%<br />
105 Edinburgh, City of 457 1.1%<br />
106 Falkirk 76 0.2%<br />
107 Fife 227 0.5%<br />
108 Glasgow, City of 421 1.0%<br />
109 Highland 313 0.7%<br />
110 Inverclyde 17 0.0%<br />
111 Midlothian 25 0.1%<br />
112 Moray 51 0.1%<br />
113 North Ayrshire 60 0.1%<br />
114 North Lanarkshire 56 0.1%<br />
115 Orkney Islands 5 0.0%<br />
116 Perth and Kinross 152 0.4%<br />
117 Renfrewshire 21 0.0%<br />
National Centre for Social Research<br />
111<br />
L14 Origin (UA)<br />
118 Scottish Borders 126 0.3%<br />
119 Shetland Islands 0 0.0%<br />
120 South Ayrshire 54 0.1%<br />
121 South Lanarkshire 95 0.2%<br />
122 Stirling 108 0.3%<br />
123 West<br />
65 0.2%<br />
Dunbartonshire<br />
124 West Lothian 76 0.2%<br />
125 Western Isles 2 0.0%<br />
126 Blaenau Gwent 13 0.0%<br />
127 Bridgend 27 0.1%<br />
128 Caerphilly 75 0.2%<br />
129 Cardiff 332 0.8%<br />
130 Carmarthenshire 121 0.3%<br />
131 Ceredigion 124 0.3%<br />
132 Conwy 82 0.2%<br />
133 Denbighshire 165 0.4%<br />
134 Flintshire 68 0.2%<br />
135 Gwynedd 282 0.7%<br />
136 Isle of Anglesey 115 0.3%<br />
137 Merthyr Tydfil 70 0.2%<br />
138 Monmouthshire 130 0.3%<br />
139 Neath and Port 58 0.1%<br />
Talbot<br />
140 Newport 65 0.2%<br />
141 Pembrokeshire 122 0.3%<br />
142 Powys 90 0.2%<br />
143 Rhondda, Cynon, 52 0.1%<br />
Taff<br />
144 Swansea 100 0.2%<br />
145 Torfaen 18 0.0%<br />
146 Vale of Glamorgan 20 0.0%<br />
147 Wrexham 87 0.2%<br />
Total 42143 100%<br />
L6 Destination (county)<br />
1 Avon 807 1.9%<br />
2 Bedfordshire 394 0.9%<br />
3 Berkshire 727 1.7%<br />
4 Buckinghamshire 592 1.4%<br />
5 Cambridgeshire 915 2.2%<br />
6 Cheshire 674 1.6%<br />
7 Cleveland 150 0.4%<br />
8 Cornwall 433 1.0%<br />
9 Cumbria 910 2.2%<br />
10 Derbyshire 628 1.5%<br />
11 Devon 1128 2.7%<br />
12 Dorset 630 1.5%<br />
13 Durham 219 0.5%<br />
14 East Sussex 630 1.5%<br />
15 Essex 1177 2.8%<br />
16 Gloucestershire 675 1.6%<br />
17 Greater Manchester 1140 2.7%
L6 Destination (county)<br />
18 Hampshire 1461 3.5%<br />
19 Hereford and<br />
Worcester<br />
529 1.3%<br />
20 Hertfordshire 457 1.1%<br />
21 Humberside 520 1.2%<br />
22 Isle of Wight 72 0.2%<br />
23 Kent 1420 3.4%<br />
24 Lancashire 906 2.1%<br />
25 Leicestershire 773 1.8%<br />
26 Lincolnshire 784 1.9%<br />
27 London Central 1164 2.8%<br />
28 Other Inner London 1016 2.4%<br />
31 Other London not<br />
Central<br />
1980 4.7%<br />
32 Merseyside 530 1.3%<br />
33 Norfolk 817 1.9%<br />
34 Northamptonshire 484 1.1%<br />
35 Northumberland 333 0.8%<br />
36 North Yorkshire 867 2.1%<br />
37 Nottinghamshire 779 1.8%<br />
38 Oxfordshire 975 2.3%<br />
39 Shropshire 305 0.7%<br />
40 Somerset 742 1.8%<br />
41 South Yorkshire 668 1.6%<br />
42 Staffordshire 620 1.5%<br />
43 Suffolk 714 1.7%<br />
44 Surrey 760 1.8%<br />
45 Tyne and Wear 496 1.2%<br />
46 Warwickshire 497 1.2%<br />
47 West Midlands 1698 4.0%<br />
48 West Sussex 507 1.2%<br />
49 West Yorkshire 1156 2.7%<br />
50 Wiltshire 692 1.6%<br />
51 Clwyd 335 0.8%<br />
52 Dyfed 368 0.9%<br />
53 Gwent 256 0.6%<br />
54 Gwynedd 488 1.2%<br />
55 Mid Glamorgan 155 0.4%<br />
56 Powys 101 0.2%<br />
57 South Glamorgan 361 0.9%<br />
58 West Glamorgan 160 0.4%<br />
59 Borders 136 0.3%<br />
60 Central 191 0.5%<br />
61 Dumfries and<br />
Galloway<br />
143 0.3%<br />
62 Fife 227 0.5%<br />
63 Grampian 301 0.7%<br />
64 Highlands 325 0.8%<br />
65 Lothian 589 1.4%<br />
66 Strathclyde 1015 2.4%<br />
67 Tayside 320 0.8%<br />
68 Essex within M25 1 0.0%<br />
69 Hertfordshire within<br />
M25<br />
92 0.2%<br />
National Centre for Social Research<br />
112<br />
L6 Destination (county)<br />
70 Kent within M25 5 0.0%<br />
71 Surrey within M25 98 0.2%<br />
Total 42218 100%<br />
Missing values are imputed using P15<br />
for all trips that end at ‘home’. For all<br />
other cases, missing values are<br />
patched by inspecting all other details<br />
of the long distance trip.<br />
L15 Destination (UA)<br />
1 Bath and North East<br />
Somerset<br />
164 0.4%<br />
2 Bedfordshire 211 0.5%<br />
3 Blackburn with Darwen 99 0.2%<br />
4 Blackpool 314 0.7%<br />
5 Bournemouth 139 0.3%<br />
6 Bracknell Forest 49 0.1%<br />
7 Brighton and Hove 241 0.6%<br />
8 Bristol, City of 479 1.1%<br />
9 Buckinghamshire 410 1.0%<br />
10 Cambridgeshire 647 1.5%<br />
11 Cheshire 549 1.3%<br />
12 Cornwall and Isles of<br />
Scilly<br />
432 1.0%<br />
13 Cumbria 907 2.2%<br />
14 Darlington 55 0.1%<br />
15 Derby 184 0.4%<br />
16 Derbyshire 443 1.1%<br />
17 Devon 985 2.3%<br />
18 Dorset 416 1.0%<br />
19 Durham 161 0.4%<br />
20 East Riding of<br />
Yorkshire<br />
181 0.4%<br />
21 East Sussex 387 0.9%<br />
22 Essex (area outside<br />
M25)<br />
1026 2.4%<br />
23 Essex (area within<br />
M25)<br />
1 0.0%<br />
24 Gloucestershire 673 1.6%<br />
25 Greater Manchester 1139 2.7%<br />
26 Halton 40 0.1%<br />
27 Hampshire 846 2.0%<br />
28 Hartlepool 22 0.1%<br />
29 Herefordshire 240 0.6%<br />
30 Hertfordshire (area<br />
outside M25)<br />
457 1.1%<br />
31 Hertfordshire (area<br />
within M25)<br />
92 0.2%<br />
32 Inner London 1015 2.4%<br />
33 Isle of Wight 72 0.2%<br />
34 Kent (area outside<br />
M25)<br />
1382 3.3%
L15 Destination (UA)<br />
35 Kent (area within<br />
M25)<br />
5 0.0%<br />
36 Kingston upon Hull,<br />
City of<br />
159 0.4%<br />
37 Lancashire 489 1.2%<br />
38 Leicester 275 0.7%<br />
39 Leicestershire 477 1.1%<br />
40 Lincolnshire 778 1.8%<br />
41 London Central 1161 2.8%<br />
42 London Outer 1969 4.7%<br />
43 Luton 183 0.4%<br />
44 Medway Towns 37 0.1%<br />
45 Merseyside 526 1.2%<br />
46 Middlesbrough 53 0.1%<br />
47 Milton Keynes 182 0.4%<br />
48 Newbury 84 0.2%<br />
49 Norfolk 815 1.9%<br />
50 North East<br />
Lincolnshire<br />
88 0.2%<br />
51 North Lincolnshire 92 0.2%<br />
52 North Somerset 141 0.3%<br />
53 North Yorkshire 594 1.4%<br />
54 Northamptonshire 484 1.1%<br />
55 Northumberland 333 0.8%<br />
56 Nottingham 473 1.1%<br />
57 Nottinghamshire 306 0.7%<br />
58 Oxfordshire 972 2.3%<br />
59 Peterborough 268 0.6%<br />
60 Plymouth 16 0.0%<br />
61 Poole 76 0.2%<br />
62 Portsmouth 342 0.8%<br />
63 Reading 188 0.4%<br />
64 Redcar & Cleveland 45 0.1%<br />
65 Rutland 20 0.0%<br />
66 Shropshire 187 0.4%<br />
67 Slough 97 0.2%<br />
68 Somerset 742 1.8%<br />
69 South<br />
22 0.1%<br />
Gloucestershire<br />
70 South Yorkshire 667 1.6%<br />
71 Southampton 269 0.6%<br />
72 Southend on Sea 99 0.2%<br />
73 Staffordshire 355 0.8%<br />
74 Stockton-on-Tees 30 0.1%<br />
75 Stoke-on-Trent 264 0.6%<br />
76 Suffolk 714 1.7%<br />
77 Surrey (area outside<br />
M25)<br />
758 1.8%<br />
78 Surrey (area within 98 0.2%<br />
M25)<br />
79 Swindon 290 0.7%<br />
80 The Wrekin 118 0.3%<br />
81 Thurrock 51 0.1%<br />
82 Torbay 127 0.3%<br />
83 Tyne and Wear 496 1.2%<br />
National Centre for Social Research<br />
113<br />
L15 Destination (UA)<br />
84 Warrington 84 0.2%<br />
85 Warwickshire 497 1.2%<br />
86 West Midlands 1696 4.0%<br />
87 West Sussex 507 1.2%<br />
88 West Yorkshire 1152 2.7%<br />
89 Wiltshire 402 1.0%<br />
90 Windsor &<br />
Maidenhead<br />
179 0.4%<br />
91 Wokingham 129 0.3%<br />
92 Worcestershire 288 0.7%<br />
93 York 271 0.6%<br />
94 Aberdeen City 200 0.5%<br />
95 Aberdeenshire 53 0.1%<br />
96 Angus 52 0.1%<br />
97 Argyll and Bute 121 0.3%<br />
98 Clackmannshire 6 0.0%<br />
99 Dumfries & Galloway 143 0.3%<br />
100 Dundee, City of 104 0.2%<br />
101 East Ayrshire 79 0.2%<br />
102 East Dunbartonshire 0 0.0%<br />
103 East Lothian 37 0.1%<br />
104 East Renfrewshire 20 0.0%<br />
105 Edinburgh, City of 448 1.1%<br />
106 Falkirk 71 0.2%<br />
107 Fife 227 0.5%<br />
108 Glasgow, City of 422 1.0%<br />
109 Highland 320 0.8%<br />
110 Inverclyde 13 0.0%<br />
111 Midlothian 20 0.0%<br />
112 Moray 48 0.1%<br />
113 North Ayrshire 67 0.2%<br />
114 North Lanarkshire 46 0.1%<br />
115 Orkney Islands 3 0.0%<br />
116 Perth and Kinross 164 0.4%<br />
117 Renfrewshire 20 0.0%<br />
118 Scottish Borders 136 0.3%<br />
119 Shetland Islands 0 0.0%<br />
120 South Ayrshire 61 0.1%<br />
121 South Lanarkshire 94 0.2%<br />
122 Stirling 114 0.3%<br />
123 West<br />
Dunbartonshire<br />
70 0.2%<br />
124 West Lothian 80 0.2%<br />
125 Western Isles 2 0.0%<br />
126 Blaenau Gwent 13 0.0%<br />
127 Bridgend 19 0.0%<br />
128 Caerphilly 73 0.2%<br />
129 Cardiff 339 0.8%<br />
130 Carmarthenshire 128 0.3%<br />
131 Ceredigion 118 0.3%<br />
132 Conwy 108 0.3%<br />
133 Denbighshire 160 0.4%<br />
134 Flintshire 67 0.2%<br />
135 Gwynedd 300 0.7%
L15 Destination (UA)<br />
136 Isle of Anglesey 111 0.3%<br />
137 Merthyr Tydfil 52 0.1%<br />
138 Monmouthshire 126 0.3%<br />
139 Neath and Port<br />
Talbot<br />
66 0.2%<br />
140 Newport 69 0.2%<br />
141 Pembrokeshire 122 0.3%<br />
142 Powys 100 0.2%<br />
143 Rhondda, Cynon, 44 0.1%<br />
Taff<br />
144 Swansea 94 0.2%<br />
145 Torfaen 15 0.0%<br />
146 Vale of Glamorgan 19 0.0%<br />
147 Wrexham 77 0.2%<br />
Total 42139 100%<br />
Missing values are imputed using P18<br />
for all trips that end at ‘home’. For all<br />
other cases, missing values are<br />
patched by inspecting all other details<br />
of the long distance trip.<br />
L17 Urban/rural coding of destination<br />
1 Inner London 2176 5.2%<br />
2 Outer London built-up<br />
area<br />
2651 6.3%<br />
3 West Midlands built-up<br />
area<br />
1301 3.1%<br />
4 Greater Manchester<br />
built-up area<br />
1145 2.7%<br />
5 West Yorkshire builtup<br />
area<br />
902 2.1%<br />
6 Glasgow built-up area 422 1.0%<br />
7 Liverpool built-up area 347 0.8%<br />
8 Tyneside built-up area 457 1.1%<br />
9 Other urban over 250K 6017 14.3%<br />
10 Other urban over<br />
100K to 250K<br />
5373 12.8%<br />
11 Other urban over 50K<br />
to 100K<br />
4449 10.6%<br />
12 Other urban over 25K<br />
to 50K<br />
3898 9.3%<br />
13 Other urban over 10K<br />
to 25K<br />
5318 12.6%<br />
14 Other urban over 3K<br />
to 10K<br />
4027 9.6%<br />
15 Rural 3609 8.6%<br />
Total 42092 100%<br />
NA 126<br />
Missing values are imputed using P18<br />
for all trips that begin at ‘home’. For all<br />
other cases, missing values are<br />
National Centre for Social Research<br />
114<br />
patched by inspecting all other details<br />
of the long distance trip.<br />
L16 Urban/rural coding of origin<br />
1 Inner London 2162 5.1%<br />
2 Outer London built-up<br />
area<br />
2788 6.6%<br />
3 West Midlands built-up<br />
area<br />
1254 3.0%<br />
4 Greater Manchester<br />
built-up area<br />
1199 2.8%<br />
5 West Yorkshire builtup<br />
area<br />
921 2.2%<br />
6 Glasgow built-up area 421 1.0%<br />
7 Liverpool built-up area 402 1.0%<br />
8 Tyneside built-up area 461 1.1%<br />
9 Other urban over 250K 5885 14.0%<br />
10 Other urban over<br />
100K to 250K<br />
5261 12.5%<br />
11 Other urban over 50K<br />
to 100K<br />
4440 10.5%<br />
12 Other urban over 25K<br />
to 50K<br />
3950 9.41%<br />
13 Other urban over 10K<br />
to 25K<br />
5407 12.8%<br />
14 Other urban over 3K<br />
to 10K<br />
4014 9.5%<br />
15 Rural 3529 8.4%<br />
Total 42094 100%<br />
NA 124<br />
L13 Purpose from<br />
1 Commuting 3312 7.8%<br />
2 In course of work 3413 8.1%<br />
3 Education 254 0.6%<br />
4 Food shopping 57 0.1%<br />
5 Non-food shopping 618 1.5%<br />
6 Personal business<br />
medical<br />
86 0.2%<br />
7 Personal business<br />
eat/drink<br />
6 0.0%<br />
8 Personal business<br />
other<br />
1007 2.4%<br />
9 Eat/drink with friends 155 0.4%<br />
10 Visit friends at private<br />
home<br />
5148 12.2%<br />
11 Other social 767 1.8%<br />
12 Entertain/public<br />
activity<br />
1041 2.5%<br />
13 Sport: participate 274 0.6%<br />
14 Holiday: base 3481 8.2%<br />
15 Day trip 1564 3.7%<br />
16 Just walk 7 0.0%
L13 Purpose from<br />
17 Other non-escort 156 0.4%<br />
18 Escort commuting 43 0.1%<br />
19 Escort business and<br />
other work<br />
29 0.1%<br />
20 Escort education 141 0.3%<br />
21 Escort shopping/<br />
personal business<br />
225 0.5%<br />
22 Other escort 516 1.2%<br />
23 Home 19918 47.2%<br />
Total 42218 100%<br />
Missing values for L13 are patched by<br />
inspecting all other details of the long<br />
distance trip record.<br />
L7 Purpose to<br />
1 Work 3235 7.7%<br />
2 In course of work 3790 9.0%<br />
3 Education 244 0.6%<br />
4 Food shopping 77 0.2%<br />
5 Non food shopping 651 1.5%<br />
6 Personal business<br />
medical<br />
100 0.2%<br />
7 Personal business<br />
eat/drink<br />
2 0.0%<br />
8 Personal business<br />
other<br />
1234 2.9%<br />
9 Eat/drink with friends 131 0.3%<br />
10 Visit friends 5638 13.4%<br />
11 Other social 1171 2.8%<br />
12 Entertain/public<br />
activity<br />
1123 2.7%<br />
13 Sport: participate 300 0.7%<br />
14 Holiday: base 3562 8.4%<br />
15 Day trip/just walk 1719 4.1%<br />
16 Other non-escort 2 0.0%<br />
17 Escort home 214 0.5%<br />
18 Escort work 40 0.1%<br />
19 Escort in course of<br />
work<br />
34 0.1%<br />
20 Escort education 147 0.3%<br />
21 Escort<br />
shopping/personal<br />
276 0.7%<br />
business<br />
22 Other escort 515 1.2%<br />
23 Home 18013 42.7%<br />
Total 42218 100%<br />
National Centre for Social Research<br />
115<br />
L12 Purpose<br />
1 Commuting 5494 13.0%<br />
2 Business 6524 15.5%<br />
3 Other work 82 0.2%<br />
4 Education 375 0.9%<br />
5 Food shopping 115 0.3%<br />
6 Non-food shopping 1170 2.8%<br />
7 Personal business<br />
medical<br />
174 0.4%<br />
8 Personal business<br />
eat/drink<br />
6 0.0%<br />
9 Personal business<br />
other<br />
2077 4.9%<br />
10 Visit friends at private<br />
home<br />
9980 23.6%<br />
11 Eat/drink with friends 250 0.6%<br />
12 Other social 1858 4.4%<br />
13 Entertain/public 2062 4.9%<br />
activity<br />
14 Sport: participate 543 1.3%<br />
15 Holiday: base 6474 15.3%<br />
16 Day trip 3020 7.2%<br />
17 Just walk 3 0.0%<br />
18 Other non-escort 6 0.0%<br />
19 Escort commuting 45 0.1%<br />
20 Escort business and<br />
other work<br />
68 0.2%<br />
21 Escort education 254 0.6%<br />
22 Escort shopping/<br />
personal business<br />
455 1.1%<br />
23 Escort home (not<br />
own) and other escort<br />
1183 2.8%<br />
Total 42218 100%<br />
Missing values for L12 are patched<br />
from L7 and L13.<br />
L8 Mode of transport<br />
1 Walk, less than 1 mile 0 0.0%<br />
2 Walk, 1 mile or more 1 0.0%<br />
3 Bicycle 16 0.0%<br />
4 Private (hire) bus 770 1.8%<br />
5 Private car: driver 19123 45.3%<br />
6 Private car: passenger 13969 33.1%<br />
7 Motorcycle/scooter/<br />
moped: driver<br />
169 0.4%<br />
8 Motorcycle/scooter/<br />
moped: passenger<br />
19 0.0%<br />
9 Van/lorry: driver 1236 2.9%<br />
10 Van/lorry: passenger 557 1.3%<br />
11 Other private<br />
transport<br />
199 0.5%<br />
12 London stage bus 0 0.0%
13 Other stage bus 21 0.0%<br />
14 Coach/express bus 856 2.0%<br />
15 Excursion/tour bus 541 1.3%<br />
16 LT Underground 3 0.0%<br />
17 Surface Rail 4142 9.8%<br />
18 Light rail 5 0.0%<br />
19 Air 396 0.9%<br />
20 Taxi 94 0.2%<br />
21 Minicab 31 0.1%<br />
22 Other public transport 70 0.2%<br />
Total 42218 100%<br />
This refers to the mode used for the<br />
longest stage of the trip. If two or more<br />
such stages are equal in length, the<br />
latest stage is taken as the main<br />
stage.<br />
Missing values are patched by<br />
inspecting all other details of the long<br />
distance trip record.<br />
L10 Distance<br />
Based on numeric variable L9<br />
1 50 to under 75 miles 16743 39.7%<br />
2 75 to under 100 miles 7531 17.8%<br />
3 100 to under 150 miles 8788 20.8%<br />
4 150 to under 250 miles 6584 15.6%<br />
5 250 to under 350 miles 1791 4.2%<br />
6 350 miles and over 781 1.8%<br />
Total 42218 100%<br />
5.8 Trip level variables<br />
A trip is a one-way course of travel<br />
having a single main purpose.<br />
There are 593,761 trips in the 2002/03<br />
database, 278,916 in 2002 and<br />
314,845 in <strong>2003</strong>.<br />
Day<br />
J52 Day (of week)<br />
1 Monday 84339 14.2%<br />
2 Tuesday 88264 14.9%<br />
3 Wednesday 88735 14.9%<br />
4 Thursday 89871 14.9%<br />
5 Friday 92171 15.1%<br />
6 Saturday 84874 15.5%<br />
7 Sunday 65507 14.3%<br />
National Centre for Social Research<br />
116<br />
Total 593761 100%<br />
Trip type<br />
J14 Series of calls<br />
1 Yes 340 0.1%<br />
2 No 593421 99.9%<br />
Total 593761 100%<br />
When a respondent makes a series of<br />
short stops on a journey (for example,<br />
when a respondent makes a long<br />
shopping trip and calls at numerous<br />
shops), the respondent or interviewer<br />
may find it difficult to subdivide the<br />
journey into shorter trips. In this case,<br />
the trips can be combined into a single<br />
trip, which is known as a ‘series of<br />
calls’ trip.<br />
Series of calls are only used for trips<br />
for shopping, or for trips in course of<br />
work (such as a doctor’s round).<br />
If the trips consist of more than one<br />
stage, or if they vary in any significant<br />
detail (such as some trips being made<br />
as car driver, and others as car<br />
passenger), they are coded as<br />
individual trips.<br />
For strict compatibility with previous<br />
surveys, series of calls are excluded<br />
from trip or stage counts (but not from<br />
analyses of distance travelled).<br />
J23 Number of stages<br />
1 One 576613 97.1%<br />
2 Two 12533 2.1%<br />
3 Three 4012 0.7%<br />
4 Four 483 0.1%<br />
5 Five 96 0.0%<br />
6 Six 18 0.0%<br />
7 Seven or more 6 0.0%<br />
Total 593761 100%<br />
On days 1 to 6, the number of stages<br />
excludes short walks (since these are<br />
only recorded on day 7).
J37 Short walk<br />
1 Yes 17171 2.9%<br />
2 No 576590 97.1%<br />
Total 593761 100%<br />
Short walk trips are trips where the<br />
main mode was a walk of less than<br />
one mile. It therefore includes a few<br />
multi-stage trips with an overall length<br />
of more than a mile.<br />
Missing values are patched using J36.<br />
Purpose<br />
A trip purpose is defined by both<br />
‘purpose from’ and ‘purpose to’<br />
variables to derive an overall trip<br />
purpose (see below, J28).<br />
Work trips are those to or from a<br />
person’s usual workplace (see I92).<br />
In course of work trips are those made<br />
for moving to places of work other than<br />
a regular workplace (See I92). Workrelated<br />
travel for the carriage of goods<br />
(or paying passengers) is excluded<br />
from the survey altogether, as are trips<br />
made in a vehicle where the purpose<br />
is to move or deliver the vehicle itself.<br />
Education trips are those made by<br />
schoolchildren or students to schools,<br />
colleges or universities for the purpose<br />
of education (as opposed to trips<br />
attending a PTA meeting, for<br />
example).<br />
Shopping includes window-shopping<br />
as well as buying trips. Trips to obtain<br />
services found on the high street (such<br />
as a hairdresser, or a dry-cleaner) are<br />
coded as ‘other personal business’.<br />
Food shopping and non-food shopping<br />
are differentiated; when respondents<br />
purchase both types of items on the<br />
same trip, the main purpose is coded.<br />
Personal business - medical trips are<br />
those made by a person to obtain<br />
medical advice or treatment for himself<br />
National Centre for Social Research<br />
117<br />
or herself, from any medical<br />
professional. If the respondent is<br />
travelling to administer medical care,<br />
the trip will be coded as ‘in course of<br />
work’ (if the respondent was paid for<br />
doing so) or ‘other personal business’<br />
(if the respondent was, say, looking<br />
after a sick relative).<br />
Personal business – other trips include<br />
trips for other reasons that are not<br />
considered to be in the course of the<br />
respondent’s work or education, are<br />
not social, shopping or medical trips.<br />
Examples would include visits to the<br />
bank, solicitor or estate agents, visiting<br />
a relative in hospital or attending a<br />
church service.<br />
Eat/drink applies only where the main<br />
purpose of a visit was to consume<br />
food or drink at the destination. Trips<br />
to collect a take-away meal are<br />
excluded (and are coded as ‘food<br />
shopping’). Attendance at a function<br />
where food/drink is consumed, but<br />
where this is not the main purpose of<br />
the event (such as when watching a<br />
show), are also excluded (and coded<br />
as ‘entertainment/public activity’).<br />
Visit friends applies to all trips to a<br />
friend’s home. ‘Friend’ in this context<br />
includes relatives. If the visit exceeds<br />
three nights in duration, the trip is<br />
considered a holiday, and would be<br />
coded as ‘Holiday: base’.<br />
Other social includes all other trips to<br />
meet friends other than at their private<br />
home. The purpose must be to meet<br />
with the particular people, and does<br />
not apply when the trip is considered<br />
to be for the purposes of being<br />
entertained, eating, drinking, playing<br />
sport or making a day trip, all of which<br />
are coded to the relevant other<br />
categories.<br />
Entertainment/public activity includes<br />
visits to cinemas, political meetings,<br />
attending non-vocational evening<br />
classes, spectating at football matches
or playing indoor games such as<br />
snooker.<br />
Sport: participate covers all outdoor<br />
sports, along with vigorous indoor<br />
sports such as badminton, swimming<br />
or karate. However, trips to play indoor<br />
games such as darts or table tennis<br />
are coded as entertainment. All trips to<br />
watch sport are also treated as<br />
entertainment.<br />
Holiday: base trips are those made to<br />
travel to a hotel, caravan, campsite<br />
etc, where the respondent is to stay for<br />
one night or more. The trip must be for<br />
recreational or leisure purposes. Visits<br />
made to stay with friends or relatives<br />
for longer than three nights are also<br />
included.<br />
Day trip/just walk trips are those made<br />
for pleasure within a single day for<br />
which other categories are not<br />
appropriate. Examples include jogging,<br />
taking a sightseeing trip, or simply<br />
‘going for a walk’.<br />
Other non-escort covers the remaining<br />
trips not elsewhere specified. While<br />
few trips fall into this category, driving<br />
lessons are one notable exception.<br />
Sometimes, the purpose of the trip is<br />
simply to escort someone else (a<br />
parent on the school run, for example)<br />
or to accompany them (say, a small<br />
child with a parent on a trip to the<br />
shops). These trips are coded to the<br />
relevant ‘escort’ category, based upon<br />
the purpose of the trip being made by<br />
the person being accompanied.<br />
For example, when a mother takes a<br />
child to school, the trip purpose for the<br />
child is ‘education’, while for the<br />
mother the purpose is ‘escort<br />
education’.<br />
‘Escort home’ includes escorting a<br />
non-household member to their own<br />
home.<br />
National Centre for Social Research<br />
118<br />
Where the purpose of a trip could be<br />
considered ambiguous, the<br />
respondent and the interviewer (or the<br />
coding team) adjudge which is the<br />
main purpose of a trip.<br />
Home in the context of J24 and J26<br />
refers only to the respondent’s own<br />
home – not someone else’s home.<br />
J24 Purpose from<br />
1 Work 60081 10.1%<br />
2 In course of work 13389 2.3%<br />
3 Education 18226 3.1%<br />
4 Food shopping 28373 4.8%<br />
5 Non-food shopping 35717 6.0%<br />
6 Personal business<br />
medical<br />
6010 1.0%<br />
7 Personal business<br />
eat/drink<br />
249 0.0%<br />
8 Personal business 24815 4.2%<br />
other<br />
9 Eat/drink with friends 9741 1.6%<br />
10 Visit friends 42335 7.1%<br />
11 Other social 4888 0.8%<br />
12 Entertain/public 16042 2.7%<br />
activity<br />
13 Sport: participate 6939 1.2%<br />
14 Holiday: base 5235 0.9%<br />
15 Day trip/ just walk 18174 3.1%<br />
16 Other non-escort 118 0.0%<br />
17 Escort home 4604 0.8%<br />
18 Escort work 6385 1.1%<br />
19 Escort in course of<br />
work<br />
247 0.0%<br />
20 Escort education 14342 2.4%<br />
21 Escort shopping/ 13440 2.3%<br />
personal business<br />
22 Other escort 12473 2.1%<br />
23 Home 251938 42.4%<br />
Total 593761 100%<br />
J26 Purpose to<br />
1 Work 60480 10.2%<br />
2 In course of work 13204 2.2%<br />
3 Education 18682 3.1%<br />
4 Food shopping 28288 4.8%<br />
5 Non-food shopping 35670 6.0%<br />
6 Personal business<br />
medical<br />
6047 1.0%<br />
7 Personal business<br />
eat/drink<br />
242 0.0%
8 Personal business<br />
other<br />
24907 4.2%<br />
9 Eat/drink with friends 9826 1.7%<br />
10 Visit friends 42518 7.2%<br />
11 Other social 4990 0.8%<br />
12 Entertain/public<br />
activity<br />
16134 2.7%<br />
13 Sport: participate 6978 1.2%<br />
14 Holiday: base 5655 1.0%<br />
15 Day trip/ just walk 18180 3.1%<br />
16 Other non-escort 116 0.0%<br />
17 Escort home 4605 0.8%<br />
18 Escort work 6374 1.1%<br />
19 Escort in course of<br />
work<br />
252 0.0%<br />
20 Escort education 14140 2.4%<br />
21 Escort shopping/<br />
personal business<br />
13513 2.3%<br />
22 Other escort 12364 2.1%<br />
23 Home 250596 42.2%<br />
Total 593761 100%<br />
Missing values in J24 and J26 are<br />
patched using J26 and J24 of the<br />
previous and next trips or, if not<br />
available, by inspecting the rest of the<br />
trip record.<br />
J28 Purpose<br />
1 Commuting 99528 16.8%<br />
2 Business 21921 3.7%<br />
3 Other work 6626 1.1%<br />
4 Education 33820 5.7%<br />
5 Food shopping 52221 8.8%<br />
6 Non-food shopping 61813 10.4%<br />
7 Personal business<br />
medical<br />
10451 1.8%<br />
8 Personal business<br />
eat/drink<br />
333 0.1%<br />
9 Personal business<br />
other<br />
43091 7.3%<br />
10 Visit friends at<br />
private home<br />
72488 12.2%<br />
11 Eat/drink with<br />
friends<br />
16795 2.8%<br />
12 Other social 8971 1.5%<br />
13 Entertain/public<br />
activity<br />
29414 5.0%<br />
14 Sport: participate 12683 2.1%<br />
15 Holiday: base 6868 1.2%<br />
16 Day trip 16798 2.8%<br />
17 Just walk 14358 2.4%<br />
18 Other non-escort 216 0.0%<br />
19 Escort commuting 9947 1.7%<br />
National Centre for Social Research<br />
119<br />
J28 Purpose<br />
20 Escort business &<br />
other work<br />
1587 0.3%<br />
21 Escort education 23816 4.0%<br />
22 Escort shopping/<br />
personal business<br />
22812 3.8%<br />
23 Escort home (not<br />
own) and other escort<br />
27204 4.6%<br />
Total 593761 100%<br />
The overall purpose of a trip is<br />
generally derived from the ‘purpose<br />
to’, unless the purpose was to return<br />
home, (in which case the overall<br />
purpose is defined by the ‘purpose<br />
from’) or to go to work, for which<br />
special categories apply:<br />
• Commuting includes trips from<br />
home to the respondent’s usual<br />
place of work and vice versa.<br />
• Other work includes all other<br />
trips to ‘work’, and trips from<br />
‘work’ to ‘escort home’.<br />
• Business includes all trips to ‘in<br />
course of work’ and trips from<br />
‘in course of work’ back to<br />
‘home’, ‘work’ or ‘escort home’.<br />
• Escort commuting and escort<br />
business and other work trips<br />
are the equivalent of the three<br />
categories above, but occur<br />
when the respondent is<br />
travelling only to accompany<br />
someone else on a trip for such<br />
a purpose (for example, a<br />
respondent driving their spouse<br />
to work).<br />
Where a respondent records a trip to<br />
eat or drink, it is coded as either<br />
‘personal business eat/drink’ (where<br />
the purpose is for personal<br />
sustenance) or ‘eat/drink with friends’<br />
(where the primary purpose was to<br />
socialise).
Mode<br />
J36 Main mode of transport<br />
1 Walk, less than 1<br />
mile<br />
17171 2.9%<br />
2 Walk, 1 mile or more 50255 8.5%<br />
3 Bicycle 10199 1.7%<br />
4 Private (hire) bus 4574 0.8%<br />
5 Private: car driver 274451 46.2%<br />
6 Private: car<br />
passenger<br />
155606 26.2%<br />
7 Motorcycle/scooter/<br />
moped: driver<br />
2202 0.4%<br />
8 Motorcycle/scooter/<br />
moped: passenger<br />
110 0.0%<br />
9 Van/lorry: driver 11274 1.9%<br />
10 Van/lorry:<br />
passenger<br />
3302 0.6%<br />
11 Other private<br />
transport<br />
1240 0.2%<br />
12 London stage bus 8441 1.4%<br />
13 Other stage bus 32517 5.5%<br />
14 Express bus 286 0.0%<br />
15 Excursion/tour bus 294 0.0%<br />
16 LT underground 4431 0.7%<br />
17 Surface rail 8143 1.4%<br />
18 Light rail 1142 0.2%<br />
19 Air 118 0.0%<br />
20 Taxi 5299 0.9%<br />
21 Minicab 2517 0.4%<br />
22 Other public<br />
transport<br />
189 0.0%<br />
Total 593761 100%<br />
J36 is derived from S24 and stage<br />
length data.<br />
For a single-stage trip, the main mode<br />
of transport and the stage mode are<br />
equivalent (with walk trips divided into<br />
long and short walks).<br />
For a multi-stage trip, the mode used<br />
for the longest stage is coded into J36.<br />
If two or more stages are equivalent in<br />
length, the latest stage is taken to be<br />
the main stage.<br />
See S2 for a fuller description of each<br />
mode.<br />
Missing values are patched from S24<br />
and S25.<br />
National Centre for Social Research<br />
120<br />
Trip time and distance<br />
J30 Overall travelling time<br />
Based upon numeric variable J29<br />
1 Less than 3 minutes 7064 1.2%<br />
2 3 to under 8 minutes 101761 17.1%<br />
3 8 to under 15<br />
minutes<br />
128799 21.7%<br />
3 15 to under 30<br />
minutes<br />
206478 34.8%<br />
4 30 to under 45<br />
minutes<br />
85380 14.4%<br />
5 45 minutes to under 26810 4.5%<br />
1 hour<br />
6 1 to under 1.5 hours 21585 3.6%<br />
7 1.5 to under 2 hours 7278 1.2%<br />
8 2 to under 2.5 hours 3465 0.6%<br />
9 2.5 to under 3 hours 1741 0.3%<br />
10 3 to under 4 hours 1814 0.3%<br />
11 4 to under 5 hours 8722 0.1%<br />
12 5 to under 6 hours 346 0.1%<br />
13 6 hours and over 418 0.1%<br />
Total 593761 100%<br />
J30 is the accumulated time in minutes<br />
over all stages of the trip. On days 1 to<br />
6, the time taken for short walk stages<br />
were not recorded. Time spent waiting<br />
(for a train, for example) is not<br />
included.<br />
J31 Start time<br />
Based upon numeric variable J54<br />
1 0000-0059 1502 0.3%<br />
2 0100-0159 746 0.1%<br />
3 0200-0259 591 0.1%<br />
4 0300-0359 449 0.1%<br />
5 0400-0459 845 0.1%<br />
6 0500-0559 3142 0.5%<br />
7 0600-0629 3036 0.5%<br />
8 0630-0659 5406 0.9%<br />
9 0700-0714 5384 0.9%<br />
10 0715-0729 4636 0.8%<br />
11 0730-0744 8444 1.4%<br />
12 0745-0759 7852 1.3%<br />
13 0800-0814 13269 2.3%<br />
14 0815-0829 11424 1.9%<br />
15 0830-0844 17272 2.9%<br />
16 0845-0859 11453 1.9%<br />
17 0900-0914 12293 2.1%<br />
18 0915-0929 6691 1.1%<br />
19 0930-0959 16879 2.9%<br />
20 1000-1029 21488 3.6%<br />
21 1030-1059 18252 3.1%
J31 Start time<br />
22 1100-1129 22148 3.8%<br />
23 1130-1159 20160 3.4%<br />
24 1200-1229 21586 3.7%<br />
25 1230-1259 18706 3.2%<br />
26 1300-1329 21355 3.6%<br />
27 1330-1359 17455 3.0%<br />
28 1400-1429 21117 3.6%<br />
29 1430-1459 18876 3.2%<br />
30 1500-1529 31331 5.3%<br />
31 1530-1559 26718 4.5%<br />
32 1600-1629 25054 4.3%<br />
33 1630-1644 14068 2.4%<br />
34 1645-1659 7746 1.3%<br />
35 1700-1714 19156 3.2%<br />
36 1715-1729 7961 1.4%<br />
37 1730-1744 13120 2.2%<br />
38 1745-1759 6923 1.2%<br />
39 1800-1814 14054 2.4%<br />
40 1815-1829 6065 1.0%<br />
41 1830-1859 14384 2.4%<br />
42 1900-1929 15057 2.6%<br />
43 1930-1959 10851 1.8%<br />
44 2000-2029 10184 1.7%<br />
45 2030-2059 6758 1.1%<br />
46 2100-2129 7140 1.2%<br />
47 2130-2159 5211 0.9%<br />
48 2200-2229 5434 0.9%<br />
49 2230-2259 3621 0.6%<br />
50 2300-2329 3649 0.6%<br />
51 2330-2359 2485 0.4%<br />
Total 589426 100%<br />
NA 4335<br />
J31 records the start time of a trip.<br />
Band widths vary according to the time<br />
of day.<br />
Nighttime trips (0000-0559) are in<br />
hourly bands.<br />
Off-peak-time trips (0600-0659, 0930-<br />
1629, 1830-2359) are in half-hourly<br />
bands. Peak-time trips (0700-0929,<br />
1630-1829) are in quarter-hourly<br />
bands.<br />
Missing values are patched by<br />
inspecting known information from the<br />
rest of the respondent’s travel record.<br />
National Centre for Social Research<br />
121<br />
J33 Overall trip time<br />
Based upon numeric variable J32<br />
1 Less than 3 minutes 6352 1.1%<br />
2 3 to under 8 minutes 97254 16.4%<br />
3 8 to under 15<br />
minutes<br />
124503 21.0%<br />
4 15 to under 30<br />
minutes<br />
205234 34.6%<br />
5 30 to under 45<br />
minutes<br />
89095 15.0%<br />
6 45 minutes to under 28603 4.8%<br />
1 hour<br />
7 1 to under 1.5 hours 24775 4.2%<br />
8 1.5 to under 2 hours 8381 1.4%<br />
9 2 to under 2.5 hours 3673 0.6%<br />
10 2.5 to under 3 1951 0.3%<br />
hours<br />
11 3 to under 4 hours 2001 0.3%<br />
12 4 to under 5 hours 918 0.2%<br />
13 5 to under 6 hours 452 0.1%<br />
14 6 hours and over 569 0.1%<br />
Total 593761 100%<br />
J33 records the time in minutes<br />
between the start time and end time. It<br />
includes waiting time as well as<br />
ineligible travel (short walks on days 1-<br />
6, walking off the public highway, etc.)<br />
J34 Trip length<br />
Based on numeric variable Jdungross<br />
1 Under 1 mile 54555 9.2%<br />
2 1 to under 2 miles 130804 22.0%<br />
3 2 to under 3 miles 84928 14.3%<br />
4 3 to under 5 miles 103271 17.4%<br />
5 5 to under 10 miles 107099 18.0%<br />
6 10 to under 15 miles 43808 7.4%<br />
7 15 to under 25 miles 33789 5.7%<br />
8 25 to under 35 miles 12843 2.2%<br />
9 35 to under 50 miles 8526 1.4%<br />
10 50 to under 100<br />
miles<br />
9035 1.5%<br />
11 100 to under 200 3878 0.7%<br />
miles<br />
12 200 miles and over 1225 0.2%<br />
Total 593761 100%<br />
J34 is derived from S25. This is the<br />
accumulated distance over all stages<br />
in the trip. Trip distance may be<br />
understated on days 1 to 6, as short<br />
walk stages were not recorded.
J40 Overall speed<br />
1 Under 5 mph 81531 14.1%<br />
2 5 to under 7.5 mph 52900 9.2%<br />
3 7.5 to under 10 mph 47209 8.2%<br />
4 10 to under 12.5<br />
mph<br />
86615 15.0%<br />
5 12.5 to under 15<br />
mph<br />
21956 3.8%<br />
6 15 to under 17.5<br />
mph<br />
46241 8.0%<br />
7 17.5 to under 20<br />
mph<br />
42579 7.4%<br />
8 20 to under 25 mph 79322 13.8%<br />
9 25 to under 30 mph 31047 5.4%<br />
10 30 to under 35 mph 35898 6.2%<br />
11 35 to under 40 mph 19347 3.4%<br />
12 40 to under 45 mph 13159 2.3%<br />
13 45 to under 50 mph 7802 1.4%<br />
14 50 mph or higher 10984 1.9%<br />
Total 576590 100%<br />
DNA 17171<br />
Derived from J32, S25-S26 and S28.<br />
J41 Mean travel speed<br />
1 Under 5 mph 74285 12.9%<br />
2 5 to under 7.5 mph 49925 8.7%<br />
3 7.5 to under 10 mph 45742 7.9%<br />
4 10 to under 12.5<br />
mph<br />
88297 15.3%<br />
5 12.5 to under 15<br />
mph<br />
21639 3.8%<br />
6 15 to under 17.5<br />
mph<br />
47438 8.2%<br />
7 17.5 to under 20<br />
mph<br />
43888 7.6%<br />
8 20 to under 25 mph 81363 14.1%<br />
9 25 to under 30 mph 31695 5.5%<br />
10 30 to under 35 mph 37647 6.5%<br />
11 35 to under 40 mph 20276 3.5%<br />
12 40 to under 45 mph 13901 2.4%<br />
13 45 to under 50 mph 8305 1.4%<br />
14 50 mph or higher 12189 2.1%<br />
Total 576590 100%<br />
DNA 17171<br />
J41 is derived from S25, S28 and S37.<br />
J40 and J41 are recorded for all trips<br />
other than short walks.<br />
J40 represents the overall mean<br />
speed of the trip. It is calculated as the<br />
National Centre for Social Research<br />
122<br />
sum of the lengths of all stages not<br />
known to be short walks, divided by<br />
the overall trip time (from J33) and<br />
expressed in miles per hour.<br />
J41 represents the overall mean<br />
speed of the portions of the trip spent<br />
actually travelling. It is calculated as<br />
the lengths of all stages not known to<br />
be short walks, divided by the overall<br />
travelling time (from the sum of the<br />
individual stage times) and expressed<br />
in miles per hour.<br />
Missing values are patched from J37<br />
J56 Mid-point time<br />
Based on numeric variable J55<br />
1 0000-0059 1814 0.3%<br />
2 0100-0159 767 0.1%<br />
3 0200-0259 591 0.1%<br />
4 0300-0359 440 0.1%<br />
5 0400-0459 738 0.1%<br />
6 0500-0559 2718 0.5%<br />
7 0600-0629 2163 0.4%<br />
8 0630-0659 4468 0.8%<br />
9 0700-0714 3523 0.6%<br />
10 0715-0729 4572 0.8%<br />
11 0730-0744 5988 1.0%<br />
12 0745-0759 8373 1.4%<br />
13 0800-0814 10163 1.7%<br />
14 0815-0829 13159 2.2%<br />
15 0830-0844 17000 2.9%<br />
16 0845-0859 14858 2.5%<br />
17 0900-0914 10461 1.8%<br />
18 0915-0929 8543 1.4%<br />
19 0930-0959 17067 2.9%<br />
20 1000-1029 20531 3.5%<br />
21 1030-1059 18878 3.2%<br />
22 1100-1129 21551 3.7%<br />
23 1130-1159 20398 3.5%<br />
24 1200-1229 21619 3.7%<br />
25 1230-1259 19582 3.3%<br />
26 1300-1329 20786 3.5%<br />
27 1330-1359 18253 3.1%<br />
28 1400-1429 20072 3.4%<br />
29 1430-1459 19224 3.3%<br />
30 1500-1529 28484 4.8%<br />
31 1530-1559 28660 4.9%<br />
32 1600-1629 24370 4.1%<br />
33 1630-1644 11696 2.0%<br />
34 1645-1659 10599 1.8%<br />
35 1700-1714 13745 2.3%<br />
36 1715-1729 12253 2.1%
J56 Mid-point time<br />
37 1730-1744 11803 2.0%<br />
38 1745-1759 10186 1.7%<br />
39 1800-1814 11369 1.9%<br />
40 1815-1829 9151 1.6%<br />
41 1830-1859 15735 2.7%<br />
42 1900-1929 15517 2.6%<br />
43 1930-1959 11779 2.0%<br />
44 2000-2029 10218 1.7%<br />
45 2030-2059 7328 1.2%<br />
46 2100-2129 7155 1.2%<br />
47 2130-2159 5438 0.9%<br />
48 2200-2229 5488 0.9%<br />
49 2230-2259 3768 0.6%<br />
50 2300-2329 3701 0.6%<br />
51 2330-2359 2683 0.5%<br />
Total 589426 100%<br />
NA 4335<br />
J56 records the time of day when half<br />
the trip time has elapsed. The bands<br />
are the same as for J31.<br />
J60 End time<br />
Based on numeric variable J59<br />
1 0000-0059 2533 0.4%<br />
2 0100-0159 942 0.2%<br />
3 0200-0259 594 0.1%<br />
4 0300-0359 456 0.1%<br />
5 0400-0459 641 0.1%<br />
6 0500-0559 2230 0.4%<br />
7 0600-0629 1805 0.3%<br />
8 0630-0659 3136 0.5%<br />
9 0700-0714 2712 0.5%<br />
10 0715-0729 3305 0.6%<br />
11 0730-0744 4648 0.8%<br />
12 0745-0759 6454 1.1%<br />
13 0800-0814 8843 1.5%<br />
14 0815-0829 9654 1.6%<br />
15 0830-0844 15769 2.7%<br />
16 0845-0859 18208 3.1%<br />
17 0900-0914 13052 2.2%<br />
18 0915-0929 8888 1.5%<br />
19 0930-0959 17076 2.9%<br />
20 1000-1029 19614 3.3%<br />
21 1030-1059 18979 3.2%<br />
22 1100-1129 20542 3.5%<br />
23 1130-1159 20308 3.4%<br />
24 1200-1229 21511 3.6%<br />
25 1230-1259 20133 3.4%<br />
26 1300-1329 20850 3.5%<br />
27 1330-1359 18492 3.1%<br />
28 1400-1429 19745 3.3%<br />
29 1430-1459 18621 3.2%<br />
30 1500-1529 25715 4.4%<br />
National Centre for Social Research<br />
123<br />
J60 End time<br />
31 1530-1559 28491 4.8%<br />
32 1600-1629 25680 4.4%<br />
33 1630-1644 12056 2.0%<br />
34 1645-1659 10099 1.7%<br />
35 1700-1714 13406 2.3%<br />
36 1715-1729 11519 2.0%<br />
37 1730-1744 13102 2.2%<br />
38 1745-1759 9947 1.7%<br />
39 1800-1814 12796 2.2%<br />
40 1815-1829 9646 1.6%<br />
41 1830-1859 17505 3.0%<br />
42 1900-1929 16601 2.8%<br />
43 1930-1959 13187 2.2%<br />
44 2000-2029 11246 1.9%<br />
45 2030-2059 8167 1.4%<br />
46 2100-2129 7496 1.3%<br />
47 2130-2159 6094 1.0%<br />
48 2200-2229 5639 1.0%<br />
49 2230-2259 4318 0.7%<br />
50 2300-2329 3842 0.7%<br />
51 2330-2359 3133 0.5%<br />
Total 589426 100%<br />
NA 4335<br />
J60 represents the time of day when<br />
the trip finished. The bands are the<br />
same as for J31.<br />
J61 Hours when trip was in progress<br />
Multicoded<br />
1 0000-0059 1502 0.3%<br />
2 0100-0159 1050 0.2%<br />
3 0200-0259 773 0.1%<br />
4 0300-0359 644 0.1%<br />
5 0400-0459 1038 0.2%<br />
6 0500-0559 3541 0.6%<br />
7 0600-0659 9755 1.7%<br />
8 0700-0759 31130 5.3%<br />
9 0800-0859 67428 11.4%<br />
10 0900-0959 50817 8.6%<br />
11 1000-1059 51541 8.7%<br />
12 1100-1159 55256 9.4%<br />
13 1200-1259 54698 9.3%<br />
14 1300-1359 51864 8.8%<br />
15 1400-1459 52515 8.9%<br />
16 1500-1559 72198 12.2%<br />
17 1600-1659 64860 11.0%<br />
18 1700-1759 64185 10.9%<br />
19 1800-1859 50714 8.6%<br />
20 1900-1959 36675 6.2%<br />
21 2000-2059 23829 4.0%<br />
22 2100-2159 16767 2.8%<br />
23 2200-2259 12232 2.1%<br />
24 2300-2359 8409 1.4%
J61 Hours when trip was in progress<br />
25 0000-0059 +1 1434 0.2%<br />
26 0100-0159 +1 99 0.0%<br />
27 0200 onwards +1 25 0.0%<br />
Total 589426 100%<br />
NA 4335<br />
J61 represents the hours of the day in<br />
which a trip was in progress. Trips are<br />
coded to each hour that applies. For<br />
example, a trip that began at 10.30<br />
and finished at 11.15 would be coded<br />
to both category 11 and category 12.<br />
Origin and destination<br />
J57 Origin (county)<br />
1 Avon 8022 1.4%<br />
2 Bedfordshire 5447 0.9%<br />
3 Berkshire 8273 1.4%<br />
4 Buckinghamshire 6025 1.0%<br />
5 Cambridgeshire 9892 1.7%<br />
6 Cheshire 12474 2.1%<br />
7 Cleveland 3901 0.7%<br />
8 Cornwall 2285 0.4%<br />
9 Cumbria 9707 1.6%<br />
10 Derbyshire 10468 1.8%<br />
11 Devon 15302 2.6%<br />
12 Dorset 5524 0.9%<br />
13 Durham 4514 0.8%<br />
14 East Sussex 5273 0.9%<br />
15 Essex 16904 2.8%<br />
16 Gloucestershire 9348 1.6%<br />
17 Greater<br />
Manchester<br />
15753 4.3%<br />
18 Hampshire 18583 3.1%<br />
19 Hereford and<br />
Worcester<br />
6885 1.2%<br />
20 Hertfordshire 8102 1.4%<br />
21 Humberside 8430 1.4%<br />
22 Isle of Wight 1302 0.2%<br />
23 Kent 17762 3.0%<br />
24 Lancashire 12094 2.0%<br />
25 Leicestershire 10473 1.8%<br />
26 Lincolnshire 9145 1.5%<br />
27 London Central 4976 0.8%<br />
28 Other Inner London 19348 3.3%<br />
31 Other London not 35782 6.0%<br />
Central<br />
32 Merseyside 13503 2.3%<br />
33 Norfolk 8637 1.5%<br />
34 Northamptonshire 4126 0.7%<br />
35 Northumberland 6357 1.1%<br />
36 North Yorkshire 10202 1.7%<br />
National Centre for Social Research<br />
124<br />
J57 Origin (county)<br />
37 Nottinghamshire 11634 2.0%<br />
38 Oxfordshire 8817 1.5%<br />
39 Shropshire 4741 0.8%<br />
40 Somerset 8176 1.4%<br />
41 South Yorkshire 11230 1.9%<br />
42 Staffordshire 10232 1.7%<br />
43 Suffolk 8606 1.4%<br />
44 Surrey 7398 1.2%<br />
45 Tyne and Wear 10569 1.8%<br />
46 Warwickshire 5575 0.9%<br />
47 West Midlands 26499 4.5%<br />
48 West Sussex 9734 1.6%<br />
49 West Yorkshire 20431 3.4%<br />
50 Wiltshire 8516 1.4%<br />
51 Clwyd 4166 0.7%<br />
52 Dyfed 4604 0.8%<br />
53 Gwent 5223 0.9%<br />
54 Gwynedd 2607 0.4%<br />
55 Mid Glamorgan 5331 0.9%<br />
56 Powys 630 0.1%<br />
57 South Glamorgan 5175 0.9%<br />
58 West Glamorgan 2807 0.5%<br />
59 Borders 896 0.2%<br />
60 Central 4900 0.8%<br />
61 Dumfries and 678 0.1%<br />
Galloway<br />
62 Fife 3730 0.6%<br />
63 Grampian 5520 0.9%<br />
64 Highlands 1934 0.3%<br />
65 Lothian 7627 1.3%<br />
66 Strathclyde 24523 4.1%<br />
67 Tayside 4038 0.7%<br />
68 Essex within M25 15 0.0%<br />
69 Hertfordshire within 1269 0.2%<br />
M25<br />
70 Kent within M25 10 0.0%<br />
71 Surrey within M25 1101 0.2%<br />
Total 593761 100%<br />
Missing values for J57 are patched by<br />
inspecting P15 and the known<br />
variables in the trip record.<br />
J58 Destination (county)<br />
1 Avon 8035 1.4%<br />
2 Bedfordshire 5443 0.9%<br />
3 Berkshire 8257 1.4%<br />
4 Buckinghamshire 6016 1.0%<br />
5 Cambridgeshire 9871 1.7%<br />
6 Cheshire 12464 2.1%<br />
7 Cleveland 3898 0.7%<br />
8 Cornwall 2308 0.4%<br />
9 Cumbria 9712 1.6%
J58 Destination (county)<br />
10 Derbyshire 10470 1.8%<br />
11 Devon 15294 2.6%<br />
12 Dorset 5547 0.9%<br />
13 Durham 4514 0.8%<br />
14 East Sussex 5265 0.9%<br />
15 Essex 16894 2.8%<br />
16 Gloucestershire 9329 1.6%<br />
17 Greater<br />
Manchester<br />
25766 4.3%<br />
18 Hampshire 18570 3.1%<br />
19 Hereford and<br />
Worcester<br />
6862 1.2%<br />
20 Hertfordshire 8106 1.4%<br />
21 Humberside 8423 1.4%<br />
22 Isle of Wight 1309 0.2%<br />
23 Kent 17774 3.0%<br />
24 Lancashire 12089 2.0%<br />
25 Leicestershire 10458 1.8%<br />
26 Lincolnshire 9167 1.5%<br />
27 London Central 5028 0.8%<br />
28 Other Inner London 19352 3.3%<br />
31 Other London not<br />
Central<br />
35778 6.0%<br />
32 Merseyside 13497 2.3%<br />
33 Norfolk 8652 1.5%<br />
34 Northamptonshire 4116 0.7%<br />
35 Northumberland 6345 1.1%<br />
36 North Yorkshire 10186 1.7%<br />
37 Nottinghamshire 11613 2.0%<br />
38 Oxfordshire 8813 1.5%<br />
39 Shropshire 4739 0.8%<br />
40 Somerset 8181 1.4%<br />
41 South Yorkshire 11224 1.9%<br />
42 Staffordshire 10225 1.7%<br />
43 Suffolk 8599 1.4%<br />
44 Surrey 7467 1.3%<br />
45 Tyne and Wear 10593 1.8%<br />
46 Warwickshire 5571 0.9%<br />
47 West Midlands 26506 4.5%<br />
48 West Sussex 9745 1.6%<br />
49 West Yorkshire 20450 3.4%<br />
50 Wiltshire 8506 1.4%<br />
51 Clwyd 4170 0.7%<br />
52 Dyfed 4615 0.8%<br />
53 Gwent 5225 0.9%<br />
54 Gwynedd 2619 0.4%<br />
55 Mid Glamorgan 5329 0.9%<br />
56 Powys 631 0.1%<br />
57 South Glamorgan 5158 0.9%<br />
58 West Glamorgan 2799 0.5%<br />
59 Borders 890 0.1%<br />
60 Central 4888 0.8%<br />
61 Dumfries and<br />
Galloway<br />
680 0.1%<br />
National Centre for Social Research<br />
125<br />
J58 Destination (county)<br />
62 Fife 3722 0.6%<br />
63 Grampian 5505 0.9%<br />
64 Highlands 1940 0.3%<br />
65 Lothian 7625 1.3%<br />
66 Strathclyde 24525 4.1%<br />
67 Tayside 4046 0.7%<br />
68 Essex within M25 16 0.0%<br />
69 Hertfordshire within 1244 0.2%<br />
M25<br />
70 Kent within M25 10 0.0%<br />
71 Surrey within M25 1097 0.2%<br />
Total 593761 100%<br />
Missing values are patched by<br />
inspecting P15 and the known<br />
variables in the trip record.<br />
J63 Origin (UA)<br />
1 Bath and North East<br />
Somerset<br />
1580 0.3%<br />
2 Bedfordshire 2103 0.4%<br />
3 Blackburn with<br />
Darwen<br />
2697 0.5%<br />
4 Blackpool 1219 0.2%<br />
5 Bournemouth 965 0.2%<br />
6 Bracknell Forest 573 0.1%<br />
7 Brighton and Hove 1535 0.3%<br />
8 Bristol, City of 4995 0.8%<br />
9 Buckinghamshire 4251 0.7%<br />
10 Cambridgeshire 6645 1.1%<br />
11 Cheshire 10006 1.7%<br />
12 Cornwall and Isles<br />
of Scilly<br />
2284 0.4%<br />
13 Cumbria 9704 1.6%<br />
14 Darlington 438 0.1%<br />
15 Derby 2050 0.3%<br />
16 Derbyshire 8411 1.4%<br />
17 Devon 12711 2.1%<br />
18 Dorset 3733 0.6%<br />
19 Durham 4075 0.7%<br />
20 East Riding of<br />
Yorkshire<br />
2421 0.4%<br />
21 East Sussex 3731 0.6%<br />
22 Essex (area outside<br />
M25)<br />
14621 2.5%<br />
23 Essex (area within<br />
M25)<br />
15 0.0%<br />
24 Gloucestershire 9345 1.6%<br />
25 Greater<br />
Manchester<br />
25751 4.3%<br />
26 Halton 1178 0.2%<br />
27 Hampshire 10987 1.9%<br />
28 Hartlepool 585 0.1%
J63 Origin (UA)<br />
29 Herefordshire 3920 0.7%<br />
30 Hertfordshire (area<br />
outside M25)<br />
8101 1.4%<br />
31 Hertfordshire (area<br />
within M25)<br />
1269 0.2%<br />
32 Inner London 19337 3.3%<br />
33 Isle of Wight 1302 0.2%<br />
34 Kent (area outside<br />
M25)<br />
16851 2.8%<br />
35 Kent (area within<br />
M25)<br />
10 0.0%<br />
36 Kingston upon Hull,<br />
City of<br />
2320 0.4%<br />
37 Lancashire 8173 1.4%<br />
38 Leicester 3320 0.6%<br />
39 Leicestershire 7083 1.2%<br />
40 Lincolnshire 9140 1.5%<br />
41 London Central 4970 0.8%<br />
42 London Outer 35760 6.0%<br />
43 Luton 3342 0.6%<br />
44 Medway Towns 903 0.2%<br />
45 Merseyside 13482 2.3%<br />
46 Middlesbrough 928 0.2%<br />
47 Milton Keynes 1772 0.3%<br />
48 Newbury 180 0.0%<br />
49 Norfolk 8633 1.5%<br />
50 North East<br />
Lincolnshire<br />
1415 0.2%<br />
51 North Lincolnshire 2270 0.4%<br />
52 North Somerset 1309 0.2%<br />
53 North Yorkshire 7160 1.2%<br />
54 Northamptonshire 4126 0.7%<br />
55 Northumberland 6356 1.1%<br />
56 Nottingham 5307 0.9%<br />
57 Nottinghamshire 6313 1.1%<br />
58 Oxfordshire 8812 1.5%<br />
59 Peterborough 3240 0.5%<br />
60 Plymouth 271 0.0%<br />
61 Poole 823 0.1%<br />
62 Portsmouth 4239 0.7%<br />
63 Reading 1858 0.3%<br />
64 Redcar &<br />
Cleveland<br />
1086 0.2%<br />
65 Rutland 65 0.0%<br />
66 Shropshire 2433 0.4%<br />
67 Slough 1803 0.3%<br />
68 Somerset 8171 1.4%<br />
69 South<br />
Gloucestershire<br />
137 0.0%<br />
70 South Yorkshire 11228 1.9%<br />
71 Southampton 3346 0.6%<br />
72 Southend on Sea 1874 0.3%<br />
73 Staffordshire 5753 1.3%<br />
74 Stockton-on-Tees 1300 0.2%<br />
75 Stoke-on-Trent 4470 0.8%<br />
National Centre for Social Research<br />
126<br />
J63 Origin (UA)<br />
76 Suffolk 8603 1.4%<br />
77 Surrey (area<br />
outside M25)<br />
7391 1.2%<br />
78 Surrey (area within<br />
M25)<br />
1101 0.2%<br />
79 Swindon 3856 0.6%<br />
80 The Wrekin 2299 0.4%<br />
81 Thurrock 387 0.1%<br />
82 Torbay 2317 0.4%<br />
83 Tyne and Wear 10566 1.8%<br />
84 Warrington 1284 0.2%<br />
85 Warwickshire 5575 0.9%<br />
86 West Midlands 26488 4.5%<br />
87 West Sussex 9729 1.6%<br />
88 West Yorkshire 20419 3.4%<br />
89 Wiltshire 4656 0.8%<br />
90 Windsor &<br />
Maidenhead<br />
2391 0.4%<br />
91 Wokingham 14693 0.2%<br />
92 Worcestershire 2959 0.5%<br />
93 York 3026 0.5%<br />
94 Aberdeen City 3999 0.7%<br />
95 Aberdeenshire 1374 0.2%<br />
96 Angus 1372 0.2%<br />
97 Argyll and Bute 2421 0.4%<br />
98 Clackmannshire 314 0.1%<br />
99 Dumfries &<br />
Galloway<br />
678 0.1%<br />
100 Dundee, City of 1415 0.2%<br />
101 East Ayrshire 1950 0.3%<br />
102 East<br />
Dunbartonshire<br />
0 0.0%<br />
103 East Lothian 525 0.1%<br />
104 East Renfrewshire 381 0.1%<br />
105 Edinburgh, City of 4554 0.8%<br />
106 Falkirk 2630 0.4%<br />
107 Fife 3729 0.6%<br />
108 Glasgow, City of 8764 1.5%<br />
109 Highland 1886 0.3%<br />
110 Inverclyde 212 0.0%<br />
111 Midlothian 672 0.1%<br />
112 Moray 141 0.0%<br />
113 North Ayrshire 2075 0.3%<br />
114 North Lanarkshire 2697 0.5%<br />
115 Orkney Islands 46 0.0%<br />
116 Perth and Kinross 1249 0.2%<br />
117 Renfrewshire 839 0.1%<br />
118 Scottish Borders 896 0.2%<br />
119 Shetland Islands 0 0.0%<br />
120 South Ayrshire 525 0.1%<br />
121 South Lanarkshire 3097 0.5%<br />
122 Stirling 1956 0.3%<br />
123 West<br />
Dunbartonshire<br />
1545 0.3%<br />
124 West Lothian 1873 0.3%
J63 Origin (UA)<br />
125 Western Isles 1 0.0%<br />
126 Blaenau Gwent 749 0.1%<br />
127 Bridgend 460 0.1%<br />
128 Caerphilly 1782 0.3%<br />
129 Cardiff 4064 0.7%<br />
130 Carmarthenshire 1927 0.3%<br />
131 Ceredigion 1486 0.3%<br />
132 Conwy 174 0.0%<br />
133 Denbighshire 1806 0.3%<br />
134 Flintshire 1256 0.2%<br />
135 Gwynedd 1731 0.3%<br />
136 Isle of Anglesey 790 0.1%<br />
137 Merthyr Tydfil 2260 0.4%<br />
138 Monmouthshire 2010 0.3%<br />
139 Neath and Port 1401 0.2%<br />
Talbot<br />
140 Newport 1821 0.3%<br />
141 Pembrokeshire 1188 0.2%<br />
142 Powys 629 0.1%<br />
143 Rhondda, Cynon,<br />
Taff<br />
1369 0.2%<br />
144 Swansea 1404 0.2%<br />
145 Torfaen 133 0.0%<br />
146 Vale of<br />
Glamorgan<br />
1076 0.2%<br />
147 Wrexham 1011 0.2%<br />
Total 593423 100%<br />
NA 338<br />
J64 Destination (UA)<br />
1 Bath and North East<br />
Somerset<br />
1578 0.3%<br />
2 Bedfordshire 2106 0.4%<br />
3 Blackburn with<br />
Darwen<br />
2692 0.5%<br />
4 Blackpool 1220 0.2%<br />
5 Bournemouth 975 0.2%<br />
6 Bracknell Forest 574 0.1%<br />
7 Brighton and Hove 1543 0.3%<br />
8 Bristol, City of 5001 0.8%<br />
9 Buckinghamshire 4239 0.7%<br />
10 Cambridgeshire 6631 1.1%<br />
11 Cheshire 10005 1.7%<br />
12 Cornwall and Isles<br />
of Scilly<br />
2307 0.4%<br />
13 Cumbria 9709 1.6%<br />
14 Darlington 439 0.1%<br />
15 Derby 2052 0.3%<br />
16 Derbyshire 8411 1.4%<br />
17 Devon 12702 2.1%<br />
18 Dorset 3737 0.6%<br />
19 Durham 4074 0.7%<br />
20 East Riding of 2420 0.4%<br />
National Centre for Social Research<br />
127<br />
J64 Destination (UA)<br />
Yorkshire<br />
21 East Sussex 3719 0.6%<br />
22 Essex (area outside<br />
M25)<br />
14607 2.5%<br />
23 Essex (area within<br />
M25)<br />
16 0.0%<br />
24 Gloucestershire 9326 1.6%<br />
25 Greater<br />
25763 4.3%<br />
Manchester<br />
26 Halton 1173 0.2%<br />
27 Hampshire 10970 1.8%<br />
28 Hartlepool 585 0.1%<br />
29 Herefordshire 3908 0.7%<br />
30 Hertfordshire (area<br />
outside M25)<br />
8104 1.4%<br />
31 Hertfordshire (area<br />
within M25)<br />
1244 0.2%<br />
32 Inner London 19340 3.3%<br />
33 Isle of Wight 1309 0.2%<br />
34 Kent (area outside<br />
M25)<br />
16869 2.8%<br />
35 Kent (area within<br />
M25)<br />
10 0.0%<br />
36 Kingston upon Hull, 2320 0.4%<br />
City of<br />
37 Lancashire 8172 1.4%<br />
38 Leicester 3308 0.6%<br />
39 Leicestershire 7079 1.2%<br />
40 Lincolnshire 9162 1.5%<br />
41 London Central 5019 0.8%<br />
42 London Outer 35759 6.0%<br />
43 Luton 3334 0.6%<br />
44 Medway Towns 897 0.2%<br />
45 Merseyside 13473 2.3%<br />
46 Middlesbrough 930 0.2%<br />
47 Milton Keynes 1774 0.3%<br />
48 Newbury 186 0.0%<br />
49 Norfolk 8648 1.5%<br />
50 North East<br />
1414 0.2%<br />
Lincolnshire<br />
51 North Lincolnshire 2265 0.4%<br />
52 North Somerset 1319 0.2%<br />
53 North Yorkshire 7153 1.2%<br />
54 Northamptonshire 4114 0.7%<br />
55 Northumberland 6344 1.1%<br />
56 Nottingham 5308 0.9%<br />
57 Nottinghamshire 6292 1.1%<br />
58 Oxfordshire 8805 1.5%<br />
59 Peterborough 3235 0.5%<br />
60 Plymouth 273 0.0%<br />
61 Poole 832 0.1%<br />
62 Portsmouth 4232 0.7%<br />
63 Reading 1864 0.3%<br />
64 Redcar &<br />
Cleveland<br />
1089 0.2%
J64 Destination (UA)<br />
65 Rutland 67 0.0%<br />
66 Shropshire 2429 0.4%<br />
67 Slough 1790 0.3%<br />
68 Somerset 8176 1.4%<br />
69 South<br />
135 0.0%<br />
Gloucestershire<br />
70 South Yorkshire 11222 1.9%<br />
71 Southampton 3356 0.6%<br />
72 Southend on Sea 1873 0.3%<br />
73 Staffordshire 5760 1.0%<br />
74 Stockton-on-Tees 1292 0.2%<br />
75 Stoke-on-Trent 4456 0.8%<br />
76 Suffolk 8596 1.4%<br />
77 Surrey (area<br />
outside M25)<br />
7460 1.3%<br />
78 Surrey (area within 1097 0.2%<br />
M25)<br />
79 Swindon 3867 0.7%<br />
80 The Wrekin 2302 0.4%<br />
81 Thurrock 390 0.1%<br />
82 Torbay 2316 0.4%<br />
83 Tyne and Wear 10590 1.8%<br />
84 Warrington 1279 0.2%<br />
85 Warwickshire 5570 0.9%<br />
86 West Midlands 26495 4.5%<br />
87 West Sussex 9740 1.6%<br />
88 West Yorkshire 20439 3.4%<br />
89 Wiltshire 4634 0.8%<br />
90 Windsor &<br />
2392 0.4%<br />
Maidenhead<br />
91 Wokingham 1445 0.2%<br />
92 Worcestershire 2948 0.5%<br />
93 York 3017 0.5%<br />
94 Aberdeen City 3995 0.7%<br />
95 Aberdeenshire 1369 0.2%<br />
96 Angus 1379 0.2%<br />
97 Argyll and Bute 2402 0.4%<br />
98 Clackmannshire 314 0.1%<br />
99 Dumfries &<br />
Galloway<br />
680 0.1%<br />
100 Dundee, City of 1416 0.2%<br />
101 East Ayrshire 1945 0.3%<br />
102 East<br />
Dunbartonshire<br />
0 0.0%<br />
103 East Lothian 520 0.1%<br />
104 East Renfrewshire 377 0.1%<br />
105 Edinburgh, City of 4562 0.8%<br />
106 Falkirk 2621 0.4%<br />
107 Fife 3722 0.6%<br />
108 Glasgow, City of 8785 1.5%<br />
109 Highland 1894 0.3%<br />
110 Inverclyde 212 0.0%<br />
111 Midlothian 674 0.1%<br />
112 Moray 135 0.0%<br />
113 North Ayrshire 2079 0.4%<br />
National Centre for Social Research<br />
128<br />
J64 Destination (UA)<br />
114 North Lanarkshire 2692 0.5%<br />
115 Orkney Islands 46 0.0%<br />
116 Perth and Kinross 1251 0.2%<br />
117 Renfrewshire 845 0.1%<br />
118 Scottish Borders 890 0.1%<br />
119 Shetland Islands 0 0.0%<br />
120 South Ayrshire 527 0.1%<br />
121 South Lanarkshire 3094 0.5%<br />
122 Stirling 1953 0.3%<br />
123 West<br />
1550 0.3%<br />
Dunbartonshire<br />
124 West Lothian 1866 0.3%<br />
125 Western Isles 0 0.0%<br />
126 Blaenau Gwent 750 0.1%<br />
127 Bridgend 466 0.1%<br />
128 Caerphilly 1794 0.3%<br />
129 Cardiff 4050 0.7%<br />
130 Carmarthenshire 1923 0.3%<br />
131 Ceredigion 1481 0.2%<br />
132 Conwy 171 0.0%<br />
133 Denbighshire 1804 0.3%<br />
134 Flintshire 1256 0.2%<br />
135 Gwynedd 1747 0.3%<br />
136 Isle of Anglesey 790 0.1%<br />
137 Merthyr Tydfil 2252 0.4%<br />
138 Monmouthshire 2008 0.3%<br />
139 Neath and Port 1400 0.2%<br />
Talbot<br />
140 Newport 1821 0.3%<br />
141 Pembrokeshire 1208 0.2%<br />
142 Powys 630 0.1%<br />
143 Rhondda, Cynon,<br />
Taff<br />
1358 0.2%<br />
144 Swansea 1397 0.2%<br />
145 Torfaen 136 0.0%<br />
146 Vale of<br />
Glamorgan<br />
1071 0.2%<br />
147 Wrexham 1016 0.2%<br />
Total 593416 100%<br />
NA 345<br />
J65 Urban/rural coding of origin<br />
1 Inner London 24306 4.1%<br />
2 Outer London builtup<br />
area<br />
46964 7.9%<br />
3 West Midlands builtup<br />
area<br />
20395 3.4%<br />
4 Greater Manchester<br />
built-up area<br />
25761 4.3%<br />
5 West Yorkshire builtup<br />
area<br />
16432 2.8%<br />
6 Glasgow built-up<br />
area<br />
8764 1.5%
J65 Urban/rural coding of origin<br />
7 Liverpool built-up<br />
area<br />
9958 1.7%<br />
8 Tyneside built-up<br />
area<br />
8839 1.5%<br />
9 Other urban over<br />
250K<br />
79011 13.3%<br />
10 Other urban over<br />
100K to 250K<br />
77706 13.1%<br />
11 Other urban over<br />
50K to 100K<br />
60752 10.2%<br />
12 Other urban over<br />
25K to 50K<br />
70234 11.8%<br />
13 Other urban over<br />
10K to 25K<br />
73477 12.4%<br />
14 Other urban over<br />
3K to 10K<br />
42054 7.1%<br />
15 Rural 28766 4.8%<br />
Total 593419 100%<br />
NA 342<br />
J66 Urban/rural coding of destination<br />
1 Inner London 24359 4.1%<br />
2 Outer London builtup<br />
area<br />
46950 7.9%<br />
3 West Midlands builtup<br />
area<br />
20412 3.4%<br />
4 Greater Manchester<br />
built-up area<br />
25772 4.3%<br />
5 West Yorkshire builtup<br />
area<br />
16453 2.8%<br />
6 Glasgow built-up<br />
area<br />
8785 1.5%<br />
7 Liverpool built-up<br />
area<br />
9952 1.7%<br />
8 Tyneside built-up<br />
area<br />
8857 1.5%<br />
9 Other urban over<br />
250K<br />
79028 13.3%<br />
10 Other urban over<br />
100K to 250K<br />
77710 13.1%<br />
11 Other urban over<br />
50K to 100K<br />
60784 10.2%<br />
12 Other urban over<br />
25K to 50K<br />
70176 11.8%<br />
13 Other urban over<br />
10K to 25K<br />
73465 12.4%<br />
14 Other urban over<br />
3K to 10K<br />
42011 7.1%<br />
15 Rural 28706 4.8%<br />
Total 593410 100%<br />
NA 351<br />
National Centre for Social Research<br />
129<br />
Cost<br />
J62 Total cost of public transport trip<br />
Based upon numeric variable Jtotcost<br />
1 Nil 14768 23.3%<br />
2 1-49p 9209 14.5%<br />
3 50-99p 14364 22.7%<br />
4 £1-£1.99 13132 20.7%<br />
5 £2-£4.99 8360 13.2%<br />
6 £5-£9.99 2211 3.5%<br />
7 £10 and over 1333 2.1%<br />
Total 63377 100%<br />
The numeric variable that defines this<br />
variable is derived from the sum of<br />
S34 for each public transport stage of<br />
the trip.<br />
5.9 Stage level variables<br />
A stage is a part of a trip (see previous<br />
section). A new stage of a trip is<br />
defined when a new mode is used, or<br />
where there is a change of vehicle<br />
(which, in the case of a public<br />
transport trip, must require a new<br />
ticket.)
Stage details<br />
S2 Mode of transport<br />
1 Walk, less than 1<br />
mile<br />
21727 3.5%<br />
2 Walk, 1 mile or more 54806 8.9%<br />
3 Bicycle 10528 1.7%<br />
4 Private (hire) bus 4810 0.8%<br />
5 Car 434572 70.5%<br />
6 Motorcycle, scooter,<br />
moped<br />
2317 0.4%<br />
7 Van/lorry 14635 2.4%<br />
8 Other private 1249 0.2%<br />
9 London stage bus 10403 1.7%<br />
10 Other stage bus 34616 5.6%<br />
11 Coach/express bus 294 0.0%<br />
12 Excursion/tour bus 316 0.1%<br />
13 LT Underground 6312 1.0%<br />
14 Surface rail 8799 1.4%<br />
15 Light rail 1608 0.3%<br />
16 Air 118 0.0%<br />
17 Taxi 6036 1.0%<br />
18 Minicab 2699 0.4%<br />
19 Other public 433 0.1%<br />
Total 616278 100%<br />
Walk includes only walk trips made on<br />
the public highway. Thus walks in<br />
parks, countryside areas or on private<br />
land etc. are excluded.<br />
On days 1 to 6, walks of less than one<br />
mile were not recorded. On day 7, all<br />
walks of more than 50 yards are<br />
included.<br />
Children playing in the street are<br />
excluded and these periods are<br />
recorded separately (see I366 et al).<br />
Children riding in prams, pushchairs<br />
etc are included here where<br />
appropriate.<br />
Bicycle trips include all forms of nonmotorised<br />
bicycle and tricycle, with the<br />
exception of children on toy bicycles.<br />
These trips would either be coded as<br />
‘walk’ (where the intention was to go<br />
somewhere), or recorded as playing in<br />
the street (see I366 et al).<br />
National Centre for Social Research<br />
130<br />
As with all trips, bicycle stages are<br />
only recorded if they are on the public<br />
highway. Thus, mountain biking and<br />
cycling in parks would be excluded.<br />
However, cycling on the pavement or<br />
on cycle lanes is included.<br />
Private (hire) bus includes a bus (or<br />
minibus) that, for the trip concerned, is<br />
provided for use by a specific group of<br />
people and not for use by the public.<br />
The use of school buses or employer’s<br />
buses is generally included here.<br />
Car includes conventional 3-wheeled<br />
or 4-wheeled cars, land rovers and<br />
jeeps. Hire cars are included, unless a<br />
driver is provided (in which case the<br />
car is coded as a taxi or minicab).<br />
Motorcycle, scooter, moped comprises<br />
all two-wheeled motor vehicles.<br />
Van/lorry is defined as a motor vehicle<br />
with at least three wheels and no side<br />
windows to the rear of the driver’s<br />
seat.<br />
Other private includes travel by other<br />
privately available modes such as<br />
motorised caravans, invalid carriages,<br />
private aircraft or horses.<br />
London stage bus/other stage bus<br />
comprise buses that operate on stage<br />
services and are available to the public<br />
for short-distance travel. Fast services<br />
to suburban areas, although<br />
sometimes marketed as ‘express’<br />
routes, are generally included here.<br />
London buses include all local buses<br />
in London, regardless of whether they<br />
are run by TfL. London express<br />
services to Heathrow are coded as<br />
‘Coach/express bus’.<br />
Coach/express bus includes regular<br />
services available to the public,<br />
designed for long-distance travel with<br />
few or no intermediate stops.
Excursion/tour bus refers to<br />
excursions and tours by fare-paying<br />
members of the public. Seats do not<br />
need to be available on the day of<br />
travel, but they must have been<br />
available for the public to book at<br />
some point prior to travel. Buses that<br />
offer private travel only for a private<br />
group are coded as ‘private/hire bus’<br />
(see above).<br />
LT Underground is confined to train<br />
services, on the London Underground<br />
network, operated by Transport for<br />
London.<br />
Surface rail consists of all train<br />
services not included under ‘LT<br />
Underground’ above, or ‘Light rail’<br />
below.<br />
Services such as the Bluebell Line,<br />
Romney, Hythe and Dymchurch are<br />
excluded, and included in ‘other public<br />
transport’<br />
Light Rail includes the Docklands Light<br />
Railway, all metro systems outside of<br />
London, trams and similar systems.<br />
Air includes all public domestic air<br />
travel within Great Britain. Private air<br />
travel is coded as ‘other private’ (see<br />
above). Trips made for the pleasure of<br />
going in a plane rather than to get<br />
somewhere are excluded from the<br />
survey.<br />
Taxi refers to all private hire vehicles<br />
that a member of the public could<br />
legally hail in the street.<br />
Minicab refers to private hire cars that<br />
should legally be booked in advance.<br />
Where there is confusion as to<br />
whether a vehicle is a taxi or a<br />
minicab, the interviewer will probe the<br />
respondent for information such as:<br />
• How the taxi was ordered (by<br />
telephone or being hailed in the<br />
street)<br />
National Centre for Social Research<br />
131<br />
• Whether the vehicle had a<br />
meter (a taxi will always have a<br />
meter)<br />
• Whether the vehicle displayed<br />
a ‘taxi’ sign on the roof, or a<br />
‘hackney carriage’ sign on the<br />
rear (which would both indicate<br />
the vehicle was a taxi)<br />
Other public transport includes the few<br />
public transport trips not elsewhere<br />
specified. This category includes trips<br />
by trains excluded from ‘surface rail’<br />
(see above) are included here, along<br />
with travel by water.<br />
Missing variables are patched by<br />
inspecting the known variables in the<br />
travel record.<br />
S15 Number of boardings<br />
Based on numeric variable S38<br />
1 64156<br />
2 6693<br />
3 601<br />
4 116<br />
5 13<br />
6 9<br />
7 7<br />
8 3<br />
9 6<br />
Total 71604<br />
DNA 544674<br />
S15 applies to stages undertaken by<br />
public transport, and records the<br />
number of vehicles boarded during the<br />
stage.<br />
If, however, the mode of transport was<br />
different, or if a new ticket was<br />
required, the new boarding is<br />
considered a separate stage.<br />
Missing values are patched using S2<br />
and S37.<br />
S24 Means of travel<br />
1 Walk, less than 1<br />
mile<br />
21727 3.5%<br />
2 Walk, 1 mile or more 54806 8.9%<br />
3 Bicycle 10528 1.7%
S24 Means of travel<br />
4 Private (hire) bus 4810 0.8%<br />
5 Household car –<br />
driver<br />
272186 44.2%<br />
6 Non-household car –<br />
driver<br />
4420 0.7%<br />
7 Household car –<br />
passenger<br />
115448 18.7%<br />
8 Non-household car –<br />
passenger<br />
42518 6.9%<br />
9 Household<br />
motorcycle – driver<br />
2058 0.3%<br />
10 Non-household<br />
motorcycle – driver<br />
147 0.0%<br />
11 Household<br />
motorcycle –<br />
passenger<br />
59 0.0%<br />
12 Non-household<br />
motorcycle –<br />
passenger<br />
53 0.0%<br />
13 Household<br />
van/lorry – driver<br />
8768 1.4%<br />
14 Non-household<br />
van/lorry – driver<br />
2539 0.4%<br />
15 Household<br />
van/lorry – passenger<br />
1251 0.2%<br />
16 Non-household<br />
van/lorry – passenger<br />
2077 0.3%<br />
17 Other private<br />
transport<br />
1249 0.2%<br />
18 London stage bus 10403 1.7%<br />
19 Other stage bus 34616 5.6%<br />
20 Public express<br />
bus/coach<br />
294 0.0%<br />
21 Excursion/tour bus 316 0.1%<br />
22 LT Underground 6312 1.0%<br />
23 Surface Rail 8799 1.4%<br />
24 Light rail 1608 0.3%<br />
25 Air 118 0.0%<br />
26 Taxi 6036 1.0%<br />
27 Minicab 2699 0.4%<br />
28 Other public<br />
transport<br />
433 0.1%<br />
Total 616278 100%<br />
S24 is an extension of S2 (see above),<br />
but uses other variables to incorporate<br />
information such as ownership of a<br />
private vehicle, and whether the<br />
respondent was a driver or a<br />
passenger.<br />
National Centre for Social Research<br />
132<br />
S26 Length of stage<br />
Based on numeric variable s25<br />
1 Under 1 mile 60225 9.8%<br />
2 1 to under 2 miles 138716 22.5%<br />
3 2 to under 3 miles 88567 14.4%<br />
4 3 to under 5 miles 106544 17.3%<br />
5 5 to under 10 miles 109135 17.7%<br />
6 10 to under 15 miles 44031 7.1%<br />
7 15 to under 25 miles 33780 5.5%<br />
8 25 to under 35 miles 12902 2.1%<br />
9 35 to under 50 miles 8386 1.4%<br />
10 50 to under 75<br />
miles<br />
6263 1.0%<br />
11 75 to under 100<br />
miles<br />
2740 0.4%<br />
12 100 to under 150<br />
miles<br />
2616 0.4%<br />
13 150 to under 200<br />
miles<br />
1205 0.2%<br />
14 200 miles and over 1168 0.2%<br />
Total 616278 100%<br />
The count of trips under 1 mile in S26<br />
is understated on days 1 to 6, since<br />
short walks are not recorded.<br />
Missing values are patched using J51,<br />
S24, S36 and S37.<br />
S27 Stage speed<br />
1 Less than 5 mph 98730 16.0%<br />
2 5 mph to under 10<br />
mph<br />
100796 16.4%<br />
3 10 mph to under 20<br />
mph<br />
206056 33.4%<br />
4 20 mph to under 30<br />
mph<br />
114740 18.6%<br />
5 30 mph to under 40<br />
mph<br />
59605 9.7%<br />
6 40 mph to under 50<br />
mph<br />
22903 3.7%<br />
7 50 mph and over 13448 2.2%<br />
Total 616278 100%<br />
Derived from S2, S9, S25 and S36.<br />
S28 Short walk<br />
1 Yes 21727 3.5%<br />
2 No 594551 96.5%<br />
Total 616278 100%
S28 is derived from D1 (day of travel<br />
record) and S24-25.<br />
Short walks are walks shorter than one<br />
mile in length, and are recorded only<br />
on the last day of the Travel Week.<br />
S37 Travel time<br />
Based on numeric variable S36<br />
1 Less than 3 minutes 7880 1.3%<br />
2 3 to under 8 minutes 107284 17.4%<br />
3 8 to under 15<br />
minutes<br />
135571 22.0%<br />
4 15 to under 30<br />
minutes<br />
217542 35.3%<br />
5 30 to under 45<br />
minutes<br />
87756 14.2%<br />
6 45 to under 1 hour 25815 4.2%<br />
7 1 hour to under 1.5 19751 3.2%<br />
hours<br />
8 1.5 to under 2 hours 6706 1.1%<br />
9 2 to under 2.5 hours 3268 0.5%<br />
10 2.5 to 3 hours 1600 0.3%<br />
11 3 to under 4 hours 1683 0.3%<br />
12 4 to under 5 hours 729 0.1%<br />
13 5 to under 6 hours 318 0.1%<br />
14 6 hours and over 375 0.1%<br />
Total 616278 100%<br />
S37 may be understated on days 1-6,<br />
since short walks are not recorded.<br />
Missing values are patched using all<br />
known information from the travel<br />
record.<br />
Number in party<br />
S8a Number in party (adults)<br />
Based on numeric variable S7a<br />
0 16064 15.0%<br />
1 62558 58.5%<br />
2 25331 23.7%<br />
3 2215 2.1%<br />
4 576 0.5%<br />
5 124 0.1%<br />
6 74 0.1%<br />
7 or more 42 0.0%<br />
Total 106984 100%<br />
Adult journey 509294<br />
National Centre for Social Research<br />
133<br />
S8c Number in party (children)<br />
Based on numeric variable s7c<br />
0 0 0.0%<br />
1 43548 40.7%<br />
2 41300 38.6%<br />
3 14955 14.0%<br />
4 4496 4.2%<br />
5 1162 1.1%<br />
6 484 0.5%<br />
7 or more 1039 1.0%<br />
Total 106984 100%<br />
Adult journey 509294<br />
S8t Number in party (total)<br />
Based on numeric variable s7<br />
1 272963 44.3%<br />
2 190271 30.9%<br />
3 81921 13.3%<br />
4 46650 7.6%<br />
5 16819 2.7%<br />
6 3960 0.6%<br />
7 or more 3694 0.6%<br />
Total 616278 100%<br />
A party is a group of people who<br />
decide to travel together, set out<br />
together and stay together for at least<br />
half the distance of the stage. For<br />
travel in private vehicles, the party<br />
comprises people using the same<br />
vehicle and is a measure of vehicle<br />
occupancy, which may be used to<br />
estimate passenger-miles.<br />
The number in party the does not<br />
include, for example, other passengers<br />
on a bus.<br />
All trips are recorded for the purposes<br />
of S8t (previously called S8), while all<br />
trips with children present are now<br />
additionally recorded in S8a and S8c.<br />
Missing values are patched to the<br />
mean value of 2.
Private vehicles<br />
S18 Private vehicle occupant<br />
1 Front passenger 95665 21.1%<br />
2 Rear passenger 66495 14.7%<br />
3 Driver 290613 64.2%<br />
Total 452773 100%<br />
DNA 163505<br />
S18 applies to stages in private<br />
vehicles (other than hire buses), and<br />
records whether the respondent was a<br />
driver or passenger of the vehicle.<br />
Missing values are patched using<br />
I182, S8 and S2.<br />
S19 Where parked<br />
1 On own/friend’s<br />
premises<br />
98897 34.6%<br />
2 Firm/work car park 30637 10.7%<br />
3 Other private car<br />
park<br />
4450 1.6%<br />
4 Park & ride car park 181 0.1%<br />
5 Public car park 63313 22.1%<br />
6 Street 76839 26.9%<br />
7 Not parked 10605 3.7%<br />
8 Other 941 0.3%<br />
Total 285863 100%<br />
NA 4750<br />
DNA 325665<br />
S19 indicates where a respondent<br />
parked the vehicle at the end of a car<br />
driver stage.<br />
‘Not parked’ indicates where a vehicle<br />
was not parked, but the vehicle was<br />
driven away buy someone other than<br />
the respondent.<br />
‘Street’ parking includes all parking on<br />
the street, including the street at the<br />
respondent’s home or workplace.<br />
S21 Parking cost (pence)<br />
Based on numeric variable S39<br />
1 Nil 281819 97.0%<br />
2 1p to 9p 61 0.0%<br />
3 10p to 19p 101 0.0%<br />
4 20p to 29p 326 0.1%<br />
National Centre for Social Research<br />
134<br />
3 30p to 39p 367 0.1%<br />
6 40p to 49p 371 0.1%<br />
7 50p to 99p 2002 0.7%<br />
8 £1 to £1.49 1958 0.7%<br />
9 £1.50 to £1.99 868 0.3%<br />
10 £2 and over 2740 0.9%<br />
Total 290613 100%<br />
DNA 325665<br />
S21 applies to driver stages in private<br />
vehicles. If a respondent paid a lump<br />
sum to cover all parking over a period,<br />
the interviewer apportioned the cost<br />
over each period of parking to derive<br />
parking costs for each stage.<br />
Where no value is supplied, S21 is<br />
patched to the modal value, nil.<br />
Tickets and costs<br />
S30 Ticket cost (1)<br />
Based on numeric variable S29<br />
1 Nil 30792 43.0%<br />
2 Under 10p 27 0.0%<br />
3 10p to under 15p 31 0.0%<br />
4 15p to under 20p 103 0.1%<br />
5 20p to under 30p 894 1.2%<br />
6 30p to under 50p 5468 7.6%<br />
7 50p to under 75p 7471 10.4%<br />
8 75p to under £1 5120 7.2%<br />
9 £1 to under £1.50 8718 12.2%<br />
10 £1.50 to under £2 3090 4.3%<br />
11 £2 to under £3 3973 5.5%<br />
12 £3 to under £5 2765 3.9%<br />
13 £5 and over 3152 4.4%<br />
Total 71604 100%<br />
DNA 544674<br />
S30 records the cost paid for a<br />
particular public transport stage (in<br />
money or travel tokens). Cards that<br />
can be charged with prepaid credit<br />
(such as the pre-pay Oyster, in<br />
London) are included here. It does not<br />
include any costs paid for season<br />
tickets, travelcards etc, which are<br />
recorded in S32.<br />
Missing values for public transport<br />
trips are patched using the most<br />
common value, nil.
S32 Ticket cost (2)<br />
Based on numeric variable S31<br />
1 Nil 17263 53.3%<br />
2 Under 10p 1162 3.6%<br />
3 10p to under 15p 546 1.7%<br />
4 15p to under 20p 784 2.4%<br />
5 20p to under 30p 1212 3.7%<br />
6 30p to under 50p 2433 7.5%<br />
7 50p to under 75p 2244 6.9%<br />
8 75p to under £1 1572 4.9%<br />
9 £1 to under £1.50 1970 6.1%<br />
10 £1.50 to under £2 1053 3.3%<br />
11 £2 to under £3 1031 3.2%<br />
12 £3 to under £5 752 2.3%<br />
13 £5 and over 374 1.2%<br />
Total 32396 100%<br />
NA 9<br />
DNA 583873<br />
S32 applies where the respondent<br />
used a special pass that may be used<br />
for an unlimited of trips, and refers to<br />
the estimated cost of a single use.<br />
The cost of a single stage was<br />
estimated from the information<br />
obtained on the individual<br />
questionnaire about the cost of the<br />
ticket/pass, the method(s) of travel for<br />
which it was valid, how long it lasted<br />
for, and how often it was used. The<br />
resulting estimate of stage cost was<br />
allocated to each stage for which the<br />
ticket/pass was used, assuming that<br />
the cost for multi-mode trips was<br />
proportional to the length of the trip.<br />
The use of travel tokens/carnets was<br />
recorded at S29 rather than here<br />
because they have an identifiable cost<br />
per token, which was recorded in the<br />
travel record.<br />
S32 is patched for public transport<br />
trips, to the most likely value, DNA.<br />
This indicates that a special pass was<br />
not used.<br />
S34 Total cost<br />
Based on numeric variable S33<br />
1 Nil 16784 23.4%<br />
2 Under 10p 713 1.0%<br />
3 10p to under 15p 504 0.7%<br />
4 15p to under 20p 744 1.0%<br />
National Centre for Social Research<br />
135<br />
5 20p to under 30p 2069 2.9%<br />
6 30p to under 50p 7702 10.8%<br />
7 50p to under 75p 9628 13.4%<br />
8 75p to under £1 6689 9.3%<br />
9 £1 to under £1.50 10628 14.8%<br />
10 £1.50 to under £2 4152 5.8%<br />
11 £2 to under £3 4992 7.0%<br />
12 £3 to under £5 3508 4.9%<br />
13 £5 and over 3491 4.9%<br />
Total 71604 100%<br />
DNA 544674<br />
S34 is the sum of S30 and S32.<br />
S35 Type of ticket<br />
1 Ordinary adult 29676 41.4%<br />
2 Ordinary child 4592 6.4%<br />
3 Reduced ordinary<br />
adult<br />
2000 2.8%<br />
4 Reduced ordinary<br />
child<br />
438 0.6%<br />
5 Special category<br />
reduced<br />
2124 3.0%<br />
6 Other (including free) 481 0.7%<br />
7 Season ticket 5738 8.0%<br />
8 Travelcard 7396 10.3%<br />
9 Combined<br />
season/travelcard<br />
1586 2.2%<br />
10 Railcard 298 0.4%<br />
11 Other nonconcessionary<br />
879 1.2%<br />
12 OAP Pass 10247 14.3%<br />
13 Scholar’s pass 3362 4.7%<br />
14 Disabled person’s<br />
pass<br />
1059 1.5%<br />
15 Subsidised travel<br />
tickets<br />
100 0.1%<br />
16 Concessionary –<br />
employees<br />
638 0.9%<br />
17 Concessionary –<br />
unemployed<br />
0 0.0%<br />
18 Other<br />
concessionary<br />
1102 1.5%<br />
Total 71716 100%<br />
DNA (not public stage) 544562<br />
S35 applies to all public transport<br />
stages.<br />
Ordinary adult means the full adult fare<br />
for a single trip. All taxi fares are<br />
entered here.
Ordinary child means the full child fare<br />
for a single trip.<br />
Reduced ordinary adult, reduced<br />
ordinary child, special category<br />
reduced and other (inc. free) are<br />
reduced-rate tickets for single or return<br />
trips, representing reductions offered<br />
by the travel operator. Examples of<br />
those entitled in some or all areas are<br />
children under five, pensioners or the<br />
unemployed.<br />
Other tickets include free travel<br />
available to the public and tickets<br />
purchased as part of a larger package<br />
such as a combined hotel and travel<br />
booking. See also I185 for examples<br />
of ticket types.<br />
Missing values are patched using<br />
information from the individual<br />
questionnaire.<br />
National Centre for Social Research<br />
136
National Centre for Social Research<br />
6 DEFINITIONS COMPARED WITH EARLIER SURVEYS<br />
This chapter consists of two parts. The first part summarises the main differences<br />
between previous NTS surveys and the current continuous survey (2002 to <strong>2004</strong>). The<br />
second part gives a more detailed description of the changes made to the NTS over<br />
time.<br />
6.1 Summary of differences for each NTS<br />
The summaries below draw upon comparative analyses of past NTS data and highlight<br />
the main effects of the changes to the survey over time, such as changes in definitions<br />
and questions. These changes are described in the more detail in Section 6.2.<br />
Series of calls<br />
The summaries below do not refer to the various treatments of multiple-stop trips,<br />
typically trips from shop to shop, known in this report as ‘series of calls’ trips. Starting<br />
with the 1985/86 NTS, a trip to the shops, around the shops and then back again was<br />
regarded as three trips with the trip around the shops being treated as a series of calls<br />
trip.<br />
Previously a trip around the shops was either omitted (1965 to 1975/76) or else included<br />
as part of the original trip to the shops (1978/79). Series of calls trips are generally<br />
excluded from analyses of the latest surveys, so that the number of trips on a shopping<br />
trip is comparable with that in earlier surveys, i.e. two. However, it is possible that some<br />
series of calls-type trips may have been treated as two or more trips in some of the<br />
earlier surveys. Analyses of distance travelled normally include series of calls trips.<br />
However they are normally short trips and it is assumed that the omission of these trips<br />
from the 1975/76 and earlier NTSs does not lead to too much bias in the estimate of<br />
distance travelled for these surveys.<br />
1965<br />
a. The first National Travel Survey was run in 1965. There are many differences<br />
between this first survey and the 2002 to <strong>2004</strong> survey. These are given in detail in<br />
section 6.2.<br />
b. In 1965 information was not held on computer files, so analyses were restricted<br />
to those tabulations prepared immediately after the survey.<br />
1972/73<br />
a. The 1972/73 survey had the smallest sample size of all NTSs.<br />
b. London residents were under-represented by 30 per cent.<br />
c. Trips by children under 3 were not collected.<br />
137
National Centre for Social Research<br />
d. The 1972/73 database includes information from households that did not cooperate<br />
fully with the survey. For 2002 to <strong>2004</strong>, analyses are restricted to fully<br />
co-operating households – this was also done between 1985 and 2001. This<br />
may lead to differences with figures given in earlier reports.<br />
e. The number of trips recorded was overcounted relative to the 2002 to <strong>2004</strong><br />
survey, mainly because trips were more ‘broken up’ in 1972/73 than in later<br />
surveys. In 1972/73, no guidance was given on the treatment of subsidiary<br />
purposes when defining trips. For example, it is thought that some subsidiary<br />
purposes, such as stopping for a newspaper on the way to work were often<br />
coded as two trips in 1972/73 rather than one, as in later surveys. Also, very<br />
short walks under of 50 yards were included. The extra trips were mainly<br />
shopping trips under 1 mile, and education and entertainment trips of all lengths.<br />
For rough comparisons with 2002 to <strong>2004</strong> data, the overall the number of trips in<br />
1972/73 should be reduced by about 15 per cent.<br />
f. The number of escort trips was around half that for the 2002 to <strong>2004</strong> surveys,<br />
mainly because accompanying travellers took their trip purpose from that of the<br />
person being accompanied and were not coded as ‘escort’. Education, shopping<br />
and personal business trips were boosted as a result of this switch.<br />
g. The number of holiday trips was about one-third of that on more recent surveys,<br />
and day trips were also a little higher. There is no clear reason for the apparent<br />
misclassification in 1972/73.<br />
h. Evidence suggests that respondents’ estimates of walk distance were too high.<br />
i. Information on trip time and travelling time were less reliable because they were<br />
only collected on the 7th day of the travel week.<br />
j. The type of area variable is biased in favour of larger types of area. In particular,<br />
areas with low population densities were often coded as areas with higher<br />
densities. Data on type of area are not therefore strictly comparable with other<br />
NTSs.<br />
k. Population density was given in terms of persons per acre and is therefore not<br />
comparable with other NTSs.<br />
l. Availability of numerical data is severely limited. Only stage distance, time and<br />
cost is available.<br />
m. No data are available for health-related travel difficulties, fuel put into household<br />
vehicles and a few other topics.<br />
1975/76<br />
a. No information was collected about children under 3.<br />
138
National Centre for Social Research<br />
b. London residents were under-represented by 25 per cent.<br />
c. Information on partially cooperating households is held on the database (see<br />
1972/73 d. above).<br />
d. The number of trips recorded is reasonably consistent with more recent surveys,<br />
although there were some differences in the coding of trip purpose (see e. and f.<br />
below).<br />
e. Escort trips were under-recorded (see 1972/73 f. above).<br />
f. A short walk stage, i.e. over 50 yards and under 1 mile, was only included if it<br />
was the final or only stage. Attempts to impute short walk stages at the start of a<br />
trip from information on trip times were not entirely successful. Walk stages in the<br />
middle of trips were not counted at all.<br />
g. Short day trips, mostly walks, were slightly under recorded compared with other<br />
NTSs, possibly because interviewers misunderstood the advice to record them<br />
only if it was a final or only stage on the 7th day. (Note: A similar difference<br />
occurred in 2002 and <strong>2003</strong>, see below.)<br />
h. Unlike all other NTSs, works/school buses were regarded as being part of the<br />
public transport system. In all other NTSs they were treated as private transport.<br />
(Note: A new variable has been developed which allows 1975/76 data to be<br />
compared with those of other NTSs).<br />
i. Total trip time and travelling time (but not start time) are unreliable because they<br />
were only collected on the 7th day of the travel week.<br />
j. Compared with the more recent NTSs, type of area data was biased in favour of<br />
less densely populated areas, mainly because the classification was based on<br />
ward level information, not postcode sectors.<br />
k. Data on population density are not comparable with other NTSs.<br />
l. The availability of numerical data is severely limited. Only eligible vehicle mileage<br />
and journey stage distance, time and cost are available.<br />
m. No data are available for health-related travel difficulties, fuel put into household<br />
vehicles and a few other topics.<br />
1978/79<br />
a. The response rate was very poor. Car-owning households were badly underrepresented.<br />
b. London residents were under-represented by 40 per cent.<br />
139
National Centre for Social Research<br />
c. The number of trips was over-recorded relative to 2002 to <strong>2004</strong>. Shopping and<br />
social trips were particularly over-recorded. It is assumed that this is because the<br />
interviewers ‘broke up’ trips to a greater extent than in 1975/76 or in later surveys<br />
and included more trips with just subsidiary purposes.<br />
d. Escort trips were under-recorded. See 1972/73 f. above<br />
e. Day trips under 1 mile, mostly of the ‘just walk’ category, were almost half the<br />
number expected. This was possibly because the code was split into two on the<br />
questionnaire – day trip countryside and day trip other – neither of which may<br />
have seemed appropriate for a short round trip walk.<br />
f. Type of area data was biased in favour of less densely populated areas. See<br />
1975/76 j. above.<br />
g. Population density data are not comparable with other NTSs because they were<br />
derived from a special method to link the data with the 1971 Census.<br />
h. The availability of numerical data is a little limited; e.g. age is only available from<br />
18 groups of age ranges.<br />
i. No data are available for health-related travel difficulties, fuel put into household<br />
vehicles and a few other topics.<br />
1985/86 and continuous survey 1988 to 2001<br />
a. The sample size in each survey year was around a third of the 2002 to <strong>2004</strong><br />
continuous survey. Details of particular sample size changes are described in<br />
section 6.2.<br />
b. Travel diary data was coded by interviewers. From 2002, the diary data was<br />
coded centrally and considerable efforts were made by the contractor to clarify<br />
definitions to ensure greater consistency for trip mode and purpose. This resulted in<br />
some discontinuities for some mode and purpose categories.<br />
c. Survey years from 1988 to 2001 relate to calendar year 1 January - 31<br />
December. From 2002, the survey year relates to mid-January to mid-January.<br />
d. London residents were under-represented by about 14 per cent in 1985/86 and in<br />
1989/91. Boosts to the London sample were introduced in 1993; further details are<br />
given in section 6.2.<br />
e. Response rates were higher in the 1980s and 1990s compared with the current<br />
survey (see Table 6.1):<br />
140
National Centre for Social Research<br />
Table 6.1 Response rates, 1985/86 to <strong>2003</strong>/04<br />
Survey year(s) Response rate (%)<br />
1985/86 76<br />
1989/91 80<br />
1992/94 76<br />
1995/97 72<br />
1998/2000 65<br />
2002 54<br />
<strong>2003</strong> and <strong>2004</strong> 60<br />
2002 and <strong>2003</strong><br />
a. Short walks under 1 mile, only recorded on Day 7, were under recorded in 2002<br />
and, to a lesser extent, in <strong>2003</strong>. Data on short walks in <strong>2004</strong> were consistent with<br />
trends up to 2001.<br />
b. An unconditional incentive of a book of stamps was introduced in mid <strong>2004</strong>. This<br />
had the effect of reducing refusals.<br />
c. Conditional incentives were tested in 2002 and fully introduced in <strong>2003</strong>.<br />
Incentives improved the response rate, primarily as a result of a shift from partially to<br />
fully responding households.<br />
6.2 Detailed list of changes in procedure and definitions<br />
6.2.1 Definition of a journey/ trip<br />
1965<br />
Travel off the public highway was included in the survey. A journey (now known as a<br />
‘trip’) was defined as ‘a one-way course of travel having one single main purpose’.<br />
Examples of subsidiary purposes, such as stopping to get a packet of cigarettes on the<br />
way home, were given.<br />
1972/73<br />
Walking and travelling by vehicle was only included if on or by public roads. Interviewers’<br />
instructions did not advise whether subsidiary purposes, for example, ‘stops to get a<br />
packet of cigarettes on the way home’ constituted a separate trip purpose.<br />
1975/76<br />
Travel off the public highway (e.g. in private gardens, across parks or open country, or<br />
on public footpaths or private land) was excluded. The definition manual specified<br />
examples where the subsidiary purpose was trivial, incidental and to be disregarded.<br />
Otherwise the ruling was the same as in the previous surveys but it is possible that the<br />
more precise written advice in 1965 and 1975/76 affected the number of trips recorded.<br />
141
National Centre for Social Research<br />
1978/79<br />
As 1975/76, except that walking around the shops was also included.<br />
1985/86<br />
The definition manual was re-written to give more emphasis to the criteria to be used by<br />
interviewers in deciding how to break travel into trips. The most important was the<br />
respondent’s own opinion on their journey purpose.<br />
A new concept was introduced to deal with trips containing multiple stops. Series of calls<br />
were trips made up of frequently broken travel between many stops. See notes on<br />
shopping trips below.<br />
1988 to 2001 continuous survey<br />
As 1985/86, except that interviewers were instructed to restrict the use of series of calls<br />
to single-stage trips made for the purpose of either ‘shopping’ or ‘in course of work’.<br />
2002 to <strong>2004</strong> continuous survey<br />
As 1988 to 2001.<br />
6.2.2 Trip purpose<br />
1965<br />
The purpose of a trip was defined by its destination, except in cases where the trip was<br />
made to home in which case the purpose was determined by the place of origin. There is<br />
a possibility that more trips made on holiday were missed than in other surveys because<br />
the number of days between the contact interview and start of the travel period was kept<br />
short. Shopping trips were separated into ‘convenience’ and ‘goods’.<br />
1972/73<br />
The interviewers instructions were less specific: for overall trip purpose it was stated that<br />
‘the trip homeward takes the same purpose as the trip outward’. It is not clear how<br />
'outward' was interpreted (for example, for trips from home to shops, shops to friends<br />
then friends to home); neither is it clear how 'homeward' was to be interpreted (for<br />
example, for trips from work to shops and back).<br />
On the 7th day only, trip purpose from and trip purpose to were generated from origin<br />
and destination land use codes together with the overall trip purpose. Where the land<br />
use origin or destination was home the trip purposes from and to could be generated<br />
directly. In other cases the trip purpose from was based on the destination of the<br />
previous trip, while trip purpose to took the same value as the overall trip purpose.<br />
Difficulties with unknown land use led to the under recording of holiday trips. These<br />
definitions are not directly comparable with the later surveys. After one month in the field<br />
several codes were changed from the 1965 definition to the 1975/76 definition; i.e. sport<br />
was sub-divided into ‘watching’ and ‘participating’ and holidays and day trips were split.<br />
142
National Centre for Social Research<br />
1975/76<br />
On all days of the recording period, overall purpose was derived from recorded<br />
information of trip purpose to and trip purpose from e.g. from ‘work’ to ‘shops’. The trip<br />
purpose to was the overall purpose in all cases except where it was ‘home’ in which<br />
case the trip purpose from applied.<br />
1978/79<br />
Derived as in 1975/76. However the inclusion of the 3-week car diaries, which had a<br />
different trip purpose structure, led to some changes. In particular, holidays, which in<br />
1975/76 were defined as ‘at least one night away from home for leisure/recreation<br />
purposes’, in 1978/79 excluded staying with friends or relatives for 1-3 nights. Instead<br />
these short stops with friends were coded as social. The changed treatment of shopping<br />
round trips and walking between shops (see below) led to an increase in shopping and<br />
personal business trips. The holiday and day trip purposes were sub-divided into<br />
‘countryside’ and ‘elsewhere’.<br />
1985/86<br />
The main change from 1978/79 was to extend the ‘escort’ category to include trips<br />
accompanying others. For instance, a child taken shopping by an adult would be<br />
classified as ‘escorting’ in 1985/86, rather than as shopping, as was the case in 1978/79.<br />
The 1985/86 dataset identifies the purpose of the person accompanied or escorted as<br />
well as the main purpose where this was escorting. Other changes were made to the<br />
grouping of purposes, but definitions were generally as in 1978/79. An extra category<br />
was introduced for ‘personal medical business’ to identify trips to receive medical advice<br />
or treatment.<br />
1988 to 2001 continuous survey<br />
New overall trip purpose categories were introduced from 1988. ‘Commuting’ was strictly<br />
home to work and work to home trips. ‘Business’ was defined as trips to ‘in course of<br />
work’ and from ‘in course of work’ to either home or work. ‘Other work’ included all other<br />
trips to work, for example returning to work from a visit to the shops in the lunch break.<br />
The ‘escort’ categories were simplified. The new categories for trip purpose to and trip<br />
purpose from were: escort home, escort work, escort in course of work, escort<br />
education, escort shopping/personal business and other escort. These were then used<br />
to derive the new overall trip purpose categories of escort commuting, escort business<br />
and other work, escort education, escort shopping/personal business and escort home<br />
and other escort.<br />
From 1998 shopping trips were categorised according to whether the main purpose was<br />
food shopping or other shopping.<br />
2002 to <strong>2004</strong> continuous survey<br />
The coding of diary data, which includes trip purpose, was done centrally rather than by<br />
interviewers. This caused discontinuities for some trip purpose data when compared with<br />
earlier surveys.<br />
143
National Centre for Social Research<br />
6.2.3 Round trips<br />
1965<br />
Round trips (starting and finishing at the same point) were split into 2 (both apparently<br />
with the same purpose).<br />
1972/73<br />
Interviewers were asked to leave the next trip space blank when there was a round trip<br />
(in order to prevent confusion). The trip was to be split into 2 at the editing stage.<br />
However, there is some evidence that round trips were treated inconsistently by<br />
interviewers.<br />
1975/76<br />
The definition manual used was less confusing on round trips. Interviewers were<br />
instructed to divide a round trip into 2 trips, outward and homeward. Travel involving a<br />
continuous series of calls made for the same purpose (by a doctor, for example) was<br />
treated as a round trip.<br />
1978/79, 1985/86, 1988 to 2001 continuous survey<br />
As 1975/76, but see section on shopping trips below.<br />
2002 to <strong>2004</strong> continuous survey<br />
As 1988 to 2001.<br />
6.2.4 Shopping trips<br />
1965<br />
Walks in the course of shopping were excluded.<br />
1972/73<br />
Walks in the course of shopping were deleted at the editing stage.<br />
1975/76<br />
Walks and private vehicle trips in the course of shopping in the same shopping centre<br />
were excluded.<br />
1978/79<br />
A round trip for the purpose of shopping was treated as a round trip with the 2 trips being<br />
to and from the last shop. Thus walks or private vehicle trips in the course of shopping<br />
were included. If a mode of transport other than walking was used to get from one group<br />
of shops to another then that mode and the subsequent walking were treated as<br />
separate trips.<br />
1985/86<br />
Trips involving many stops, of which shopping trips are the typical example, were treated<br />
in a new way using the concept of a series of calls. Travel between the first and last<br />
shops was coded as a separate trip, and the preceding trip represented travel only to the<br />
first shop, while the following trip represented travel from the last shop (as before). Thus,<br />
in 1985/86, two trips were counted where, in 1978/79, there was only one. For<br />
144
National Centre for Social Research<br />
consistency, series of calls should be excluded from counts of trips; however, the<br />
distance travelled on such trips should be included in analyses of distance travelled.<br />
Series of calls represented less than 2 per cent of the final sample, a lower proportion<br />
than had been expected. The explanation may be that most travel which could be<br />
treated this way was<br />
walking between shops covering an overall distance of less than 1 mile, so that the<br />
series of calls trips was out of scope on six days out of seven.<br />
1988 to 2001 continuous survey<br />
The definition of series of calls trips was made more restrictive - see I. above.<br />
2002 to <strong>2004</strong> continuous survey<br />
As 1988 to 2001.<br />
6.2.5 Walking jobs<br />
1965<br />
Travel in the course of work by policemen and postmen was specifically excluded.<br />
Where the main paid employment was less than 10 hours a week the travel to work was<br />
recorded as being in course of work.<br />
1972/73<br />
Walks by traffic wardens, policemen, etc. were included under ‘in course of work’.<br />
Driving jobs were excluded.<br />
1975/76<br />
Both walking and driving jobs were excluded.<br />
1978/79, 1985/86, 1988 to 2001and 2002 to <strong>2004</strong> continuous surveys<br />
As 1975/76.<br />
6.2.6 Short walks<br />
1965<br />
Short walks, under one mile, were excluded altogether.<br />
1972/73<br />
On the 7th day short walks were recorded separately, as a separate stage. However<br />
some interviewers ignored very short walks (e.g. to the car) whilst others included them.<br />
1975/76<br />
On the 7th day, a short walk over 50 yards was recorded as a separate stage but only if<br />
it was the final or only stage. In most cases a walk stage was generated during computer<br />
editing when the trip sheet recorded that some minutes had been spent walking prior to<br />
the bus, train, etc. stage. In a large number of cases, it was difficult to allocate the main<br />
mode of the trip, because the length of a short walk was not known (see below).<br />
145
National Centre for Social Research<br />
1978/79<br />
On the 7th day all short walks over 50 yards were recorded as separate stages. Walking<br />
around the shops, as well as to and from the shops, was included (but not around<br />
shopping precincts).<br />
1985/86<br />
As 1978/79, but walking in a precinct that was permanently open as a public<br />
thoroughfare was included.<br />
1988 to 2001 continuous survey<br />
As 1985/86.<br />
2002 to <strong>2004</strong> continuous survey<br />
Short walks under 1 mile, only recorded on Day 7, were under-recorded in 2002 and, to<br />
a lesser extent, in <strong>2003</strong>. Short walks in <strong>2004</strong> appear to be in line with trends up to 2001.<br />
Under-recording of short walks affects the number, average time and length of trips,<br />
especially walking trips, and school trip length.<br />
6.2.7 Length of walk<br />
1965<br />
Respondents’ estimates of distance were used. More long walks would be expected<br />
because of the inclusion of travel off the public highway.<br />
1972/73<br />
Respondents’ estimates of distance were used. ‘No answers’ formed only a small<br />
proportion of responses. There was evidence that respondents tended to overestimate<br />
distances walked.<br />
1975/76<br />
To overcome the 1972/73 problem, distance walked in general, and in particular the<br />
length (in miles) of walks preceding a further stage in the same trip, was estimated by<br />
dividing the respondent’s estimate of time taken (in minutes) by 20. This was obviously<br />
an approximation, possibly an under-estimate on average. Distance comparisons<br />
between 1972/73 and 1975/76 are distorted. A large number of the walks preceding a<br />
car, train, etc. stage had no time estimate. Therefore, a short walk was recorded, but of<br />
unknown length. This had serious implications for the main mode, as shown below.<br />
1978/79<br />
Respondents’ estimates of distance were used, although travelling time was also<br />
recorded. If distance was not given it was estimated at the computer editing stage from<br />
travelling time (where known) divided by 20. More long shopping walks would be<br />
expected because of the inclusion of the distance travelled between shops.<br />
1985/86<br />
As 1978/79, except that missing data were estimated by dividing travel time in minutes<br />
by 25, not 20. Very few records had distance missing.<br />
146
1988 to 2001 continuous survey<br />
As 1985/86.<br />
National Centre for Social Research<br />
2002 to <strong>2004</strong> continuous survey<br />
As mentioned in VI, short walks were under-recorded in 2002 and <strong>2003</strong>. This affects the<br />
average length of walking trips.<br />
6.2.8 Main mode of transport<br />
1965<br />
The main mode of transport was coded as the mode used in the longest (distance)<br />
stage. If 2 stages were the same length the earlier stage mode was used, i.e. the one<br />
with the lower stage number.<br />
1972/73<br />
As 1965<br />
1975/76<br />
The 1965 method was used. However, in a large number of cases, the length of a stage<br />
was not known. As a result, it was not possible to know the longest stage of the trip.<br />
Analysis of these trips has shown that it was mainly two stage car trips and multi-stage<br />
bus trips that were affected. This is because it is these types of trips that were most likely<br />
to include one or more walking stages (see problem with short walks above). For 7th day<br />
data some 15 per cent of trips had no main mode coded. This affected the main modes<br />
(such as bus), which were likely to have been associated with short walk stages, much<br />
more than main modes, such as bicycle, which often did not involve walking. When all<br />
seven days data are used the overall modal split is not seriously affected, although for<br />
comparison with other data the under-recording (of up to 3–4 per cent for certain modes)<br />
can be more of a problem, e.g. for numbers of trips per person. The estimates of length<br />
of trip and counts of mileage were also affected, although it is often possible to<br />
overcome this problem by using stage mode instead of main mode.<br />
1978/79<br />
The main mode of transport was coded as the mode used over the longest (distance)<br />
stage. If 2 stages were the same length then the first or second was selected at random.<br />
Walk stages where both length and time were unknown were ignored and only the other<br />
stages in the trips were used to produce main mode. A secondary mode is also<br />
available, the second longest stage in a multi-stage trip.<br />
1985/86<br />
Similar to 1965; where two or more stages had equal length, the mode of the latest<br />
stage was taken. If any stage length was missing, main mode was not coded until<br />
‘patching’.<br />
1988 to 2001 and 2002 to <strong>2004</strong> continuous survey<br />
As 1985/86.<br />
147
National Centre for Social Research<br />
6.2.9 Mode of transport<br />
Some bus services were shown separately in earlier National Travel Surveys.<br />
Works/school bus trips on the 1975/76 NTS were treated as other public transport. A<br />
revised grouping has been produced which includes these trips as other private<br />
transport, the classification used on all other National Travel Surveys.<br />
Public tour/excursion bus stages were included with public express bus stages in<br />
1975/76, and not identified separately.<br />
2002 to <strong>2004</strong> continuous survey<br />
The coding of diary data, which includes stage mode, was done centrally rather than by<br />
interviewers. This causes discontinuities for some mode data when compared with<br />
earlier surveys.<br />
6.2.10 Trip start time and travelling time<br />
1965<br />
Information on trip start time and travel time was not collected.<br />
1972/73<br />
On the 7th day information was collected on the trip start time, overall trip time and stage<br />
travelling time for each stage, excluding waiting.<br />
1975/76<br />
Trip start time was collected throughout the travel week. On the 7th day total trip time<br />
and travelling time for each stage (excluding waiting) were collected.<br />
1978/79<br />
Trip start time, total duration time and travelling time for each stage were collected<br />
throughout the travel week.<br />
1985/86,1988 to 2001 and 2002 to <strong>2004</strong> continuous surveys<br />
As 1978/79.<br />
6.2.11 Treatment of part miles<br />
1965<br />
Distances were recorded to the nearest half mile for distances of less than 5 miles and to<br />
the nearest mile for distances of 5 miles or more.<br />
1972/73<br />
Distances were allowed down to quarter miles but edited into tenths of a mile. A quarter<br />
of a mile was recorded as 2 tenths, three quarters as 8 tenths.<br />
148
National Centre for Social Research<br />
1975/76<br />
Distances were allowed down to quarter miles but edited into tenths of a mile. A quarter<br />
mile was recorded as 3 tenths, three quarters as 8 tenths. Distances of 4, 6 or 7 tenths<br />
were not allowed.<br />
1978/79<br />
Distances were coded as tenths of miles. Where respondents quoted a quarter of a mile<br />
this was coded as 2 tenths, three quarters of a mile being coded as 8 tenths.<br />
1985/86, 1988 to 2001 and 2002 to <strong>2004</strong> continuous surveys<br />
As 1978/79.<br />
6.2.12 Type of area<br />
1965<br />
In the absence of the 1966 de facto urban area analysis, a more subjective estimate for<br />
type of area was used. It was based partly on the classification of district councils into<br />
urban and rural, partly on the advice of planners and partly on density of population data<br />
from the 1961 Census. For these reasons it is not comparable with the other surveys.<br />
1972/73<br />
Local authorities were, in general, coded to the largest type of area containing any part<br />
of the local authority, based mainly upon an unpublished analysis of the 1966 Census:<br />
‘De Facto Urban Areas in England and Wales, 1966’. This makes the sample appear<br />
biased in favour of the larger type of area. As a result it is not comparable with the other<br />
surveys. It should be noted that the 235 areas with populations under 3,000 considered<br />
to be ‘urban’ in the original ‘De Facto’ exercise have been counted as ‘rural’ in all NTS<br />
analyses.<br />
1975/76<br />
The 1966 de facto urban area analysis was used but at ward level rather than local<br />
authority level, thus eliminating the 1972/73 bias. The 1966 classification of areas may<br />
have become out of date due to shifts of population from densely populated to less<br />
populated areas.<br />
1978/79<br />
The 1966 de facto urban area analysis was used to classify each 1978/79 ward. In a<br />
number of cases it was possible to identify the 1978/79 ward with a pre- 1974 local<br />
authority area and hence to find the appropriate classification. In other cases the<br />
centroid of the 1978/79 ward was calculated and then located on a map of the 1966 de<br />
facto urban areas to find the appropriate classification. The 1978/79 and 1975/76<br />
methods used were sufficiently similar for the results to be regarded as comparable.<br />
1985/86<br />
A new classification was derived using the urban areas defined for England and Wales<br />
for the analysis of the 1981 Census (OPCS, 1984), and localities in Scotland defined by<br />
the Scottish Office (GRO(S), 1984). Postcode sectors were classified according to the<br />
149
National Centre for Social Research<br />
nature of the dominant type of area represented in the sector. Urban areas with a<br />
population below 3,000 were regarded as rural.<br />
1988 to 2001 continuous survey<br />
As 1985/86 for years up to 1992. Data for 1993 to 2001 use a classification which<br />
reflects built-up areas and population at the time of the 1991 Census.<br />
2002 to <strong>2004</strong> continuous survey<br />
Data for 2002 to <strong>2004</strong> use a classification which reflects built-up areas and population at<br />
the time of the 2001 Census.<br />
6.2.13 Population density<br />
1965<br />
Based on the 1961 Census, this variable was the population density of the ward or group<br />
of parishes in which the household was sampled.<br />
1972/73<br />
Population density was based on the preliminary report from the 1971 Census, and<br />
acreage from the 1966 Census county reports. This variable was the population density<br />
of the local authority in which the household was sampled.<br />
1975/76<br />
Based on the 1971 Census, both the population densities of the ward and the local<br />
authority in which the household was sampled were estimated. The data were given in<br />
persons per hectare rather than per acre, but the grouping was made to correspond<br />
closely to that used in other surveys.<br />
1978/79<br />
Ward density could not be calculated for the wards used in 1978/79 as they were often<br />
very different from those used for the 1971 Census. Therefore the method used was to<br />
draw a circle around the centroid of the ward sample and accumulate 1971 Census data<br />
for all 1971 enumeration districts whose centroids fell within the circle. Each ward was<br />
then classified according to the data accumulated. The 1978/79 analysis is not<br />
comparable with the other surveys.<br />
1985/86<br />
The population density figures, for local authorities and for the postal sectors comprising<br />
the primary sampling units, were taken from the ONS sampling frame, which was based<br />
on the Postcode Address File. Population figures were from the 1981 Census.<br />
1988 to 2001 continuous survey<br />
As 1985/86 for years up to 1992. Data for 1993 to 2001 use a classification which<br />
reflects population at the time of the 1991 Census.<br />
2002 to <strong>2004</strong> continuous survey<br />
Data for 2002 to <strong>2004</strong> use a classification which reflects population at the time of the<br />
1991 Census.<br />
150
National Centre for Social Research<br />
6.2.14 Household income<br />
1965<br />
Of responding households, 21 per cent failed to supply full information on the income<br />
question.<br />
1972/73<br />
Of responding households 16 per cent failed to give information on income. However,<br />
there were a further 334 households with zero income, of which 332 were miscoded. In<br />
practice it is reasonable to assume that most of these 332 households belonged to the<br />
lowest income band.<br />
1975/76<br />
Of responding households 31 per cent refused to give their income, and a further 36<br />
households said they had zero income. In order to overcome this high refusal rate a<br />
procedure for estimating the household income of the non-respondents was devised.<br />
This was based on the number of employed members, the income of the head of<br />
household, the socio-economic group of the head of household, and the number of cars<br />
in the household.<br />
1978/79<br />
A question on actual income was asked of each individual and only if this was refused<br />
was the question attempted in terms of bands of income. Of responding households, 31<br />
per cent gave full information, 35 per cent partial or banded income from which an<br />
estimate was possible, and 34 per cent gave insufficient income information to enable<br />
household income to be estimated directly. A similar technique to that used in 1975/76<br />
was used to estimate the household income of the 34 per cent using: the number of<br />
fulltime employed members, the number of cars in the household, the working status of<br />
the head of the household, and household structure.<br />
1985/86<br />
Income was requested only as a banded estimate. A figure was obtained for 85 per cent<br />
of the fully responding households in the database. Missing information was estimated in<br />
a similar fashion to the previous two surveys.<br />
1988 to 2001 and 2002 to <strong>2004</strong> continuous survey<br />
As 1985/86.<br />
6.2.15 Walking time to various facilities<br />
1965<br />
Walking time to the bus stop or railway station was based on the respondent’s estimate<br />
of how long it would take them (the respondent) to walk there. It was asked of all<br />
persons.<br />
1972/73<br />
As 1965.<br />
151
National Centre for Social Research<br />
1975/76<br />
Walking time to various facilities was based on the respondent’s estimate of how long it<br />
would take the interviewer to walk there.<br />
1978/79, 1985/86, 1988 to 2001 continuous survey<br />
As 1975/76.<br />
2002 to <strong>2004</strong> continuous survey<br />
Walking time to various facilities was based on the respondent’s estimate of how long it<br />
would take them to walk there. If however, the interviewer noticed that the respondent<br />
had difficulties walking, they asked the respondent to estimate how long it would take the<br />
interviewer to walk there.<br />
6.2.16 Miscellaneous differences<br />
1965<br />
Business expenses for motoring were not collected.<br />
1975/76<br />
Information on the value of the car was not collected. A system of identifying duplicated<br />
trips was used in order to save interviewer (and respondents’) time. This was further<br />
developed in 1978/79 and in 1985/86.<br />
1978/79<br />
Travel of children under 3 was included for the first time.<br />
1985/86<br />
New questions were asked about the use of particular modes of travel, health-related<br />
travel difficulties, fuel put into household vehicles, and the number of boardings during<br />
the use of a single ticket on a particular trip. A number of questions including make and<br />
model of car, value of car and a split of annual vehicle mileage into business, commuting<br />
and other were dropped. The vehicle database and that of later NTSs was split into two<br />
during 1994. Those cars believed to have been available to the household at the start of<br />
the travel week were designated primary vehicles, the rest were deemed secondary<br />
vehicles. Information about primary vehicles is now used for all standard analyses of<br />
vehicles, as these represent a point estimate of the vehicle stock. Information on the<br />
other vehicles is only used for analyses of journey stages by household vehicles during<br />
the travel week.<br />
1988<br />
From July 1988 a fuel and mileage chart was placed in the vehicle at the beginning of<br />
the travel week. This led to an increase in the accuracy of NTS estimates of vehicle<br />
mileage, making it more comparable with estimates from other sources.<br />
1992<br />
From January 1992, some additions to the questionnaire were made. The origins and<br />
destinations of trips were collected, and also the make and model of cars and vans.<br />
Summary details of ‘long distance’ trips of 50 miles or more in the three weeks preceding<br />
the travel diary week were added to improve the coverage of these important but less<br />
152
National Centre for Social Research<br />
common trips. A number of other minor changes were made, including the dropping of<br />
questions about the time taken to reach various local services and amenities. The<br />
income bands used were also updated in 1992.<br />
In January 1992 some changes to the placing pattern of interviews were introduced.<br />
After a transitional quota period in the first half of January 1992, all interviewer quotas<br />
from this point on ran from midmonth to mid-month. This has improved the coverage of<br />
bank holiday travel.<br />
1993<br />
From mid-January 1993, the set sample size of Inner London Boroughs was increased<br />
from 12 to 15 interviewer quotas per year, whilst that for Outer London boroughs was<br />
increased from 18 to 20. A compensating reduction of 5 quotas outside London was<br />
introduced at the same time so that there was no overall change in the set sample size.<br />
The change was introduced to address the perennial problem of the underrepresentation<br />
of London residents in the achieved sample, due to lower response rates<br />
and other factors. In 1993, opinion questions on bus services and a question on the split<br />
of annual vehicle mileage between commuting, business and other private were<br />
introduced. More details of the changes in 1992 and 1993 can be found in Appendix A of<br />
the 1991/93 report.<br />
1994<br />
In October 1994 Computer Assisted Personal Interviewing (CAPI) was introduced.<br />
1995<br />
In 1995, a number of changes were made to the questionnaire. Questions on disability<br />
and travel difficulties were restricted to those aged 16 and over, and new questions were<br />
introduced for disabled drivers. New questions on parking facilities at home were<br />
introduced. The industry grouping and income bands used were also updated in 1995.<br />
1998<br />
From January 1998, a large number of harmonised questions were introduced onto the<br />
questionnaire, mostly as replacements for existing questions or question blocks. A full<br />
list of the harmonised questions introduced can be found in Chapter 3 of this report. In<br />
January 1998, several other questions were also added. These were the questions on<br />
the time taken to reach various local services and amenities, which had been dropped in<br />
January 1992.<br />
1999<br />
In 1999, the placing pattern for diaries was altered, in order to allow more chance for a<br />
full response, by giving interviewers more time to contact households within the quota<br />
month. Firstly, in May, diary start dates were allocated on a first-come, first-served basis,<br />
but within the restriction of interviewers having to contact the households in a predetermined<br />
(random) order. This was altered again in September, from when<br />
interviewers were allowed to contact households in any order. Also in 1999, two further<br />
harmonised questions were added, covering marital status and living arrangements.<br />
153
National Centre for Social Research<br />
2000<br />
In 2000, there were some significant alterations to the sample of the NTS, intended to<br />
halt the continued decline in the achieved sample resulting from increasing nonresponse.<br />
The size of each PSU was increased from 21 to 23 addresses. Furthermore,<br />
the total number of PSUs was increased from 240 to 252, giving a new total of 5,796<br />
addresses in the starting sample, compared with the old total of 5,040. A<br />
disproportionate number of the additional PSUs were placed in London, to compensate<br />
for the even worse response problems in this area. Several additional harmonised<br />
questions were included from January 2000 (see chapter 3). New questions on cycling<br />
were also added during 2000.<br />
2001<br />
New questions on the reliability and frequency of local bus and rail services and<br />
harmonised questions on ethnicity, supervising employees and supervision<br />
responsibilities (see chapter 3) were introduced.<br />
6.3 2002 Survey Year<br />
From January 2002 the NTS contractor changed from the ONS to the National Centre for<br />
Social Research (NatCen). Several changes were made to the survey some of which<br />
were a result of the National Statistics Quality Assurance Review (see chapter 9).<br />
In 2002 there was a considerable fall in the fully co-operating response rate from 65 per<br />
cent to 54 per cent, which is common when a new contractor takes over a survey.<br />
The sample<br />
In 2002 the sample size was increased to 15,048 addresses from 5,796 in 2001. The<br />
PSUs were increased from 252 to 684 and the size of PSU's was changed from 23<br />
addresses to 22. This enabled DfT to look at travel data from one year rather than<br />
having to combine two years data. The NTS also introduced a quasi panel design in<br />
2002 whereby half the PSUs selected in any year are retained and the other half are<br />
replaced (see section 2.8 and 2.9 of the 2002 technical report). This was introduced to<br />
reduce variability from year to year as a result of changes in areas surveyed.<br />
Stratification variables for the NTS sample changed in 2002. The region stratifier used in<br />
2001 was based on Government Office Regions (GOR) split into metropolitan and nonmetropolitan<br />
areas. The region stratifier used in 2002 was based on NUTS2 and was<br />
chosen to correspond with GORs but has a finer breakdown of areas (see section 2.2 of<br />
the 2002 technical report). In particular the 2001 region stratifier split London into two<br />
groups (Inner and Outer London) whereas the 2002 region stratifier based on the<br />
NUTS2 separates London into five areas.<br />
In addition to the new region startifier, the 2002 NTS sample was also stratified by<br />
population density (people per hectare) instead of the proportion of heads of households<br />
in socio-economic groups 1 to 5 and 13 (that is a professional employer or manager)<br />
which had been used in 2001 (see section 2.8. of the 2002 technical report). The use of<br />
the stratifier proportion of households with no car was continued.<br />
154
National Centre for Social Research<br />
In 2002 London was oversampled, as in 2001, in order to compensate for lower<br />
response rates in London, although the degree of oversampling was slightly different<br />
(see section 2.9 of the 2002 technical report).<br />
The proportion of deeply rural households in the rural sample fluctuates from year to<br />
year. This proportion was relatively high in 2002 compared with earlier years. This will<br />
affect comparison of car ownership figures for rural areas, and the bus availability<br />
indicator, and may affect trip lengths and times for the country as a whole.<br />
New questions<br />
In 2002 rotated modules of questions were introduced into the survey, with some<br />
questions relating to the rating of local public transport services and vehicle use<br />
(amongst others) being rotated between even and odd years of the survey. See section<br />
3.7.1 in the 2002 <strong>Technical</strong> report.<br />
In 2002 several Individual level questions were added or revised:<br />
• New questions on walking over 20 minutes were introduced owing to an interest in<br />
the health benefits of walking. These questions include all walks, unlike the travel<br />
record which excludes walks not on the public highway.<br />
• Questions on transport barriers to employment were asked of the unemployed to<br />
establish if there were any transport issues which affected their employment<br />
prospects.<br />
• Employees were asked whether their employer offered any transport related benefits<br />
firstly, to all employees at their workplace and secondly the respondent.<br />
Respondents were also asked whether they used the transport related benefits<br />
offered to them.<br />
• Questions on home working were expanded owing to an interest in any reduction in<br />
travel congestion that might result from people working at home rather than travelling<br />
to work. If respondents did not work from home they were asked whether it was<br />
possible to do their type of work at home.<br />
• Respondents were asked whether they had any difficulties travelling to work,<br />
shopping or other activities, and if so, what these difficulties were.<br />
• The question set regarding travel difficulties related to disabilities was revised.<br />
• Respondents were asked whether any household vehicles remained unused at<br />
home when they were at work.<br />
Household level questions:<br />
• A new question was introduced to ask respondents why they had moved house. This<br />
assesses whether any recent move was influenced by transport considerations.<br />
155
National Centre for Social Research<br />
• A new question on methods of shopping asked whether respondents ordered any<br />
shopping by post, phone or the internet because of the effect changes in these<br />
methods may have on traffic levels.<br />
• Respondents were asked whether they did the main food shopping for their<br />
household. If so, they were asked about difficulties with travel for food shopping<br />
during the individual questionnaire.<br />
• Questions on children’s travel to and from school, and about crossing roads were<br />
also asked where the household had children aged 7-13. These questions were<br />
introduced in order to look at children’s independence.<br />
• Harmonised questions on ownership of accommodation and on joint ownership of<br />
accommodation were introduced.<br />
Vehicle level questions:<br />
• For the first time in 2002, respondents were asked to give the registration number of<br />
all household vehicles. The reason for this is that the more technical information<br />
about the vehicle (for example, type of fuel used and taxation class) can be obtained<br />
through the DVLA database of vehicles, rather than asking respondents directly. It<br />
was felt that information gained in this way would be more accurate, and it also<br />
meant that the interview could be slightly shorter as these questions did not then<br />
need to be asked. Respondents were asked for their permission to use their<br />
registration number to consult the DVLA database. If they refused, their registration<br />
number was removed from the questionnaire. If the respondent refused to give the<br />
registration number, then questions were asked directly as in previous years.<br />
• Questions were added about the use of vehicles for making deliveries.<br />
• Questions were added about the use of vehicles for travel outside of Great Britain.<br />
Other changes in 2002<br />
Centralised coding of diary data was introduced instead of coding by interviewers.<br />
The level of detail for the origin and destination of journeys on day 7 of the travel week<br />
was increased to allow geocoding of NTS data. On day 7 respondents were asked to<br />
record the full address (including the postcode if they knew it) of their journey origin and<br />
destination. Prior to 2002, respondents had only been required to record the name of the<br />
town or village.<br />
Children were asked to record in their travel diary any time they spent playing on the<br />
street on day 7 of the travel week.<br />
Distance and area checks for journeys were introduced into the diary coding and editing<br />
process.<br />
156
National Centre for Social Research<br />
The survey year changed to relate to mid-January to mid-January, whereas data for<br />
previous years related to the calendar year 1 January - 31 December.<br />
A non-response form was introduced with a view to informing the development of a<br />
weighting strategy for the NTS.<br />
6.4 <strong>2003</strong> Survey Year<br />
Following an investigation into the use of conditional incentives in late 2002, £5 vouchers<br />
were given to all household members in households classified as fully co-operating. This<br />
measure was introduced in order to increase response rates, especially amongst large<br />
families. The incentive had the effect of converting partially responding households to<br />
fully cooperating households.<br />
Details of any congestion charges paid by drivers were collected in the travel diary.<br />
6.5 <strong>2004</strong> Survey Year<br />
In mid <strong>2004</strong>, an unconditional incentive of postage stamps was introduced in order to<br />
encourage respondents to take part in the survey. A book of six first-class stamps was<br />
included with the advance letter to each household. The incentive converted some<br />
refusals to fully cooperating.<br />
New questions on the planning of journeys by both private and public transport was<br />
introduced in <strong>2004</strong>. These questions are intended to collect data about the use of<br />
Transport Direct. A question on satisfaction with local bus services, which was dropped<br />
in 2001, was reinstated in <strong>2004</strong>. A harmonised question on how long someone had been<br />
looking for a job if they were currently out of work was added. An open question was<br />
also added at the end of the placement interview to give the interviewer the opportunity<br />
to record any general comments about travel that the respondent wanted to make.<br />
Weighting the NTS<br />
Work is being carried out by DfT to weight NTS data to address non-response, sampling<br />
variations and other factors. It is intended that trend data up to <strong>2004</strong> will be published in<br />
Spring 2006.<br />
157
National Centre for Social Research<br />
158
National Centre for Social Research<br />
7 COMPARISON OF NTS DATA WITH OTHER SOURCES<br />
This chapter compares NTS data with several other sources. The topics covered are<br />
demographic characteristics, stock and mileage of cars, household car availability, travel<br />
to work, bicycle mileage, bus boardings, van mileage and driving licence holding.<br />
Commentary is given to highlight and explain some of the differences between the NTS<br />
and other sources.<br />
7.1 Age and sex of NTS respondents<br />
This section compares the NTS sample with ONS population estimates.<br />
The NTS is a household survey, so the NTS sample represents the population of people<br />
within households in Great Britain. This should be taken into consideration when<br />
comparisons are made with resident population estimates. The resident population<br />
includes people in communal and institutional establishments, for example, care homes<br />
and student halls of residence. These are excluded from the NTS sample. Tables 7.1,<br />
7.2 and 7.3 compare the NTS sample with the resident population of GB. The ONS<br />
have produced experimental household population estimates for England and Wales in<br />
2002 and <strong>2003</strong>. Tables 7.4 and 7.5 compares the NTS sample with the household<br />
population.<br />
Compared with GB resident population estimates, in 2002 to <strong>2004</strong>, the NTS underrepresented<br />
males overall and all people between the ages of 16 and 29 (Tables 7.1, 7.2<br />
and 7.3). Children and the elderly were over represented. The under representation of<br />
young men particularly affects data on travel by bicycle and motorcycles, which are used<br />
more frequently by young men. Figure 7.1 shows the percentage under representation<br />
for people in their twenties since 1989. Over this period men are consistently under<br />
represented more than women. In the last five years the male under representation has<br />
fallen, whilst for women the under representation has been more stable.<br />
Since the introduction of incentives to all households from <strong>2003</strong> (see Simmonds et al,<br />
<strong>2003</strong>), larger families have become more likely to take part in the survey. This shows up<br />
clearly in the increase in the over-representation of children up to 15. At the other end of<br />
the age scale, there is now less over-representation by older people.<br />
It is intended that NTS data will be weighted for non-response bias from 2006. The<br />
weighting method will adjust the NTS sample to represent the distribution of resident<br />
population by age, sex and GOR. The weighting method will use household population<br />
figures instead, should estimates become available for the last decade.<br />
159
National Centre for Social Research<br />
Table 7-1 Comparison of the distribution of age and sex of NTS respondents with<br />
the mid-year population estimates for 2002<br />
NTS Sample 2002 Population estimate<br />
Percentage<br />
NTS Percentage over-<br />
2002<br />
representation<br />
Male Female Male Female Male Female<br />
0-4 3.0 2.8 2.9 2.8 1 2<br />
5-10 4.0 3.9 3.8 3.7 5 6<br />
11-15 3.3 3.2 3.4 3.2 -3 1<br />
16-20 2.5 2.5 3.2 3.0 -22 -17<br />
21-25 2.1 2.4 3.0 3.0 -32 -20<br />
26-29 2.1 2.4 2.6 2.6 -19 -6<br />
30-39 7.1 7.6 7.7 7.8 -8 -4<br />
40-49 6.5 7.2 6.8 6.9 -4 5<br />
50-59 6.8 7.0 6.3 6.4 8 9<br />
60-69 5.3 5.8 4.5 4.8 18 20<br />
70+ 5.3 7.2 4.6 6.9 15 4<br />
All ages 47.9 52.1 48.8 51.2 -2 2<br />
Table 7-2 Comparison of the distribution of age and sex of NTS respondents with<br />
the mid-year population estimates for <strong>2003</strong><br />
NTS Sample <strong>2003</strong> Population estimate<br />
Percentage<br />
NTS Percentage over-<br />
<strong>2003</strong><br />
representation<br />
Male Female Male Female Male Female<br />
0-4 3.3 3.0 2.9 2.8 12 10<br />
5-10 4.1 3.9 3.8 3.6 10 9<br />
11-15 3.5 3.6 3.4 3.2 4 13<br />
16-20 2.7 2.7 3.3 3.1 -18 -13<br />
21-25 2.2 2.6 3.1 3.1 -28 -16<br />
26-29 2.2 2.3 2.5 2.5 -11 -8<br />
30-39 6.7 7.9 7.6 7.7 -11 3<br />
40-49 6.9 7.1 6.9 7.0 - 2<br />
50-59 6.2 6.5 6.3 6.4 -2 2<br />
60-69 5.0 5.4 4.6 4.9 10 12<br />
70+ 5.3 6.8 4.7 6.9 13 -2<br />
All ages 48.1 51.9 48.9 51.1 -2 2<br />
160
National Centre for Social Research<br />
Table 7-3 Comparison of the distribution of age and sex of NTS respondents with<br />
the mid-year population estimates for <strong>2004</strong><br />
NTS Sample <strong>2004</strong> Population estimate<br />
Percentage<br />
NTS Percentage over-<br />
<strong>2004</strong><br />
representation<br />
Male Female Male Female Male Female<br />
0-4 3 3 3 3 8 10<br />
5-10 4 4 4 4 6 19<br />
11-15 4 3 3 3 15 4<br />
16-20 3 3 3 3 -23 -13<br />
21-25 3 3 3 3 -15 -18<br />
26-29 2 2 2 2 -22 -8<br />
30-39 7 7 7 8 -11 -3<br />
40-49 7 7 7 7 -5 2<br />
50-59 6 7 6 6 -1 5<br />
60-69 5 6 5 5 11 14<br />
70+ 5 7 5 7 10 -2<br />
All ages 48 52 49 51 -2 1<br />
Figure 7-1 Under representation of 21-29 olds in the NTS sample compared with ONS<br />
population estimates: 1989 to <strong>2004</strong><br />
Percent<br />
35<br />
30<br />
25<br />
20<br />
15<br />
10<br />
5<br />
0<br />
-5<br />
161<br />
Males<br />
Females<br />
1989 1990 1991 1992 1993 1994 1995 1996 1997 1998 1999 2000 2001 2002 <strong>2003</strong> <strong>2004</strong><br />
Males 17 18 16 20 21 17 20 19 20 17 25 30 25 26 20 18<br />
Females 5 9 7 6 10 2 11 15 8 -2 17 15 19 14 12 14
National Centre for Social Research<br />
The differences between the NTS sample and household population displayed in Tables<br />
7.4 and 7.5 are relatively similar to those between the sample and the resident<br />
population. However, when comparing the sample with the household population the<br />
main difference is the slightly greater over representation of women over 70. This is due<br />
to the high response among older women and the large proportion of older women who<br />
are residents in care homes.<br />
Table 7-4 Comparison of the distribution of age and sex of NTS respondents with<br />
the mid-year household 1 population estimates (experimental): England & Wales 2002<br />
Percentage<br />
NTS Sample 2002 Household population NTS Percentage over-<br />
estimate 2002<br />
representation<br />
Male Female Male Female Male Female<br />
0-17 11.6 11.0 11.6 11.1 - -1<br />
18-49 19.0 20.8 21.9 22.2 -13 -6<br />
50-59 6.8 7.0 6.4 6.5 7 8<br />
60-69 5.4 5.8 4.6 4.8 18 20<br />
70+ 5.4 7.3 4.6 6.5 18 12<br />
All 48.1 51.9 48.9 51.1 -2 2<br />
1 The estimated household population of an area includes only those residents living in private households,<br />
and excludes the residents of communal/ institutional establishments.<br />
Table 7-5 Comparison of the distribution of age and sex of NTS respondents with<br />
the mid-year household 1 population estimates (experimental): England & Wales <strong>2003</strong><br />
Percentage<br />
NTS Sample <strong>2003</strong> Household population NTS Percentage over-<br />
estimate <strong>2003</strong><br />
representation<br />
Male Female Male Female Male Female<br />
0-17 12.2 11.8 11.5 11.0 6 8<br />
18-49 19.5 21.4 21.9 22.2 -11 -3<br />
50-59 6.2 6.5 6.4 6.5 -2 -<br />
60-69 4.9 5.3 4.6 4.9 7 9<br />
70+ 5.3 6.8 4.6 6.5 14 6<br />
All 48.1 51.9 49.0 51.0 -2 2<br />
1 The estimated household population of an area includes only those residents living in private households,<br />
and excludes the residents of communal/ institutional establishments.<br />
162
National Centre for Social Research<br />
7.2 Region of residence of NTS respondents<br />
Table 7.6 gives details of response for the Government Office Regions of England, and<br />
for Scotland and Wales. London households are over sampled to compensate for the<br />
known lower response rate in London, although, London was still under represented in<br />
2002 to <strong>2004</strong>. As stated in the previous section weighting the NTS will ensure<br />
consistency in the NTS sample with population distributions by GOR.<br />
Table 7-6 Comparison of the region of residents of NTS respondents with the midyear<br />
population estimates, 2002 to <strong>2004</strong><br />
NTS Sample Population estimate<br />
Percentage<br />
NTS Percentage overrepresentation<br />
2002 <strong>2003</strong> <strong>2004</strong> 2002 <strong>2003</strong> <strong>2004</strong> 2002 <strong>2003</strong> <strong>2004</strong><br />
North East 4.8 4.3 4.9 4.4 4.4 4.4 9 -1 12<br />
North West 12.2 11.7 11.6 11.8 11.8 11.7 3 -1 -1<br />
Yorkshire and<br />
8.6 8.8 8.8 8.7 8.7 8.7 - 2 1<br />
the Humber<br />
East Midlands 8.0 7.1 7.3 7.3 7.4 7.4 9 -3 -1<br />
West Midlands 8.7 9.4 9.3 9.2 9.2 9.2 -6 2 1<br />
Eastern 9.4 9.6 9.8 9.4 9.4 9.4 - 1 4<br />
London 10.9 12.2 11.8 12.8 12.8 12.8 -15 -4 -8<br />
ow: Inner<br />
London<br />
4.3 4.7 4.5 5.0 5.0 5.0 -14 -7 -10<br />
Outer London 6.6 7.5 7.3 7.8 7.7 7.7 -15 -3 -6<br />
South East 13.0 13.7 13.0 14.0 14.0 14.0 -7 -2 -6<br />
South West 9.6 9.0 9.5 8.6 8.6 8.7 11 4 9<br />
Wales 5.5 5.0 4.5 5.1 5.1 5.1 9 -2 -11<br />
Scotland 9.4 9.3 9.6 8.8 8.7 8.7 7 7 10<br />
Great Britain 100 100 100 100 100 100<br />
7.3 Vehicle stock of household 4-wheeled cars<br />
Figure 7.2 gives estimates of vehicle stock from the NTS, compared with data from the<br />
Driver and Vehicle Licensing Agency (DVLA). The NTS estimate of vehicle stock has<br />
been consistently lower than the DVLA estimate, though has broadly followed the same<br />
trend.<br />
The DVLA estimate of stock is derived as shown in Table 7.7. Prior to 2002 the stock<br />
evading taxation was estimated to be just under 4 percent of known stock. In 2002 and<br />
<strong>2004</strong>, surveys of tax evasion were carried out and results from these surveys were used<br />
to estimate the stock of cars evading taxation.<br />
163
National Centre for Social Research<br />
Figure 7-2 Average stock of household 4-wheeled cars: 1992 to <strong>2004</strong><br />
30<br />
Millions<br />
25<br />
20<br />
15<br />
10<br />
164<br />
DVLA<br />
NTS<br />
1992 1993 1994 1995 1996 1997 1998 1999 2000 2001 2002 <strong>2003</strong> <strong>2004</strong><br />
DVLA 21.0 21.3 21.7 21.9 22.8 23.4 23.8 24.5 25.0 24.7 25.7 26.0 26.9<br />
NTS 20.4 20.3 20.3 21.5 21.7 22.1 23.0 23.4 24.1 23.3 24.3 24.7 24.5<br />
7.4 Car mileage estimates<br />
The NTS provides three estimates of annual vehicle mileage - from travel in the Travel<br />
Week recorded in the travel record, by taking odometer readings, and from the main<br />
driver’s estimate of the annual mileage. Table 7.7 describes the calculation which<br />
compares NTS figures with that obtained from estimates of traffic derived from the Road<br />
Traffic Census (RTC) and estimates of vehicle stock from the DVLA. Table 7.8 and<br />
Figure 7.3 give comparisons for individual years of the continuous NTS and earlier ad<br />
hoc surveys.<br />
The driver’s annual estimate is confirmed as the best measure of car mileage from the<br />
NTS. These estimates were in close agreement with those derived from the DVLA and<br />
RTC data since the 1985/1986 survey, whereas the weekly milometer readings have<br />
been over 10 percent lower in recent years. The deficiency of the weekly milometer<br />
readings is thought to be mainly the result of the difficulty in placing travel diaries with<br />
people during periods when they are most active, such as Bank Holidays.<br />
Table 7.8 also shows annual figures derived from grossing data recorded for individual<br />
stages in travel diaries. These are lower than the driver's estimate, as ineligible mileage<br />
is excluded, and there is likely to be under recording of trips.<br />
Figure 7.3 shows a trend of declining average annual mileage since the early nineties for<br />
all sources except the NTS travel record. The decline is due to the increase in second<br />
cars which do less mileage. It is feasible that the average annual mileage from the NTS<br />
travel record has been more static since second cars do a larger proportion of eligible<br />
NTS mileage.
National Centre for Social Research<br />
Table 7-7 Comparison of NTS car mileage estimates with other sources: 2002 to<br />
<strong>2004</strong><br />
2002 <strong>2003</strong> <strong>2004</strong><br />
VEHICLE MILES (billions)<br />
RTC estimated traffic of cars and taxis, GB 244.2 244.3 247.4<br />
(=392.9 bn (=392.0 bn (=398.1 bn<br />
less traffic of:<br />
km.) km.) km.)<br />
non-household cars 1<br />
15.6 14.9 14.1<br />
vehicles other than car body types 1<br />
4.2 4.2 4.2<br />
foreign cars, from IPS 2 2001 1.8 1.8 1.8<br />
Total GB public highway mileage of household cars 222.7 223.3 227.3<br />
Overseas trips using GB cars, from IPS 2 2001 & <strong>2003</strong><br />
(thousand trips)<br />
6,453 6,256 6,256<br />
Foreign mileage per trip, from IPS 2 2001 (vehicle miles) 620 620 620<br />
Total foreign mileage, from IPS 2 2001 4.0 3.9 3.9<br />
Total mileage in GB off public highways 0.3 0.3 0.3<br />
A. Total mileage of household 4-wheeled cars 227.0 227.5 231.4<br />
VEHICLE STOCK (thousands)<br />
DVLA stock of licensed Private & Light Goods: Cars 24,543 24,985 25,754<br />
plus cars exempt from licence fees, from DVLA<br />
stock data<br />
1,159 1,177 1,196<br />
plus cars evading taxation, from 2002 and <strong>2004</strong><br />
evasion surveys<br />
1,080 912 912<br />
less non household cars, e.g. rental cars 1,114 1,067 1,009<br />
B. Stock of household cars 25,668 26,006 26,852<br />
ANNUAL AVERAGE MILEAGE PER HOUSEHOLD CAR<br />
Using RTC, IPS and DVLA stock index [A/B] (miles) 8,840 8,750 8,620<br />
Using NTS data:<br />
Annual mileage per care, from drivers' estimates of<br />
annual mileage<br />
9,000 9,100 9,020<br />
Average annual mileage per car, from weekly<br />
milometer readings<br />
7,850 7,820 7,750<br />
1<br />
Traffic of non-household cars (which includes rental cars) and vehicles other than car body types (which<br />
includes taxi & minicabs) are derived from vehicle stock figures and assumed annual average of 14 and 26<br />
thousand miles respectively.<br />
2<br />
International Passenger Survey<br />
165
National Centre for Social Research<br />
Table 7-8 Comparison of NTS car mileage figures with traffic census-based figures<br />
for household cars<br />
Miles<br />
Traffic census<br />
and DVLA<br />
stock figures 1<br />
166<br />
NTS drivers<br />
annual<br />
estimates<br />
NTS weekly<br />
milometer<br />
readings<br />
NTS driver<br />
stages from<br />
diary<br />
April 1972 - March 1973 9,240 9,590 8,310 7,930<br />
July 1975 - June 1976 8,330 9,210 7,960 7,540<br />
May 1978 - May 1979 8,490 9,090 8,210 7,540<br />
July 1985 - June 1986 8,970 8,900 7,650 7,400<br />
Calendar years:<br />
1989 10,000 9,630 8,220 8,040<br />
1990 9,790 9,860 8,350 8,100<br />
1991 9,610 9,410 8,370 7,930<br />
1992 9,380 9,550 8,590 8,010<br />
1993 9,410 9,620 8,510 8,130<br />
1994 9,400 9,580 8,430 8,070<br />
1995 9,600 9,610 8,520 8,260<br />
1996 9,600 9,460 8,600 8,490<br />
1997 9,400 9,180 8,370 8,260<br />
1998 9,440 9,500 8,170 8,340<br />
1999 9,190 9,300 8,200 8,040<br />
2000 9,010 9,400 8,050 8,060<br />
2001 8,820 8,780 7,900 8,420<br />
2002 8,840 9,000 7,850 8,110<br />
<strong>2003</strong> 8,750 9,100 7,820 8,120<br />
<strong>2004</strong> 8,620 9,020 7,750 8,290<br />
1 Derived as shown in Table 7.7.
Miles<br />
National Centre for Social Research<br />
Figure 7-3 Comparison of NTS car mileage figures with traffic census based figures<br />
for household cars: 1989 to <strong>2004</strong><br />
10,500<br />
10,000<br />
9,500<br />
9,000<br />
8,500<br />
8,000<br />
7,500<br />
7,000<br />
6,500<br />
6,000<br />
1989<br />
1990<br />
1991<br />
1992<br />
1993<br />
1994<br />
1995<br />
1996<br />
7.5 Household car availability<br />
1997<br />
1998<br />
1999<br />
2000<br />
Tables 7.9, 7.10 and 7.11 compare car availability by country and English region<br />
(percentage of households with no, one and more than one car or van) as measured by<br />
the 2001 Census, NTS, General Household Survey (GHS) and Expenditure and Food<br />
Survey (EFS). The NTS sample was tripled in 2002, thus 2001 figures shown are not as<br />
robust as later years. In particular, the North East and Wales have the smallest<br />
samples. There is fairly good agreement among the different surveys, though estimates<br />
for London are relatively volatile between surveys. In general in transport statistics<br />
publications car availability for single years at a national and regional level are based on<br />
aggregated data from the NTS, GHS and EFS.<br />
167<br />
2001<br />
2002<br />
<strong>2003</strong><br />
<strong>2004</strong><br />
NTS drivers annual estimates<br />
Traffic census and DVLA stock<br />
NTS diary<br />
NTS w eekly milometer readings
National Centre for Social Research<br />
Table 7-9 Households with no car available by GOR from NTS, GHS, EFS and 2001<br />
Census: 2001-<strong>2003</strong><br />
2001 2002<br />
Percentage<br />
<strong>2003</strong><br />
NTS GHS EFS Census NTS GHS EFS NTS GHS EFS<br />
No cars<br />
North East 38 32 36 36 38 36 38 38 34 39<br />
North West 29 29 29 30 26 26 29 28 29 28<br />
Yorks' and<br />
Humberside<br />
29 32 32 30 33 28 29 30 33 28<br />
East Midlands 23 26 19 24 20 25 22 22 23 21<br />
West<br />
Midlands<br />
26 25 24 27 29 27 25 25 26 24<br />
Eastern 20 20 21 20 21 19 16 21 15 20<br />
London 37 33 33 37 41 41 35 39 40 33<br />
South East 19 20 15 19 19 19 17 18 17 17<br />
South West 21 20 17 20 18 18 18 20 19 17<br />
England 26 26 24 27 26 26 24 26 26 24<br />
Wales 28 26 25 26 26 26 29 28 24 22<br />
Scotland 32 36 35 34 34 34 34 32 32 32<br />
Great Britain 27 27 25 27 27 27 26 27 26 25<br />
Table 7-10 Households with one car available by GOR from NTS, GHS, EFS and 2001<br />
Census: 2001-<strong>2003</strong><br />
2001 2002<br />
Percentage<br />
<strong>2003</strong><br />
NTS GHS EFS Census NTS GHS EFS NTS GHS EFS<br />
One car<br />
North East 44 44 42 43 44 45 40 43 50 39<br />
North West 49 45 44 44 47 47 42 45 46 45<br />
Yorks' and<br />
Humberside<br />
47 44 46 44 44 47 48 46 44 42<br />
East Midlands 52 43 48 44 47 44 44 46 47 45<br />
West<br />
Midlands<br />
49 44 45 43 41 45 42 39 44 44<br />
Eastern 47 45 46 44 43 45 48 42 47 41<br />
London 46 46 46 43 41 42 43 41 43 45<br />
South East 45 43 46 43 46 45 44 42 43 44<br />
South West 49 47 44 46 48 45 46 48 47 47<br />
England 47 44 45 44 45 45 44 43 45 44<br />
Wales 49 46 46 46 44 45 46 47 46 46<br />
Scotland 51 43 44 43 48 46 43 43 44 46<br />
Great Britain 48 44 45 44 45 45 44 44 45 44<br />
168
National Centre for Social Research<br />
Table 7-11 Households with two or more cars available by GOR from NTS, GHS, EFS<br />
and 2001 Census: 2001-<strong>2003</strong><br />
2001 2002<br />
Percentage<br />
<strong>2003</strong><br />
NTS GHS EFS Census NTS GHS EFS NTS GHS EFS<br />
2+ cars<br />
North East 17 24 21 21 17 19 23 19 16 22<br />
North West 22 26 27 26 27 27 29 27 26 27<br />
Yorks' and<br />
Humberside<br />
24 24 22 26 23 25 22 24 23 30<br />
East Midlands 25 31 33 31 34 31 34 33 30 34<br />
West<br />
25 31 30 30 30 28 33 36 31 32<br />
Midlands<br />
Eastern 33 35 33 36 36 36 36 37 38 39<br />
London 17 22 21 19 18 17 22 20 17 23<br />
South East 36 37 39 38 35 36 39 40 40 39<br />
South West 30 34 39 34 35 36 36 32 33 36<br />
England 26 30 31 29 29 29 31 30 29 32<br />
Wales 24 28 29 29 29 28 25 26 30 31<br />
Scotland 17 21 21 22 18 20 22 25 24 23<br />
Great Britain 25 29 30 29 28 28 30 30 29 31<br />
7.6 Travel to work<br />
Table 7.12 shows the modal split of travel to work for the NTS and the Labour Force<br />
Survey (LFS) in GB. Table 7.13 gives the same comparison but in addition includes<br />
figures from the 2001 census and is based on England only. The 2001 Census question<br />
on travel to work was not asked in Scotland.<br />
The first columns of Tables 7.12 and 7.13, which gives the modal split of the usual<br />
means of travel to work, shows good agreement between surveys. A comparison of the<br />
modal split of trips from the NTS travel record is also shown, which picks up all modes<br />
rather than the usual modes. These figures show a greater share of walking trips, but<br />
fewer car driver, bus and rail trips.<br />
169
National Centre for Social Research<br />
Table 7-12 Travel to work by mode from LFS and NTS: GB 1999/01 to <strong>2004</strong><br />
Usual means of travel to work (based on<br />
Percentage<br />
Trips to work (based on<br />
individuals)<br />
diary)<br />
LFS NTS LFS NTS LFS NTS LFS NTS NTS NTS NTS NTS<br />
200 199 200 200 200 200 200 200 199 200 200 200<br />
1 9/01 2 2 3 3 4 4 9/01 2 3 4<br />
Walk 11 9 11 11 10 11 10 12 14 13 13 14<br />
Bicycle 3 4 3 3 3 3 3 3 3 3 3 3<br />
Car users<br />
of which:<br />
70 70 70 70 71 69 71 69 68 70 70 68<br />
Car/van driver .. 59 .. 61 .. 61 .. 60 57 60 60 59<br />
Car/van<br />
passenger<br />
.. 11 .. 9 .. 8 .. 8 11 10 9 9<br />
Motorcycle 1 1 1 1 1 1 1 1 1 1 1 1<br />
All bus and<br />
coach<br />
of which:<br />
8 9 8 8 8 8 8 8 7 7 7 7<br />
Local stage bus .. .. .. .. .. .. .. .. 7 7 7 7<br />
Non-local bus .. .. .. .. .. .. .. .. - - - -<br />
All rail 7 7 6 6 6 6 6 7 6 5 6 6<br />
of which:<br />
Surface rail .. 4 .. 4 .. 4 .. 4 4 3 3 4<br />
Other rail .. 0 .. 0 .. 1 .. 1 2 2 2 2<br />
Taxi/minicab - .. - .. - .. - .. 1 1 1 1<br />
Other - - - - - 1 - 1 - - 1 1<br />
All modes 100 100 100 100 100 100 100 100 100 100 100 100<br />
170
National Centre for Social Research<br />
Table 7-13<br />
<strong>2004</strong><br />
Travel to work by mode from Census, LFS and NTS: England 1999/01 to<br />
Percentage<br />
Usual means of travel to work (based on individuals) Trips to work (based<br />
on diary)<br />
Cen LFS NT LFS NT LFS NT LFS NT NT NT NT NT<br />
-us<br />
200<br />
1<br />
200<br />
1<br />
S<br />
199<br />
9/0<br />
1<br />
200<br />
2<br />
S<br />
200<br />
2<br />
171<br />
200<br />
3<br />
Walk 11 11 10 10 10 10 11 10 12 14 13 12 15<br />
Bicycle 3 3 4 3 4 3 3 3 3 4 3 3 3<br />
Car users<br />
of which:<br />
67 69 69 70 69 70 69 71 68 67 69 70 67<br />
Car/van<br />
60 .. 59 .. 61 .. 61 .. 60 57 60 60 58<br />
driver<br />
Car/van<br />
passenger<br />
S<br />
200<br />
3<br />
200<br />
4<br />
S<br />
200<br />
4<br />
S<br />
199<br />
9/0<br />
1<br />
7 .. 11 .. 8 .. 8 .. 8 10 9 9 9<br />
Motorcycle 1 1 1 1 1 1 1 1 1 1 1 1 1<br />
All bus and<br />
coach<br />
of which:<br />
8 8 8 8 8 8 7 8 8 7 6 6 7<br />
Local stage<br />
bus<br />
.. .. .. .. .. .. .. .. .. 6 6 6 7<br />
Non-local<br />
bus<br />
.. .. .. .. .. .. .. .. .. - - - -<br />
All rail 8 7 6 7 7 7 7 7 7 6 6 6 6<br />
of which:<br />
Surface rail 5 .. 4 .. 4 .. 4 .. 5 4 3 4 4<br />
Other rail 4 .. 1 .. - .. 1 .. 1 2 2 3 2<br />
Taxi/minicab<br />
1 - .. - .. - .. - .. 1 1 1 1<br />
Other 1 - 1 - - - 1 - 1 - 1 - 1<br />
All modes 100 100 100 100 100 100 100 100 100 100 100 100 100<br />
7.7 Bicycle mileage<br />
Table 7.14 and Figure 7.4 show estimates of average distance travelled from the NTS<br />
and the Road Traffic Census (RTC). Both surveys have deficiencies for estimating<br />
bicycle travel due to relatively small sample size in the NTS and insufficient road<br />
coverage for bicycles on the RTC. The RTC of average distance has been consistently<br />
higher than NTS figures over the last decade and each have shown different trends.<br />
S<br />
200<br />
2<br />
S<br />
200<br />
3<br />
S<br />
200<br />
4
National Centre for Social Research<br />
Table 7-14 Comparison of NTS bicycle mileage figures with traffic census-based<br />
figures<br />
1985/<br />
1986<br />
1991/<br />
1993<br />
Trips<br />
per<br />
person<br />
per year<br />
Average<br />
trip<br />
length<br />
(miles)<br />
Average<br />
distance<br />
per<br />
person<br />
(miles)<br />
National Travel Survey Traffic census<br />
Percent<br />
change<br />
on previous<br />
year<br />
172<br />
Bicycle<br />
(billion<br />
km)<br />
Total<br />
bicycle<br />
mileage<br />
(billion)<br />
GB Population<br />
(million)<br />
Average<br />
distance<br />
per<br />
person<br />
(miles)<br />
25 1.8 44 5.8 3.6 55 65<br />
19 2.1 39 4.6 2.9 56 52<br />
Percent<br />
change<br />
on previous<br />
year<br />
1996 17 2.3 38 4.1 2.5 56 45<br />
1997 18 2.2 41 6 4.1 2.5 56 45 -<br />
1998 15 2.4 36 -11 4.0 2.5 57 43 -3<br />
1999 17 2.5 42 17 4.1 2.5 57 45 3<br />
2000 17 2.2 37 -13 4.2 2.6 57 45 2<br />
2001 14 2.6 37 2 4.2 2.6 57 46 1<br />
2002 15 2.2 33 -12 4.4 2.7 58 48 4<br />
<strong>2003</strong> 15 2.3 34 3 4.5 2.8 58 48 2<br />
<strong>2004</strong> 15 2.4 36 4 3.9 2.4 58 41 -15<br />
Figure 7-4 Average annual bicycle distance travelled per person from NTS and road<br />
traffic census<br />
Miles<br />
60<br />
50<br />
40<br />
30<br />
20<br />
10<br />
0<br />
1996 1997 1998 1999 2000 2001 2002 <strong>2003</strong> <strong>2004</strong><br />
7.8 Bus boardings<br />
Traffic<br />
census<br />
NTS<br />
Table 7.15 compares bus boardings from the NTS grossed to the total population and<br />
the survey of bus operators for London and the rest of GB. There is good agreement for
National Centre for Social Research<br />
boardings outside London. The shortfall in London reflects the fact that the NTS does<br />
not pick up foreign visitors.<br />
Table 7-15 Comparison of bus boardings from the NTS and surveys of bus<br />
operators, financial years 1<br />
NTS Survey of bus operators<br />
(SBO)<br />
Bus boarding<br />
Bus boarding<br />
(thousands)<br />
(thousands)<br />
London Other in<br />
GB<br />
London Other in<br />
GB<br />
173<br />
Percentage difference<br />
SBO-NTS<br />
London Other in<br />
GB<br />
1994/1995 925 3,274 1,167 3,247 26 -1<br />
1995/1996 918 3,230 1,205 3,173 31 -2<br />
1996/1997 897 3,109 1,242 3,103 38 -<br />
1997/1998 846 3,083 1,294 3,032 53 -2<br />
1998/1999 844 2,985 1,279 2,965 51 -1<br />
1999/2000 898 2,900 1,307 2,969 46 2<br />
2000/2001 948 2,814 1,359 2,945 43 5<br />
2001/2002 946 2,835 1,434 2,908 52 3<br />
2002/<strong>2003</strong> 916 2,923 1,542 2,900 68 -1<br />
<strong>2003</strong>/<strong>2004</strong> 910 2,859 1,702 2,833 87 -1<br />
1 NTS data is based on three year rolling averages from 1993 to 2002.<br />
7.9 Van mileage<br />
In <strong>2003</strong>, the NTS estimated annual van mileage to be 12,927. For the same period, the<br />
road freight surveys of van activity estimate annual mileage to be 13,332.<br />
The NTS annual mileage is estimated by respondents. The road freight estimate of van<br />
mileage is based on two surveys: the survey of privately owned vans 2002/03; and<br />
survey of company owned vans <strong>2003</strong>.<br />
There is a reasonably good agreement for annual mileage between the NTS and road<br />
freight estimate of all vans, with the NTS figure being slightly lower. This is due to<br />
company owned vans (which solely do ineligible NTS mileage (e.g. parcel delivery vans)<br />
and tend to travel more), being excluded from the NTS.<br />
7.10 Driving licence holding<br />
Driving licence holding information is available from the NTS and DVLA database. Up to<br />
the age of 69 years the DVLA database contains extraneous records, including dead<br />
persons and emigrants, and some duplicates of licences in maiden and married name.<br />
The requirement to renew licences at the age of 70 years removes these records. Due<br />
to the inaccuracy of the DVLA figures for those below 70 years the NTS figures are more<br />
accurate (see Table 7.16).
National Centre for Social Research<br />
Table 7-16 Driving licence holding: comparison between NTS and DVLA data<br />
Proportion of licence holders (%)<br />
DVLA <strong>2003</strong> 1<br />
National Travel Survey 2002/04<br />
Males Female Total Males Female Total<br />
17-20 28 24 26 31 26 28<br />
21-29 67 60 64 72 61 67<br />
30-39 91 79 85 88 77 82<br />
40-49 100 82 91 90 78 84<br />
50-59 102 77 89 90 71 81<br />
60-69 105 64 84 86 58 72<br />
70+ 69 24 42 70 27 46<br />
All 17+ 86 62 74 81 61 70<br />
Number of licence holders (thousands)<br />
17-20 416 336 752 467 371 837<br />
21-29 2,159 1,940 4,099 2,327 1,971 4,298<br />
30-39 4,022 3,549 7,572 3,879 3,449 7,328<br />
40-49 3,976 3,319 7,295 3,591 3,172 6,763<br />
50-59 3,698 2,879 6,577 3,285 2,647 5,933<br />
60-69 2,782 1,805 4,587 2,283 1,632 3,914<br />
70+ 1,859 950 2,808 1,891 1,081 2,972<br />
All 17+ 18,912 14,779 33,691 17,724 14,323 32,046<br />
1 Up to the age of 69 years the DVLA database contains extraneous records, including dead persons and<br />
emigrants, and some duplicates of licences in maiden and married name. The requirement to renew<br />
licences at the age of 70 years removes these records.<br />
174
8 SAMPLING ERRORS<br />
8.1 Introduction<br />
National Centre for Social Research<br />
Sample statistics (e.g. means or proportions) are estimates of the true population<br />
statistics for a country or sub-region.<br />
Estimates derived from sample surveys are subject to two types of errors: sampling<br />
errors; and non-sampling errors. Non-sampling errors can be attributed to many sources,<br />
such as non-response bias, definitional difficulties, differing respondent interpretations,<br />
and respondent inability to recall information.<br />
Sampling errors occur when estimates are derived from a sample rather than a census<br />
of the population. The sample used for a particular survey is only one of a large number<br />
of possible samples of the same size. Even if the same questionnaire, instructions and<br />
travel diaries were used, the estimates from each sample would differ from the others.<br />
This difference, termed sampling error, occurs by chance, and its variability is measured<br />
by the 'standard error' associated with a survey.<br />
The extent of the sampling error can also be expressed in terms of a confidence interval<br />
about the sample estimate. A '95 percent confidence interval' is a measure frequently<br />
used to quantify this variability. It is expressed as a range of values around a central<br />
estimate and this range is within ±1.96 standard errors of the central estimate. If the<br />
survey were repeated many times under the same circumstances we would expect such<br />
a confidence interval to contain the true value 95 percent of the time. For example, the<br />
number of trips per person per year is estimated for 2002/<strong>2003</strong> as 998 with a standard<br />
error of 5.1 (see Table 8.5). Hence the 95 percent confidence interval is [998 ± 1.96 x<br />
5.1], i.e. [998 ± 10.0], or [988 to 1,008].<br />
Survey estimates are usable only if they are sufficiently accurate for the particular<br />
purposes for which they are used, i.e. the standard errors are sufficiently small. The size<br />
of a standard error depends upon three factors: the size of the sample; the survey<br />
design; and the variability in the population of the attribute being measured. In general,<br />
the larger the sample size the smaller the standard error of a generated statistic. The<br />
standard error reduces in proportion to the square root of the sample size – hence a<br />
four-fold increase in sample size causes a two-fold reduction in the standard error. For<br />
small sub-samples of the population (e.g. households, individuals and vehicles) the<br />
standard error is related to the size of the sub-sample.<br />
Guidelines on the use of NTS data have been developed to avoid publishing misleading<br />
results based on very small sample sizes. For estimates of households, individuals and<br />
vehicles, samples of under 100 should not be used, while sub-samples of fewer than<br />
300 should be used cautiously. For trip and stage estimates, even more caution should<br />
be exercised: sub-samples under 300 should not be used to generate estimates, whilst<br />
sub-samples of under 1,000 should be used cautiously.<br />
175
National Centre for Social Research<br />
8.2 Sampling error calculations and tables<br />
Simple random sample (SRS) designs 8 are costly in terms of the travelling times of<br />
interviewers, as the sampled addresses would be spread evenly across the whole of<br />
Great Britain. So the NTS, like most other household surveys, uses a multi-stage design<br />
which groups addresses on the sampling frame into clusters of relatively small areas<br />
before sample selection. These areas, known as primary sampling units (PSUs) can be<br />
covered economically as one interviewer’s quota of work. The PSUs on the NTS are<br />
postcode sectors, or groupings of sectors. This design tends to lead to larger standard<br />
errors than an SRS would, because the PSUs are usually more homogeneous than the<br />
population as a whole. This is offset to some extent by the stratification of the sampling<br />
frame (see section 2.3).<br />
Sampling errors can be calculated for all the estimates derived from the National Travel<br />
Survey. However, the multi-stage design of the survey makes computation of sampling<br />
errors more complicated than if the survey was a simple random sample. The NTS<br />
analysis system requires two additional pieces of information for the calculation of<br />
sampling errors: the five digit area number can be used to identify and arrange the PSU<br />
selections in the correct order; the first two digits of the area number identify the major<br />
strata (region). Once the PSUs have been ordered within major strata they are paired<br />
with the following PSU to form minor strata 9 .<br />
As recommended by ONS, the software package 'STATA' has been used to calculate<br />
the standard errors.<br />
The formula used to calculate the standard error of an NTS estimate, r, is as follows:<br />
SE(r) =<br />
Where<br />
∑<br />
pair<br />
a<br />
(a - 1)<br />
x<br />
2<br />
a<br />
∑<br />
i=1<br />
2<br />
( zi<br />
- z )<br />
r = statistic being considered,<br />
i.e. the mean or proportion,<br />
a = no. of PSUs,<br />
y i = the sum of the statistic in PSU i,<br />
i.e. The total if r is a mean or the number of occurrences if r is a<br />
proportion<br />
x i = sample size in PSU i<br />
x = Σ x i<br />
z i = y i - rx i,,<br />
z = minor strata mean,<br />
Full mathematical details can be obtained from the DfT NTS enquiry point.<br />
8 A sample where each selection is statistically independent and made in the same way, gives each<br />
population element the same chance of selection.<br />
9 Sometimes a ‘pair’ will contain 3 PSUs if there is an odd number of PSUs within the major stratum.<br />
176
National Centre for Social Research<br />
The tables in this section present the standard error SE(r), the 95 percent confidence<br />
interval and the sample size 10 , or base, on which the estimate was based. It is also<br />
useful to have an idea of how much higher the standard error is than if a simple random<br />
sample (SRS) had been used. The effect of the sample design on the standard error of<br />
an estimate is called the Design Factor (DEFT) and is calculated as the complex<br />
standard error SE(r) derived above divided by the standard error that would be achieved<br />
with an SRS. The size of the DEFT varies from one estimate to another depending on<br />
the relative homogeneity of households (or individuals) within PSUs with respect to the<br />
estimates being measured. DEFT increases with average PSU size. Additionally, DEFT<br />
tends to be particularly large for estimates at the trip and stage level since trips tend to<br />
be repeated; trips are not independent events. Thus the precision of the trip and stage<br />
level estimates is considerably less than might be supposed from their total sample size.<br />
Note, this does not apply to estimates of trips and stages per person per year as these<br />
are estimates at the individual level. The DEFT is also given in the tables in this section.<br />
The table below gives details of the information shown in the Tables 8.1-8.14.<br />
Base Estimate Standard error 95% confidence<br />
range (+/-)<br />
177<br />
DEFT<br />
n r SE(r) 1.96*SE(r) SE(r )/ SESRS (r )<br />
Sample size of<br />
households,<br />
individuals,<br />
vehicles, trips or<br />
stages.<br />
Estimate e.g.<br />
Proportion of<br />
households with<br />
no cars, average<br />
trips per person<br />
per year.<br />
Standard error of<br />
the estimate r.<br />
+/-1.96*SE(r ) is<br />
the range of<br />
values in the<br />
confidence<br />
interval i.e.<br />
[r-1.96*SE(r ),<br />
r+1.96*SE(r )].<br />
Design Factor.<br />
SESRS (r ) is the<br />
standard error<br />
assuming a<br />
simple random<br />
sample.<br />
For a quick estimate of the confidence limits for any estimate not shown below, use the<br />
sample size and estimate which best approximates to the one required. Adjust as<br />
necessary, bearing in mind that the standard error, and hence the 95 percent confidence<br />
limits, are proportional to 1/ √n, where n equals the size of the sample being considered.<br />
10<br />
For trip and stage estimates, sample sizes adjusted for short walks are shown to be consistent with NTS<br />
publications.
National Centre for Social Research<br />
Table 8-1 Percentage of households by car access by GOR and country: 2002/03<br />
Households/ percentage<br />
Base Estimate Standard 95% DEFT<br />
error confidence<br />
range (+/-)<br />
North East 0 cars 745 38.0 2.8 5.6 1.60<br />
1 car 745 43.6 1.7 3.4 0.96<br />
2 cars 745 16.5 2.1 4.0 1.51<br />
3+ cars 745 1.9 0.5 1.0 1.04<br />
North West 0 cars 1,849 26.8 1.6 3.2 1.59<br />
1 car 1,849 46.0 1.2 2.4 1.05<br />
2 cars 1,849 24.3 1.3 2.6 1.31<br />
3+ cars 1,849 2.9 0.4 0.9 1.14<br />
Yorkshire &<br />
the Humber<br />
0 cars 1,395 31.3 1.9 3.7 1.50<br />
1 car 1,395 45.1 1.2 2.4 0.93<br />
2 cars 1,395 20.5 1.3 2.5 1.16<br />
3+ cars 1,395 3.1 0.5 1.1 1.17<br />
East Midlands 0 cars 1,177 20.6 1.8 3.5 1.50<br />
1 car 1,177 46.3 1.6 3.1 1.08<br />
2 cars 1,177 28.5 1.6 3.1 1.20<br />
3+ cars 1,177 4.6 0.7 1.3 1.10<br />
West Midlands 0 cars 1,392 26.5 1.5 3.0 1.29<br />
1 car 1,392 40.3 1.2 2.3 0.90<br />
2 cars 1,392 27.2 1.5 3.0 1.27<br />
3+ cars 1,392 6.0 0.8 1.5 1.18<br />
East 0 cars 1,432 20.7 1.3 2.5 1.18<br />
1 car 1,432 42.8 1.1 2.2 0.87<br />
2 cars 1,432 30.1 1.4 2.7 1.12<br />
3+ cars 1,432 6.4 0.6 1.2 0.99<br />
London 0 cars 1,809 39.7 1.4 2.7 1.19<br />
1 car 1,809 40.8 1.0 2.0 0.89<br />
2 cars 1,809 17.2 1.0 2.0 1.17<br />
3+ cars 1,809 2.3 0.4 0.7 1.03<br />
South East 0 cars 2,056 18.5 1.3 2.5 1.48<br />
1 car 2,056 43.8 1.2 2.4 1.14<br />
2 cars 2,056 31.1 1.5 3.0 1.50<br />
3+ cars 2,056 6.6 0.7 1.3 1.20<br />
South West 0 cars 1,500 18.9 1.3 2.6 1.30<br />
1 car 1,500 47.7 1.3 2.5 0.99<br />
2 cars 1,500 27.5 1.3 2.6 1.13<br />
3+ cars 1,500 5.8 0.7 1.3 1.09<br />
178
Table 8.1 continued<br />
National Centre for Social Research<br />
Base Estimate Standard<br />
error<br />
179<br />
Households/ percentage<br />
95% DEFT<br />
confidence<br />
range (+/-)<br />
Wales 0 cars 829 27.0 2.4 4.8 1.58<br />
1 car 829 45.6 2.1 4.1 1.21<br />
2 cars 829 23.3 2.1 4.1 1.41<br />
3+ cars 829 4.1 0.7 1.3 0.99<br />
Scotland 0 cars 1,511 32.6 1.7 3.4 1.44<br />
1 car 1,511 45.5 1.3 2.6 1.04<br />
2 cars 1,511 19.4 1.3 2.6 1.29<br />
3+ cars 1,511 2.6 0.4 0.8 0.98<br />
Great Britain 0 cars 15,695 26.9 0.5 1.0 1.41<br />
1 car 15,695 44.2 0.4 0.8 1.01<br />
2 cars 15,695 24.5 0.4 0.9 1.28<br />
3+ cars 15,695 4.3 0.2 0.4 1.10<br />
Table 8-2 Percentage of households living within 13 minutes of an hourly or better<br />
bus service by area type: 2002/03<br />
Households/ percentage<br />
Base Estimate Standard<br />
error<br />
95%<br />
confidence<br />
range (+/-)<br />
DEFT<br />
GB 15,695 89.5 0.6 1.1 2.27<br />
London Boroughs 1,809 98.2 0.3 0.6 1.07<br />
Met. Built up areas 2,286 98.5 0.3 0.6 1.14<br />
Large urban over<br />
250k<br />
2,170 97.0 0.5 0.9 1.25<br />
Medium urban 25<br />
to 250k<br />
4,156 96.2 0.4 0.8 1.33<br />
Small urban 10 to<br />
25k<br />
1,898 92.0 0.9 1.8 1.49<br />
Small urban 3 to<br />
10k<br />
1,240 86.7 1.8 3.5 1.84<br />
Rural 2,136 51.5 2.1 4.2 1.97
National Centre for Social Research<br />
Table 8-3 Percentage of individuals aged 17+ with full driving licence by gender and<br />
age: 2002/03<br />
Individuals/ percentage<br />
Base Estimate Standard<br />
error<br />
180<br />
95%<br />
confidence<br />
range (+/-)<br />
DEFT<br />
All persons 28,317 70.5 0.4 0.8 1.53<br />
All males 13,352 81.3 0.4 0.8 1.24<br />
Males:<br />
17-20 698 32.2 2.0 3.8 1.10<br />
21-29 1,568 74.2 1.1 2.2 1.04<br />
30-39 2,504 88.1 0.7 1.4 1.08<br />
40-49 2,432 90.8 0.6 1.2 1.06<br />
50-59 2,350 89.9 0.6 1.2 1.00<br />
60-69 1,879 86.1 0.9 1.7 1.08<br />
70+ 1,921 68.6 1.1 2.1 1.00<br />
All Females 14,965 60.9 0.5 1.0 1.29<br />
Females:<br />
17-20 740 27.3 1.7 3.3 1.02<br />
21-29 1,770 61.5 1.2 2.4 1.04<br />
30-39 2,819 77.1 0.9 1.7 1.11<br />
40-49 2,611 78.1 0.9 1.7 1.08<br />
50-59 2,454 71.4 1.0 1.9 1.05<br />
60-69 2,028 57.5 1.1 2.2 1.03<br />
70+ 2,543 27.5 0.9 1.8 1.05
National Centre for Social Research<br />
Table 8-4 Percentage of individuals aged 17+ with full driving licence by GOR:<br />
2002/03<br />
Individuals/ percentage<br />
Base Estimate Standard<br />
error<br />
181<br />
95%<br />
confidence<br />
range (+/-)<br />
GB 28,317 70.5 0.4 0.8 1.5<br />
DEFT<br />
North East 1,327 58.5 2.2 4.4 1.6<br />
North West 3,350 68.1 1.5 2.9 1.8<br />
Yorkshire and the<br />
Humber<br />
2,456 66.7 1.5 3.0 1.6<br />
East Midlands 2,157 74.4 1.5 3.0 1.6<br />
West Midlands 2,570 70.4 1.5 3.0 1.7<br />
East of England 2,609 74.8 1.2 2.3 1.4<br />
London 3,212 63.7 1.1 2.1 1.3<br />
South East 3,776 78.5 0.9 1.9 1.4<br />
South West 2,689 77.1 1.0 2.0 1.2<br />
Wales 1,507 69.1 2.2 4.4 1.9<br />
Scotland 2,664 67.0 1.3 2.5 1.4
National Centre for Social Research<br />
Table 8-5 Trips per person per year 1 by main mode and purpose: 2002/03<br />
Individuals/ trips<br />
Base Estimate Standard<br />
error<br />
182<br />
95%<br />
confidence<br />
range (+/-)<br />
DEFT<br />
Main Mode:<br />
Walk 2<br />
36,353 244 3.8 7.4 1.65<br />
Bicycle 36,353 15 0.6 1.1 1.28<br />
Car/van driver 36,353 410 4.0 7.9 1.36<br />
Car/van passenger 36,353 228 2.1 4.1 1.26<br />
Motorcycle 36,353 3 0.2 0.5 1.03<br />
Other private 36,353 8 0.4 0.7 1.25<br />
London stage bus 36,353 12 0.7 1.4 1.80<br />
Other stage bus 36,353 47 1.1 2.1 1.58<br />
Non-local bus 36,353 1 0.1 0.1 1.20<br />
LT Underground 36,353 6 0.5 0.9 1.72<br />
Surface rail 36,353 12 0.4 0.8 1.36<br />
Taxi/minicab 36,353 11 0.4 0.7 1.51<br />
Other public 36,353 2 0.3 0.6 2.42<br />
Purpose 2 :<br />
Commuting 36,353 150 1.5 3.0 1.25<br />
Business 36,353 33 0.8 1.5 1.08<br />
Education 36,353 65 1.3 2.6 1.46<br />
Escort education 36,353 47 1.3 2.6 1.31<br />
Shopping 36,353 197 1.6 3.2 1.26<br />
Other escort 36,353 95 1.4 2.8 1.32<br />
Personal business 36,353 106 1.3 2.5 1.31<br />
Visiting friends at<br />
private home<br />
36,353 119 1.4 2.7 1.39<br />
Visiting friends<br />
elsewhere<br />
36,353 45 0.8 1.6 1.35<br />
Entertainment/<br />
36,353 46 0.8 1.5 1.41<br />
public activity<br />
Sport: participate 36,353 19 0.5 0.9 1.34<br />
Holiday: base 36,353 11 0.5 1.0 1.64<br />
Day trip 36,353 24 0.6 1.2 1.46<br />
Other inc. just walk 36,353 40 1.1 2.2 1.23<br />
All trips 36,353 998 5.1 10.0 1.55<br />
1 Excluding series of calls trips.<br />
2 After reweighting for short walk trips.
National Centre for Social Research<br />
Table 8-6 Trips per person per year 1,2 by gender and GOR: 2002/03<br />
Base Estimate Standard 95%<br />
Individuals/ trips<br />
DEFT<br />
error confidence<br />
range (+/-)<br />
Gender:<br />
Male 17,445 994 5.6 11.0 1.2<br />
Female 18,908 1003 6.2 12.1 1.3<br />
GOR:<br />
North East 1,652 980 25.1 49.3 1.5<br />
North West 4,332 1027 15.9 31.2 1.6<br />
Yorkshire &<br />
3,172 975 15.6 30.6 1.4<br />
Humberside<br />
East Midlands 2,733 1059 17.1 33.5 1.4<br />
West Midlands 3,293 998 19.5 38.2 1.7<br />
Eastern 3,442 1005 15.6 30.5 1.5<br />
Greater London 4,220 880 14.2 27.9 1.6<br />
South East 4,854 1048 12.7 24.9 1.4<br />
South West 3,360 1050 17.5 34.4 1.6<br />
Wales 1,899 948 22.9 44.9 1.6<br />
Scotland 3,396 991 16.6 32.6 1.6<br />
All individuals 36,353 998 5.1 10.0 1.6<br />
1 Excluding series of calls trips.<br />
2 After reweighting for short walk trips.<br />
Table 8-7 Miles per person per year 1 by main mode and purpose: 2002/03<br />
Individuals/ miles<br />
Base Estimate Standard 95% DEFT<br />
error confidence<br />
range (+/-)<br />
Main Mode:<br />
Walk 2<br />
36,353 168 2.5 4.9 1.58<br />
Bicycle 36,353 33 1.4 2.7 1.09<br />
Car/van driver 36,353 3,497 48.1 94.2 1.39<br />
Car/van passenger 36,353 2,046 30.4 59.6 1.42<br />
Motorcycle 36,353 34 3.1 6.2 1.05<br />
Other private 36,353 155 8.4 16.5 1.16<br />
London stage bus 36,353 43 2.9 5.7 1.80<br />
Other stage bus 36,353 211 5.2 10.3 1.31<br />
Non-local bus 36,353 76 7.6 14.8 1.32<br />
LT Underground 36,353 53 4.1 8.0 1.64<br />
Surface rail 36,353 396 15.0 29.4 1.17<br />
Taxi/minicab 36,353 47 2.0 3.9 1.30<br />
183
National Centre for Social Research<br />
Base Estimate Standard 95%<br />
Individuals/ miles<br />
DEFT<br />
error confidence<br />
range (+/-)<br />
Other public 36,353 80 9.7 19.0 1.03<br />
Purpose 2 :<br />
Commuting 36,353 1,280 20.6 40.5 1.17<br />
Business 36,353 682 21.0 41.1 1.08<br />
Education 36,353 202 5.7 11.2 1.11<br />
Escort education 36,353 103 4.5 8.8 1.32<br />
Shopping 36,353 843 12.5 24.5 1.73<br />
Other escort 36,353 477 9.7 19.1 1.35<br />
Personal business 36,353 465 9.8 19.2 1.39<br />
Visiting friends at<br />
private home<br />
36,353 1,097 21.8 42.8 1.49<br />
Visiting friends<br />
elsewhere<br />
36,353 254 7.2 14.1 1.45<br />
Entertainment/<br />
36,353 362 10.0 19.6 1.40<br />
public activity<br />
Sport: participate 36,353 123 4.1 8.1 1.17<br />
Holiday: base 36,353 541 23.8 46.7 1.61<br />
Day trip 36,353 383 12.9 25.3 1.55<br />
Other inc. just walk 36,353 42 1.2 2.3 1.24<br />
All trips 36,353 6,855 71.3 139.7 1.70<br />
1 Excluding series of calls trips.<br />
2 After reweighting for short walk trips.<br />
184
National Centre for Social Research<br />
Table 8-8 Miles per person per year 1,2 by gender and GOR: 2002/03<br />
Base Estimate Standard 95%<br />
Individuals/ miles<br />
DEFT<br />
error confidence<br />
range (+/-)<br />
Gender:<br />
Male 17,445 7,899 90.3 177.0 1.31<br />
Female 18,908 5,891 68.7 134.6 1.41<br />
GOR:<br />
North East 1,652 5,902 345.8 677.7 1.98<br />
North West 4,332 6,185 196.6 385.3 1.77<br />
Yorkshire &<br />
3,172 6,428 249.5 489.1 1.87<br />
Humberside<br />
East Midlands 2,733 7,652 323.1 633.2 1.93<br />
West Midlands 3,293 6,716 230.2 451.2 1.63<br />
Eastern 3,442 7,591 228.0 447.0 1.62<br />
Greater London 4,220 5,224 144.1 282.5 1.48<br />
South East 4,854 8,021 209.7 411.1 1.72<br />
South West 3,360 7,957 233.2 457.0 1.47<br />
Wales 1,899 6,712 325.0 636.9 1.89<br />
Scotland 3,396 6,667 223.0 437.1 1.57<br />
All individuals 36,353 6,855 71.3 139.7 1.70<br />
1 Excluding series of calls trips.<br />
2 After reweighting for short walk trips.<br />
Table 8-9 Total time per person per year 1,2 : 2002/03<br />
Base Estimate Standard<br />
error<br />
185<br />
Individuals/ hours<br />
95% DEFT<br />
confidence<br />
range (+/-)<br />
All trips 36,353 362 2.1 4.0 1.53<br />
1 Excluding series of calls trips.<br />
2 After reweighting for short walk trips.
National Centre for Social Research<br />
Table 8-10 Average trip length 1 by main mode and purpose: 2002/03<br />
Base Estimate Standard<br />
error<br />
186<br />
95%<br />
confidence<br />
range (+/-)<br />
Trips/ miles<br />
DEFT<br />
Main Mode:<br />
Walk 2<br />
170,027 0.7 0.007 0.013 4.24<br />
Bicycle 10,198 2.2 0.07 0.14 2.42<br />
Car/van driver 285,540 8.5 0.08 0.16 2.45<br />
Car/van passenger 158,894 9.0 0.12 0.23 2.24<br />
Motorcycle 2,312 10.4 0.73 1.43 2.27<br />
Other private 5,813 18.6 0.93 1.82 1.90<br />
London stage bus 8,439 3.7 0.09 0.18 2.90<br />
Other stage bus 32,517 4.6 0.08 0.15 3.18<br />
Non-local bus 580 91.0 5.53 10.83 1.71<br />
LT Underground 4,431 8.6 0.27 0.53 3.73<br />
Surface rail 8,143 34.1 1.05 2.05 2.02<br />
Taxi/minicab 7,816 4.2 0.14 0.28 1.87<br />
Other public 1,449 40.8 7.17 14.06 2.26<br />
Purpose 2 :<br />
Commuting 104,592 8.5 0.12 0.24 3.08<br />
Business 23,081 20.6 0.50 0.98 1.82<br />
Education 45,268 3.1 0.08 0.16 2.28<br />
Escort education 32,642 2.2 0.08 0.16 2.30<br />
Shopping 137,332 4.3 0.06 0.12 2.94<br />
Other escort 66,320 5.0 0.09 0.17 2.13<br />
Personal business 74,223 4.4 0.08 0.17 2.13<br />
Visiting friends at<br />
private home<br />
83,066 9.2 0.18 0.36 2.21<br />
Visiting friends<br />
elsewhere<br />
31,466 5.6 0.14 0.28 1.94<br />
Entertainment/<br />
32,120 7.9 0.19 0.37 1.95<br />
public activity<br />
Sport: participate 13,439 6.4 0.17 0.33 1.69<br />
Holiday: base 7,534 50.1 1.85 3.64 2.06<br />
Day trip 16,936 15.8 0.45 0.88 2.28<br />
Other inc. just walk 28,140 1.1 0.02 0.04 2.20<br />
All trips 696,159 6.9 0.07 0.13 3.07<br />
1 Excluding series of calls trips.<br />
2 After reweighting for short walk trips.
National Centre for Social Research<br />
Table 8-11 Stages per person per year 1 by mode: 2002/03<br />
Base Estimate Standard 95%<br />
Individuals/ stages<br />
DEFT<br />
error confidence<br />
range (+/-)<br />
Mode:<br />
Walk 2<br />
36,353 296 4.4 8.7 1.68<br />
Bicycle 36,353 15 0.6 1.2 1.29<br />
All car/ van 36,353 644 5.4 10.6 1.86<br />
Local bus 36,353 65 1.4 2.7 1.65<br />
Rail/ Underground 36,353 22 0.8 1.5 1.42<br />
Other 36,353 29 0.7 1.4 1.43<br />
All stages 36,353 1,070 5.8 11.4 1.57<br />
1<br />
Excluding series of calls trips.<br />
2<br />
After reweighting for short walk trips.<br />
187
National Centre for Social Research<br />
Table 8-12 Stage distance per person per year 1 by mode: 2002/03<br />
Base Estimate Standard 95%<br />
Individuals/ miles<br />
DEFT<br />
error confidence<br />
range (+/-)<br />
Mode:<br />
Walk 2<br />
36,353 191 2.7 5.3 1.60<br />
Bicycle 36,353 34 1.4 2.7 1.10<br />
All car/ van 36,353 5,562 68.4 134.0 1.79<br />
Local bus 36,353 260 5.9 11.5 1.39<br />
Rail/ Underground 36,353 417 14.6 28.7 1.19<br />
Other 36,353 391 15.2 29.8 1.16<br />
All stages 36,353 6,855 71.3 139.7 1.70<br />
1<br />
Excluding series of calls trips.<br />
2<br />
After reweighting for short walk trips.<br />
188
National Centre for Social Research<br />
Table 8-13 Trips to and from school per child per year 1 by main mode: 2002/03<br />
Trips/ percentage/ miles<br />
Base Estimate Standard 95% DEFT<br />
error confidence<br />
range (+/-)<br />
Age 5-10<br />
Walk 2<br />
17,623 52 1.4 2.8 3.75<br />
Bicycle 17,623 1 0.2 0.3 2.63<br />
Car/van passenger 17,623 40 1.3 2.6 3.59<br />
Private bus 17,623 3 0.4 0.9 3.27<br />
Local bus 17,623 3 0.4 0.8 3.31<br />
Rail 17,623 0 .. .. ..<br />
Other 17,623 1 0.3 0.6 3.20<br />
Average length<br />
(miles)<br />
17,623 1.5 0.06 0.12 2.93<br />
Age 11-16<br />
Walk 2<br />
18,391 40 1.4 2.8 3.97<br />
Bicycle 18,391 2 0.3 0.6 3.02<br />
Car/van passenger 18,391 23 1.0 2.0 3.23<br />
Private bus 18,391 8 0.8 1.5 3.67<br />
Local bus 18,391 24 1.1 2.2 3.58<br />
Rail 18,391 1 0.3 0.5 3.17<br />
Other 18,391 2 0.3 0.5 2.68<br />
Average length<br />
(miles)<br />
18,391 3.3 0.11 0.21 3.29<br />
Age 5-16<br />
Walk 2<br />
36,014 46 1.0 2.0 3.98<br />
Bicycle 36,014 1 0.2 0.4 3.01<br />
Car/van passenger 36,014 31 0.9 1.8 3.66<br />
Private bus 36,014 6 0.4 0.9 3.50<br />
Local bus 36,014 13 0.6 1.3 3.56<br />
Rail 36,014 1 0.1 0.3 3.19<br />
Other 36,014 2 0.2 0.4 3.04<br />
Average length<br />
36,014 2.4 0.07 0.13 3.39<br />
(miles)<br />
1<br />
Trips of under 50 miles only.<br />
2<br />
After reweighting for short walk trips.<br />
189
National Centre for Social Research<br />
Table 8-14 Bicycle travel 1,2 in Great Britain and England: 2002/03<br />
Individuals/ miles/ trips<br />
Base Estimate Standard 95% DEFT<br />
error confidence<br />
range (+/-)<br />
Distance travelled per person per year<br />
Great Britain 36,353 33 1.4 2.7 1.09<br />
England 31,058 35 1.5 3.0 1.11<br />
Bicycle trips per person per year<br />
Great Britain 36,353 15 0.6 1.1 1.28<br />
England 31,058 16 0.7 1.3 1.30<br />
1<br />
Excluding series of calls trips.<br />
2<br />
After reweighting for short walk trips.<br />
190
National Centre for Social Research<br />
9 PROGRESS ON IMPLEMENTING THE RECOMMENDATIONS<br />
OF THE NATIONAL STATISTICS QUALITY REVIEW<br />
9.1 Introduction<br />
This chapter summarises progress in implementing the recommendations made in the<br />
National Statistics Review in 2000 that were accepted by the Department for Transport<br />
(formerly DETR). The Department's response to issues raised on the future of the NTS<br />
during the review is summarised in Annex F of the report on the Review (DETR, 2001).<br />
Most changes were implemented for the 2002 survey, but some developments, such as<br />
weighting the data and improving imputation routines, are still ongoing. Many of the<br />
changes that took place in 2002 are described in more detail earlier in this report. This<br />
chapter brings them together in summary form and provides cross-references to earlier<br />
sections.<br />
9.2 Sample size and survey design<br />
The basic format of a household survey with a seven day travel record has been<br />
maintained as this received strong support from users.<br />
9.2.1 Sample size<br />
The drawn sample size was increased from 5,796 households at the time of the Review<br />
to 15,048 households from 2002. This has enabled key results to be published for single<br />
years and in time will enable more robust data for regions, metropolitan areas and large<br />
counties to be produced by aggregating years together. The sample comprises 684<br />
Primary Sampling Units (PSUs), each containing 22 households, which are allocated to<br />
a single interviewer (see section 2.1)<br />
London is oversampled in order to compensate for lower response rates there. The size<br />
of the London boost was reviewed and Inner and Outer London were oversampled from<br />
2002 on the basis of response rates for 1995-2000 (see section 2.4).<br />
9.2.2 Stratification<br />
With the increase in sample size, the number of geographic units in the first stage of<br />
stratification was increased from 20 to 40. The number of sub-divisions were increased<br />
in London, Wales and Scotland; the former metropolitan counties became strata; and<br />
strata in the rest of England are either single counties or groups of counties (see section<br />
2.3).<br />
The car ownership stratifier was retained, but the socio-economic stratifier was replaced<br />
by population density. Both these are based on 1991 Census data. The Review<br />
recommended that the assessment of optimal stratifiers should be repeated once the<br />
2001 Census data become available. This work has not yet been done but will be<br />
carried out in time for the 2007 survey.<br />
191
National Centre for Social Research<br />
9.2.3 Quasi-panel design<br />
Half the Primary Sampling units (PSUs) in a given year's sample are retained for the<br />
next year's sample and the other half replaced. This should have the effect of reducing<br />
the variance of year-on-year change. Controls ensure that a household cannot be<br />
selected two years running and that PSUs cannot be selected 3 years running (see<br />
section 2.2).<br />
9.2.4 Sample frame<br />
The sample frame excludes people not living in households. An experiment was carried<br />
out on the 2001 survey to try to include students who live in halls of residence in termtime<br />
by asking parents for contact details. However, the number of students identified<br />
was extremely small and it was decided that this was not a viable option.<br />
9.3 Questionnaire topics<br />
Annex D of the Review report sets out changes to the questions suggested by users.<br />
Questions covering the following topics were introduced in 2002 (see section 3.7.1 of the<br />
2002 <strong>Technical</strong> <strong>Report</strong>):<br />
Household level<br />
• Reasons for moving to current address<br />
• Deliveries to households<br />
• Rating of bus and rail frequency and reliability (even years)<br />
• Rating of condition of pavements and provision of cycle lanes (even years)<br />
Individual level<br />
• Difficulty getting in and out of a car<br />
• Awareness of special transport services<br />
• Travel difficulties going to work, shopping and other facilities<br />
• Travel benefits at work<br />
• Working from home<br />
• Whether children are accompanied to school or crossing roads<br />
• Walks of 20 minutes or more<br />
• Periods children play in the street (diary)<br />
Vehicle level<br />
• Registration number<br />
• How often car/light van is used to deliver goods in course of work<br />
• Number of delivery points<br />
• Use of vehicle outside GB (even years)<br />
192
Rotated questions<br />
National Centre for Social Research<br />
To enable more questions to be added in 2002, some existing questions are now only<br />
asked every other year. These include:<br />
• Walk and bus times to local facilities<br />
• Ratings of reliability and frequency, condition of pavements and cycle paths<br />
• Use of vehicle outside GB<br />
• Frequency of use of public transport and bicycles (changed back to annual from<br />
<strong>2003</strong>)<br />
Questions added for <strong>2003</strong>-2005<br />
From <strong>2003</strong> the payment of road user or congestion charges was collected in the travel<br />
record. Further questions have been added in <strong>2004</strong> and 2005 as follows:<br />
• Methods used by individuals to plan journeys by private vehicle or public<br />
transport in the last 6 months (<strong>2004</strong>)<br />
• Availability and use of powered wheelchairs and scooters (2005)<br />
• Willingness to use online travel record or Personal Digital Assistant (PDA) (2005)<br />
• How many times the respondent left the house the previous day (2005)<br />
• Educational attainment (2005)<br />
In 2005 the accessibility questions were changed to be in line with the Department's core<br />
accessibility indicators.<br />
Questions removed in 2002 are listed in Appendix E to the 2002 <strong>Technical</strong> <strong>Report</strong> and<br />
those removed in <strong>2003</strong> and <strong>2004</strong> are listed in Appendix [E] to this report.<br />
9.4 Diary data<br />
9.4.1 Geocoding<br />
From 2002 respondents have been asked to give the full address, including postcode,<br />
for all origins and destinations of trips on day 7 of the travel record. The coding of these<br />
data has been very successful with over 88% being coded to the exact postcode in both<br />
2002 and <strong>2003</strong> 11 (see section 4.3 for more details). The postcoded data have then been<br />
coded to provide data for origins and destinations for the following geographic areas:<br />
county/unitary authority, ward, postcode sector, the NTS urban/rural areas, and the<br />
National Transport Model (NTM) areas.<br />
The geocoded data are also being used to produce road and crow fly distances of trips<br />
for comparison with trip lengths recorded by respondents.<br />
11 Accuracy data for <strong>2004</strong> were not available at the time of writing.<br />
193
National Centre for Social Research<br />
9.4.2 New technologies<br />
DfT are looking at how to exploit new technology to improve the information available<br />
from the NTS. The 2005 NTS questionnaire asks whether respondents would prefer to<br />
record their journeys in a travel record:<br />
• on a computer or on the internet<br />
• in a small hand held computer or PDA which they would carry with them or<br />
• in the current paper Travel Diaries.<br />
DfT have followed development in the use of personal Global Positioning System (GPS)<br />
recorders to track the routes made by respondents, as trialled by TfL.<br />
DfT hopes to undertake research in 2006 to test the use of latest advances in GPS<br />
against normal recording; test recording trips on a PDA; and develop an on-line travel<br />
record.<br />
9.5 Response rates<br />
9.5.1 Incentives<br />
Response rates for the NTS, as for other household surveys, fell during the 1990s. An<br />
experiment to test monetary incentives was carried out in the second half of 2002. The<br />
main aim of the experiment was to test whether or not incentives could significantly<br />
improve the response rate for ‘fully co-operating’ households. Receipt of an incentive<br />
payment by an individual was conditional on full co-operation from the whole household.<br />
Two different levels of incentive (£5 and £10) were tested against a control group who<br />
received no incentive.<br />
There was a significant and large rise in response rate using a £5 incentive, caused by<br />
primarily a shift from partial to full responses. The additional increase in response rate<br />
with a £10 incentive was small and not significant. Incentives were successful in<br />
encouraging under-represented groups such as large and single parent families to take<br />
part (see section 3.11 and 3.12 in the 2002 <strong>Technical</strong> <strong>Report</strong> and Stratford et al (<strong>2003</strong>))<br />
From June <strong>2004</strong> a book of stamps has been included with the advance letter as a preincentive.<br />
9.6 Data processing<br />
9.6.1 Weighting<br />
The NTS data are currently not weighted to correct for non-response or sample<br />
selection. Weighting the NTS is not straightforward because of the many levels used for<br />
analysis (household, individual, vehicle, trip etc). In collaboration with NatCen, a<br />
methodology for weighting the NTS has been developed and applied to data from the<br />
2002 NTS. This provides two sets of weights. One set, referred to as the 'diary weights',<br />
is for the sample of fully co-operating households where all members completed a travel<br />
record and the data are used for analysing trips. The other set, the 'interview weights',<br />
194
National Centre for Social Research<br />
comprises all households which completed an interview, and therefore as well as fully<br />
co-operating households it includes 'partially responding' households, where not all<br />
individuals completed a travel record. This sample is only used for analyses that do not<br />
require travel record trip data.<br />
The weighting for both sets adjusts for household selection, household non-participation,<br />
and removal of households with missing individual interviews. The weighting for the fully<br />
co-operating sample additionally allows for removal of the interview sample households<br />
that were not fully responding. Calibration weighting was carried out to adjust the<br />
weights so that the age/sex and GOR distributions of the respondents matched<br />
population estimates. For the fully co-operating sample weights were also adjusted so<br />
that weighted estimates for key survey measures matched the weighted estimates for<br />
the sample of all households completing an interview. Weights were also produced to<br />
adjust for drop-off during the week of the travel record and for the short-fall in reporting<br />
long distance journeys. The final report on the methodology developed for the weighting<br />
project was released on the DfT website in September 2005 (Pickering et al, 2005)<br />
together with a report comparing weighted and unweighted data for 2002. The intention<br />
is to weight data for 1995-2001 and <strong>2003</strong>-04 and publish trends for key variables based<br />
on weighted data, in Spring 2006. Data for 2005 will be published on a weighted basis<br />
in Summer 2006.<br />
9.6.2 Non-response survey<br />
A non-response survey was introduced in 2002 to collect information about the<br />
demographic characteristics and travel behaviour of household members (see section<br />
3.14). Some households that completed the non-response form subsequently<br />
participated in the NTS survey and analyses suggest that there were no substantial<br />
differences between participating households and non-participating households that<br />
completed a non-response form. Use of data from the non-response survey for<br />
weighting was considered but rejected because of inconsistencies between information<br />
from the non-response survey and the main NTS survey. In 2005 questions have been<br />
added to the main NTS survey to allow direct comparison of key measures with the nonresponse<br />
survey.<br />
9.6.3 Partially responding households<br />
Data from partially responding households are currently excluded from NTS analysis but,<br />
as indicated in the section on weighting above, these data have been incorporated into<br />
the weighting strategy for the NTS.<br />
9.6.4 Census-linked Study of survey non-response (CLS)<br />
The NTS was included in the study by ONS to link data from households selected for<br />
various surveys with data from the 2001 Census (Freeth et al, 2005). Use of the CLS to<br />
generate weights for the NTS was considered but rejected on the grounds that there was<br />
no guarantee that a correction weight developed in 2001 would be appropriate for<br />
subsequent years.<br />
195
National Centre for Social Research<br />
9.6.5 Imputation<br />
The Review recommended that methods to impute missing data items be reviewed. DfT<br />
have examined all the imputation routines and identified those that needed changing or<br />
updating. The most important changes have been made and work is ongoing on the rest.<br />
9.6.6 Area classifications<br />
The accuracy of the classification of data to urban/rural areas has been considerably<br />
improved by moving to a GIS based system, updating settlement areas using data from<br />
the 2001 Census and by using the classification at household rather than Primary<br />
Sampling Unit level.<br />
Data from 2002 can also be analysed by the ONS Area Classification, the new<br />
urban/rural classification, and the <strong>2004</strong> Index of Multiple Deprivation.<br />
9.6.7 Rolling three year data<br />
The Review suggested that more data should be presented on a three year rolling<br />
average basis. This was done in the 2002 and <strong>2004</strong> NTS Statistical Bulletins and in the<br />
2005 edition of Focus on Personal Travel.<br />
9.6.8 Tours database<br />
The Review stated that a 'tours' database should be developed by linking series of trips<br />
starting and finishing at home. DfT plan to do this when resources are available.<br />
9.7 Data Access<br />
Currently the NTS branch meets requests from users for tables of data and supplies data<br />
in SPSS format to the UK Data Archive or direct to users on CD-ROM. DfT recognise<br />
that users would like to be able to extract NTS tables from the web. A pilot system to run<br />
tables via a web-based interface was developed but proved to be unreliable. DfT plan to<br />
develop a better web-based interface when resources permit. Web-based access raises<br />
issues of small sample sizes in terms of robustness of data and disclosure issues.<br />
9.8 Other issues<br />
9.8.1 Local authority boosts<br />
For <strong>2003</strong> onwards local authorities have been able to buy additional samples in their<br />
area. There were two boosts in <strong>2003</strong>: one covered the area of all the Essex districts<br />
plus Southend-on-Sea Unitary Authority and the other covered the Thames Gateway<br />
area in Essex. It is unlikely that further boosts will be carried out because of the high<br />
cost, and the lack of sufficient resource in DfT to manage boosts and produce extra<br />
databases. No other areas have requested boosts. For areas which are strata it will be<br />
possible to provide data by aggregating over several years.<br />
196
National Centre for Social Research<br />
9.9 Other changes from 2002 not covered in the Review<br />
9.9.1 Registration number<br />
From 2002 respondents were asked to give the registration number of all household<br />
vehicles. This enabled the more technical information about vehicles (e.g. engine size,<br />
type of fuel, taxation class) to be obtained through the DVLA database of vehicles with a<br />
view to improving data quality and reducing the burden on respondents. See section<br />
4.4.4 for more details on registration number checking.<br />
9.9.2 Coding<br />
From 2002 the travel record data was coded centrally rather than by interviewers (see<br />
sections 4.1 and 4.2) and considerable efforts were made by the new contractor to clarify<br />
definitions to ensure greater consistency. This may have led to some discontinuities<br />
between data for 2002 onwards with data for earlier years.<br />
9.9.3 Distance checks<br />
Prior to 2002, DfT applied inter-county distance checks to the data after delivery, and<br />
implausible cases were fed back to the contractor. From 2002 this procedure was<br />
brought forward and the checks were applied during editing by NatCen (see section<br />
4.4.6).<br />
197
National Centre for Social Research<br />
REPORTS AND PAPERS ON THE NATIONAL TRAVEL SURVEY<br />
Website address for publications: www.dft.gov.uk/transtat/personaltravel<br />
Enquiries to: national.travelsurvey@dft.gov.uk or 020 7944 3097<br />
<strong>Report</strong>s of National Travel Survey results<br />
National Travel Survey 1985/86 <strong>Report</strong>, HMSO 1988.<br />
<strong>Report</strong>s on the continuous survey (publication date in brackets):<br />
National Travel Survey 1989/91 (1993), 1989/91 (1993), 1991/93 (1994), 1992/94<br />
(1995), 1993/95 (1996), 1994/96 (1997) (all HMSO).<br />
National Travel Survey Bulletins: 1996/98 (DETR, 1999), 1997/99 (DETR, 2000),<br />
1998/2000 (DTLR, 2001), 1999/2001 (DfT, 2002), 2002 (DfT, <strong>2004</strong>), <strong>2003</strong> (DfT, <strong>2004</strong>),<br />
<strong>2004</strong> (DfT, 2005)<br />
Focus on Personal Travel (TSO) 1998, 2001, 2005.<br />
Articles: each edition of Transport Trends from 1998 to 2001 (TSO) has articles on<br />
aspects of personal travel, using NTS data.<br />
Factsheets: factsheets on 14 different NTS topics are available from the website or in<br />
hard copy (see contact details above).<br />
National Travel Survey <strong>Technical</strong> <strong>Report</strong>s<br />
Butcher, B, National Travel Survey <strong>Technical</strong> <strong>Report</strong> 1985/6, Office of Population<br />
Censuses and Surveys<br />
Wilmot, A (1993), National Travel Survey <strong>Technical</strong> <strong>Report</strong>, July 1988 - December 1991,<br />
Office of Population Censuses and Surveys<br />
Wilmot, A (1994), National Travel Survey <strong>Technical</strong> <strong>Report</strong> 1992, Office of Population<br />
Censuses and Surveys<br />
Wilmot A (1995), National Travel Survey <strong>Technical</strong> <strong>Report</strong> 1994, Office of Population<br />
Censuses and Surveys<br />
Wilmot A, (1996), National Travel Survey <strong>Technical</strong> <strong>Report</strong> 1995, Office for National<br />
Statistics,<br />
Freeth S (1997), National Travel Survey <strong>Technical</strong> <strong>Report</strong> 1996, Office for National<br />
Statistics<br />
Freeth, S, Barton, J, Noble,B, Sullivan, B & Williams, D (1999), National Travel Survey<br />
<strong>Technical</strong> <strong>Report</strong> 1997, Office for National Statistics<br />
Freeth, S, National Travel Survey <strong>Technical</strong> <strong>Report</strong> 1998, Office for National Statistics,<br />
(1999).<br />
Kershaw, A (2000), National Travel Survey <strong>Technical</strong> <strong>Report</strong> 1999, Office for National<br />
Statistics<br />
Kershaw, A, Barton, J, Noble, B, Williams, D, & Hird, D (2001), National Travel Survey<br />
<strong>Technical</strong> <strong>Report</strong> 2000, Office for National Statistics<br />
Stratford, N, Simmonds, N, Nicolaas, G, Costigan, P (<strong>2003</strong>), National Travel Survey<br />
2002 <strong>Technical</strong> <strong>Report</strong>. National Centre for Social Research<br />
199
Other reports<br />
National Centre for Social Research<br />
Office for National Statistics. <strong>Report</strong> on the pilot work for 1985/6 survey.<br />
Dodd, T, ‘The use of reinterviewing on the National Travel Survey pilot’ in SSD Survey<br />
Methodology Bulletin No. 17, June 1985.<br />
Butcher, R and Eldridge, J (1990), The use of diaries in data collection, The Statistician<br />
39, 25–41.<br />
Bushnell, D (1994), ‘The National Travel Survey <strong>Report</strong> of the 1991 Census-linked study<br />
of survey non-respondents’, Unpublished<br />
Bushnell, D (1995), Weighting the National Travel Survey to compensate for nonresponse,<br />
An investigation into Census-based weighting schemes. Unpublished<br />
Wilmot, A & Bateson, B (1995). ‘Computer Assisted Personal Interviewing Techniques<br />
on the National Travel Survey’ in SSD Survey Methodology Bulletin No. 37.<br />
Barton, J (1996), ‘Investigating stratification options for the National Travel Survey’,<br />
Unpublished<br />
Freeth, S (1997), Using a range of methods to collect travel data, the experience of the<br />
British National Travel Survey. Paper for the International Conference on Transport<br />
Survey Quality and Innovation, Grainau, Germany<br />
Jackson, B (1998), ‘National Travel Survey 1997 Validation of Cycle Journeys’,<br />
Unpublished<br />
Hird, D (2000), Partially responding households in the National Travel Survey,<br />
Unpublished.<br />
DETR (2001), Review of the National Travel Survey, National Statistics Review Quality<br />
Series <strong>Report</strong> No 3, DETR, London<br />
Noble, B. (2001). Using simple time use surveys to investigate travel. Paper for the<br />
International Conference on Transport Survey Quality and Innovation, Kruger National<br />
Park, South Africa<br />
Department for Transport, 'National Travel Survey: Comparison of weighted and<br />
unweighted data for 2002'<br />
Gleave, S, D (<strong>2003</strong>), The use of GPS to improve travel data, <strong>Report</strong> prepared for the<br />
DTLR New Horizons Programme<br />
Simmonds, N. and N. Stratford, G. Nicolaas (<strong>2003</strong>) National Travel Survey 2002: <strong>Report</strong><br />
on Incentives Experiment. London: National Centre for Social Research<br />
Salathiel, D, & Nicolaas, G (<strong>2004</strong>). The effects of monetary incentives on response rates<br />
and sample bias, Paper for the International Conference on Transport Survey Quality<br />
and Innovation, Costa Rica.Freeth,<br />
S. and P.Sowman, C. Greenwood (2005) The National Travel Survey: <strong>Report</strong> of<br />
the2001 Census-linked study of survey non-response, Unpublished<br />
Pickering, K, Tipping, S, & S, Scholes, 'Weighting the National Travel Survey:<br />
Methodology Final <strong>Report</strong>'<br />
200
National Centre for Social Research<br />
APPENDIX A QUESTIONNAIRE DOCUMENTATION <strong>2003</strong> AND <strong>2004</strong><br />
Introduction to Questionnaire Documentation: Changes for <strong>2003</strong> and <strong>2004</strong><br />
This questionnaire documentation for the survey years <strong>2003</strong> and <strong>2004</strong> is based on the<br />
documentation for 2002. Changes within 2002 and from 2002 for <strong>2003</strong> and then for <strong>2004</strong><br />
are in underlined text and are marked in the documentation with the following comments:<br />
Changes for 2002<br />
(QUESTION DELETED MID 2002 ONWARDS)<br />
Changes for <strong>2003</strong><br />
(EXTRA INT. INSTRUCTION ADDED <strong>2003</strong> ONWARDS)<br />
(INT. INSTRUCTION DELETED <strong>2003</strong> ONWARDS)<br />
(PRECODE NUMBERING CHANGED <strong>2003</strong> ONWARDS TO:)<br />
(HELP )(HELPNOTE ADDED <strong>2003</strong> ONWARDS)<br />
(PRECODES CHANGED <strong>2003</strong> ONWARDS TO:)<br />
(CHANGED <strong>2003</strong> ONWARDS TO:)<br />
(PRECODES CHANGED <strong>2003</strong> ONLY TO:)<br />
(EXTRA INT. INSTRUCTION ADDED <strong>2003</strong> ONLY)<br />
(CHANGED <strong>2003</strong> ONLY TO:)<br />
(QUESTION ADDED <strong>2003</strong> ONWARDS:)<br />
(QUESTION AND ROUTING CHANGED <strong>2003</strong> ONWARDS TO:)<br />
(ROUTING CHANGED <strong>2003</strong> ONWARDS TO:)<br />
(QUESTION AND ROUTING CHANGED <strong>2003</strong> ONLY TO:)<br />
(ROUTING CHANGED <strong>2003</strong> ONLY TO:)<br />
Changes for <strong>2004</strong><br />
(EXTRA INT. INSTRUCTION ADDED <strong>2004</strong> ONWARDS)<br />
(INT. INSTRUCTION DELETED <strong>2004</strong> ONWARDS)<br />
(PRECODE NUMBERING CHANGED <strong>2004</strong> ONWARDS TO:)<br />
(HELP )(HELPNOTE ADDED <strong>2004</strong> ONWARDS)<br />
(PRECODES CHANGED <strong>2004</strong> ONWARDS TO:)<br />
201
(CHANGED <strong>2004</strong> ONWARDS TO:)<br />
(EXTRA INT. INSTRUCTION ADDED <strong>2004</strong> ONLY)<br />
(QUESTION ADDED <strong>2004</strong> ONWARDS:)<br />
National Centre for Social Research<br />
(QUESTION AND ROUTING CHANGED <strong>2004</strong> ONWARDS TO:)<br />
(QUESTION DELETED <strong>2004</strong> ONWARDS)<br />
(ROUTING CHANGED <strong>2004</strong> ONWARDS TO:)<br />
Introduction to Questionnaire Documentation: Block routing<br />
The NTS questionnaire is in distinct sections, such as the household questionnaire,<br />
individual questionnaire, the vehicle questionnaire, pick-up questionnaires and Admin<br />
block. In the Blaise programme used to create the CAPI, the whole programme is<br />
created out of blocks that tend to hold related questions on a particular topic or theme.<br />
The block routing shown in the text boxes below displays the rules governing each<br />
question block as a whole as opposed to the rules between individual questions. Each<br />
text box contains the rules governing the asking of the questions below it (as these<br />
questions fit into the block mentioned in the text box).<br />
If no routing is noted in the text box, assume there is no routing between the blocks<br />
reliant on specific respondent attributes (such as age) or responses to certain questions.<br />
Therefore within the:<br />
• Household questionnaire – if there is no routing noted, then assume that the<br />
questions within a block will either be asked of the household reference person or<br />
their partner, or in exceptional occasions another adult (person aged 16 and over)<br />
• Individual questionnaire – if there is no routing noted, then assume that the<br />
questions will be asked of every individual respondent (either through face to face or<br />
by proxy interviewing)<br />
• Vehicle questionnaire – if there is no routing noted, then assume the questions will<br />
be asked of the respondent who best knows about the vehicle (normally the main<br />
driver but not necessarily so)<br />
• Pick-up interviews – if there is no routing noted, then assume the questions will be<br />
asked of the individual respondents available at the time of pick-up with the vehicle<br />
questions (vehicle pick up interview) being asked of the respondent who best knows<br />
about the vehicle (normally the main driver but not necessarily so as they might be<br />
unavailable at pick up)<br />
Please note that no block routing is provided for the Admin block or the Diary Entry<br />
System. Also note that the block routing is not exhaustive as there are other blocks<br />
202
National Centre for Social Research<br />
contained within the NTS programme that do not contain any of the questions listed<br />
below (so they are not listed).<br />
Wthin each text box below, the specific question block and its module name within Blaise<br />
(the CAPI software) are displayed at the top of the box in bold text separated by a<br />
forward slash. Sub-block names are displayed directly below (and to the right) in bold<br />
text as well. Below this are the rules governing each block. For example:<br />
TChTrav / QTCHTRAV.NTS]<br />
• BchTrav<br />
Questions asked if :<br />
Any individual household member is aged 7-<br />
13, asked for each member in turn,<br />
answered by HRP or another respondent<br />
aged 16 or over<br />
IF HRP has child/ren THEN<br />
SchInt<br />
"I'd now like to ask a few questions about your/the ^children's journey to and from school."<br />
1. "Press 1 and to continue."<br />
Etc.<br />
This is the name of the block / The name of the<br />
module within Blaise that holds the block<br />
These are the questions<br />
within the block or sub<br />
block (until the next text<br />
box is reached)<br />
This is the sub-block<br />
203<br />
These are the rules governing the block or<br />
sub block
Household Questionnaire<br />
BID/ QID.NTS<br />
Area<br />
"AREA NUMBER.<br />
JUST PRESS ."<br />
Address<br />
"ADDRESS NUMBER.<br />
@IJUST PRESS @I."<br />
Hhold<br />
"HOUSEHOLD NUMBER.<br />
JUST PRESS ."<br />
BSignin/ QSIGNIN.NTS<br />
RECORD ALWAYS<br />
StatusQ<br />
"What is the status of this interview?<br />
INTERVIEWER: IF YOU ARE NOW<br />
STARTING THE PICK-UP<br />
INTERVIEW,<br />
CHANGE THE CODE TO '2' THEN<br />
PRESS AND TO<br />
GO TO THE<br />
FIRST PICK UP QUESTION.<br />
YOU CANNOT GO BACK TO CODE<br />
'1' ONCE YOU HAVE CODED '2' "<br />
1. "Placement interview"<br />
2. "Pick-up interview"<br />
RECORD ALWAYS<br />
StartDat<br />
"DATE PLACEMENT INTERVIEW<br />
WITH THIS HOUSEHOLD WAS<br />
STARTED<br />
PRESS ENTER TO CONFIRM DATE"<br />
RECORD ALWAYS<br />
FirstQ<br />
"INTERVIEWER: You are in the<br />
questionnaire for: ^SerFill<br />
IS THIS:<br />
National Centre for Social Research<br />
204<br />
- TO UPDATE ADMIN DETAILS<br />
PRESS "<br />
1. "the first time you've opened this<br />
questionnaire"<br />
2. "or the second or later time?"<br />
5. "EMERGENCY CODE IF<br />
COMPUTER'S DATE IS WRONG AT<br />
LATER CHECK"<br />
RECORD ALWAYS<br />
TravDate<br />
"INTERVIEWER: ENTER START<br />
DATE OF TRAVEL WEEK FOR THIS<br />
HOUSEHOLD."<br />
BNames/ QNAMES.HAR<br />
BBNames<br />
ASK ALWAYS<br />
Name<br />
"RECORD NAME/IDENTIFIER FOR<br />
EACH MEMBER OF THE<br />
HOUSEHOLD. (HELP )<br />
WHEN ALL HOUSEHOLD<br />
MEMBERS HAVE BEEN ENTERED,<br />
PRESS PgDn "<br />
THComp / QTHCOMP.NTS<br />
ASK ALWAYS<br />
Sex<br />
"^DMNAMES]<br />
INTERVIEWER: CODE SEX OF<br />
RESPONDENT"<br />
1. "Male"<br />
2. "Female"<br />
ASK ALWAYS<br />
Birth<br />
"^DMNAMES[LTLooper]<br />
What is your date of birth?<br />
FOR DAY NOT GIVEN....ENTER 15<br />
FOR DAY.<br />
FOR MONTH NOT GIVEN....ENTER 6<br />
FOR MONTH<br />
ENTER FULL YEAR, eg. 9/11/1952<br />
RATHER THAN 52 (EXTRA INT.<br />
INSTRUCTION ADDED <strong>2003</strong><br />
ONWARDS)"
IF respondent does not know their age<br />
or refuses to provide it (Birth = don’t<br />
know OR Birth = refusal)<br />
AgeIf<br />
"^DMNAMES[LTLooper]<br />
What was your age last birthday?<br />
98 or more = CODE 97 (HELP )"<br />
IF age is 16 or over (DVAge >= 16)<br />
THEN:<br />
MarStat<br />
"^DMNAMES ASK OR RECORD<br />
CODE FIRST THAT APPLIES<br />
Are you (HELP )"<br />
1. "single, that is, never married"<br />
2. "married and living with your<br />
husband/wife"<br />
3. "married and separated from your<br />
husband/wife"<br />
4. "divorced"<br />
5. "or widowed?"<br />
IF age is 16 or over (DVAge >= 16)<br />
AND Marital status is not married and<br />
living with husband/wife (Marstat <br />
Marrliv) THEN:<br />
LiveWith<br />
"^DMNAMES<br />
ASK OR RECORD<br />
May I just check, are you living with<br />
someone in the household as a<br />
couple? (HELP )"<br />
1. "Yes"<br />
2. "No"<br />
3. "SPONTANEOUS ONLY - same<br />
sex couple"<br />
IF age is 16 or over (DVAge >= 16)<br />
THEN:<br />
Hhldr<br />
"^DMNAMES<br />
In whose name is the accommodation<br />
owned or rented?<br />
ASK OR RECORD. (HELP )"<br />
1. "This person alone"<br />
3. "This person jointly"<br />
5. "NOT owner/renter"<br />
National Centre for Social Research<br />
205<br />
(PRECODES CHANGED <strong>2003</strong><br />
ONWARDS TO:)<br />
1. "This person alone"<br />
2. "This person jointly"<br />
3. "NOT owner/renter"<br />
ASK ALWAYS:<br />
EthGroup<br />
"SHOW CARD A<br />
^DMNAMES<br />
To which of these ethnic groups do<br />
you consider you belong? Please<br />
choose from this card... (HELP )"<br />
1. "White British"<br />
2. "Another white background"<br />
3. "White and Black Caribbean"<br />
4. "White and Black African"<br />
5. "White and Asian"<br />
6. "Any other Mixed background"<br />
7. "Indian"<br />
8. "Pakistani"<br />
9. "Bangladeshi"<br />
10. "Any other Asian background"<br />
11. "Caribbean"<br />
12. "African"<br />
13. "Any other Black background"<br />
14. "Chinese"<br />
15. "Any other"<br />
IF ethnic group = another white<br />
background (Ethgroup = othwhite)<br />
THEN<br />
OthWht<br />
"Please can you describe your ethnic<br />
group?<br />
ENTER DESRIPTION OF ETHNIC<br />
GROUP."<br />
IF ethnic group = any other mixed<br />
background (Ethgroup = MixedOth)<br />
THEN<br />
OthMxd<br />
"Please can you describe your ethnic<br />
group? ENTER DESRIPTION OF<br />
ETHNIC GROUP."
IF ethnic group = any other asian<br />
background (Ethgroup = OthAs) THEN<br />
OthAsn<br />
"Please can you describe your ethnic<br />
group?<br />
ENTER DESRIPTION OF ETHNIC<br />
GROUP."<br />
IF ethnic group = any other black<br />
background (Ethgroup = OtherBl)<br />
THEN<br />
OthBlk<br />
"Please can you describe your ethnic<br />
group?<br />
ENTER DESRIPTION OF ETHNIC<br />
GROUP."<br />
IF ethnic group = any other (Ethgroup<br />
= AnyOth) THEN<br />
OthETh<br />
"Please can you describe your ethnic<br />
group?<br />
ENTER DESRIPTION OF ETHNIC<br />
GROUP."<br />
BHRP / QHRP.NTS<br />
IF the accommodation is jointly owned<br />
or rented/there is more than one<br />
householder (QTHComp.NumHHldr ><br />
1) THEN<br />
HiHNum<br />
"You have told me that ^HhldrTxt<br />
jointly own or rent the accommodation.<br />
Of these, who has the highest income<br />
(from earnings, benefits, pensions and<br />
any other sources)? (HELP )<br />
IF THEY HAVE THE SAME INCOME,<br />
CODE 11<br />
INTERVIEWER: THESE ARE THE<br />
JOINT HOUSEHOLDERS<br />
(1) ^HhldrNme[1]^s^s^HhldrAge[1]<br />
^HhldrDOB[1]<br />
(2) ^HhldrNme[2]^s^s^HhldrAge[2]<br />
^HhldrDOB[2]<br />
(3) ^HhldrNme[3]^s^s^HhldrAge[3]<br />
^HhldrDOB[3]<br />
(4) ^HhldrNme[4]^s^s^HhldrAge[4]<br />
^HhldrDOB[4]<br />
National Centre for Social Research<br />
206<br />
(5) ^HhldrNme[5]^s^s^HhldrAge[5]<br />
^HhldrDOB[5]<br />
(6) ^HhldrNme[6]^s^s^HhldrAge[6]<br />
^HhldrDOB[6]<br />
(7) ^HhldrNme[7]^s^s^HhldrAge[7]<br />
^HhldrDOB[7]<br />
(8) ^HhldrNme[8]^s^s^HhldrAge[8]<br />
^HhldrDOB[8]<br />
(9) ^HhldrNme[9]^s^s^HhldrAge[9]<br />
^HhldrDOB[9]<br />
(10)^HhldrNme[10]^s^s^HhldrAge[10]<br />
^HhldrDOB[10]^s^s<br />
ENTER PERSON NUMBER"<br />
IF the accommodation is jointly owned<br />
or rented/there is more than one<br />
householder (QTHComp.NumHHldr ><br />
1) AND joint householders have the<br />
same income (HiHNum = 11) THEN<br />
JntEldA<br />
"ENTER PERSON NUMBER OF THE<br />
ELDEST JOINT HOUSEHOLDER<br />
FROM THOSE WITH THE SAME<br />
HIGHEST INCOME<br />
ASK OR RECORD<br />
(1) ^HhldrNme[1]^s^s^HhldrAge[1]<br />
^HhldrDOB[1]<br />
(2) ^HhldrNme[2]^s^s^HhldrAge[2]<br />
^HhldrDOB[2]<br />
(3) ^HhldrNme[3]^s^s^HhldrAge[3]<br />
^HhldrDOB[3]<br />
(4) ^HhldrNme[4]^s^s^HhldrAge[4]<br />
^HhldrDOB[4]<br />
(5) ^HhldrNme[5]^s^s^HhldrAge[5]<br />
^HhldrDOB[5]<br />
(6) ^HhldrNme[6]^s^s^HhldrAge[6]<br />
^HhldrDOB[6]<br />
(7) ^HhldrNme[7]^s^s^HhldrAge[7]<br />
^HhldrDOB[7]<br />
(8) ^HhldrNme[8]^s^s^HhldrAge[8]<br />
^HhldrDOB[8]<br />
(9) ^HhldrNme[9]^s^s^HhldrAge[9]<br />
^HhldrDOB[9]<br />
(10)^HhldrNme[10]^s^s^HhldrAge[10]<br />
^HhldrDOB[10]^s^s"<br />
IF the accommodation is jointly owned<br />
or rented/there is more than one<br />
householder (QTHComp.NumHHldr ><br />
1) AND the highest income of joint<br />
householders is refused or not known
(HiHNum = Don’t Know OR HiHNum =<br />
Refusal) THEN<br />
JntEldB<br />
"ENTER PERSON NUMBER OF THE<br />
ELDEST JOINT HOUSEHOLDER<br />
ASK OR RECORD<br />
(1) ^HhldrNme[1]^s^s^HhldrAge[1]<br />
^HhldrDOB[1]<br />
(2) ^HhldrNme[2]^s^s^HhldrAge[2]<br />
^HhldrDOB[2]<br />
(3) ^HhldrNme[3]^s^s^HhldrAge[3]<br />
^HhldrDOB[3]<br />
(4) ^HhldrNme[4]^s^s^HhldrAge[4]<br />
^HhldrDOB[4]<br />
(5) ^HhldrNme[5]^s^s^HhldrAge[5]<br />
^HhldrDOB[5]<br />
(6) ^HhldrNme[6]^s^s^HhldrAge[6]<br />
^HhldrDOB[6]<br />
(7) ^HhldrNme[7]^s^s^HhldrAge[7]<br />
^HhldrDOB[7]<br />
(8) ^HhldrNme[8]^s^s^HhldrAge[8]<br />
^HhldrDOB[8]<br />
(9) ^HhldrNme[9]^s^s^HhldrAge[9]<br />
^HhldrDOB[9]<br />
(10)^HhldrNme[10]^s^s^HhldrAge[10]<br />
^HhldrDOB[10]^s^s"<br />
THRels / QTHRELS.HAR<br />
BHRels<br />
ASK ALWAYS<br />
R<br />
"CODE RELATIONSHIP OF EACH<br />
HOUSEHOLD MEMBER TO THE<br />
OTHERS - ^NameRels IS<br />
^NameR[LHRels1]'S... @|(HLP)"<br />
1. "Spouse"<br />
2. "Cohabitee"<br />
3. "Son/daughter (incl. adopted)"<br />
4. "Step-son/daughter"<br />
5. "Foster child"<br />
6. "Son-in-law/daughter-in-law"<br />
7. "Parent/guardian"<br />
8. "Step-parent"<br />
9. "Foster parent"<br />
10. "Parent-in-law"<br />
11. "Brother/sister (incl. adopted)"<br />
12. "Step-brother/sister"<br />
13. "Foster brother/sister"<br />
14. "Brother/sister-in-law"<br />
15. "Grand-child"<br />
National Centre for Social Research<br />
207<br />
16. "Grand-parent"<br />
17. "Other relative"<br />
18. "Other non-relative"<br />
BSPout / QSPOUT.NTS<br />
IF respondent has said they are<br />
married and living with spouse but<br />
they are without a spouse in the<br />
household ((QTHComp.QHComp<br />
{Loop1}.MarStat = MarrLiv AND<br />
(Spouses [Loop1] = 0)) THEN<br />
SpOut<br />
"INTERVIEWER:<br />
You've recorded<br />
@I^DMNAMES[Loop1]@I as 'Married<br />
& living with spouse', but without a<br />
spouse in the household. PLEASE<br />
CHECK THIS. If spouse is away for six<br />
months or more, press 1 and enter to<br />
continue.<br />
BUT IF NOT (eg if separated), ENTER<br />
2 AND AMEND HOUSEHOLD GRID."<br />
1. "Married, spouse not in household"<br />
2. "Other - AMEND HOUSEHOLD<br />
GRID"<br />
No Don't Know, No Refusal<br />
BAccom / QACCOM.NTS<br />
RECORD ALWAYS<br />
Accom<br />
"INTERVIEWER CODE: IS THE<br />
HOUSEHOLD'S ACCOMMODATION:<br />
N.B. MUST BE SPACE USED BY<br />
HOUSEHOLD (HELP )"<br />
1. "a house or bungalow"<br />
2. "a flat or maisonette"<br />
3. "a room/rooms"<br />
4. "...other?"<br />
IF Household accommodation is a<br />
house or bungalow (Accom = Hse)<br />
THEN<br />
HseType<br />
"INTERVIEWER CODE: IS THE<br />
HOUSE/BUNGALOW: (HELP )"<br />
1. "detached"<br />
2. "semi-detached"<br />
3. "or terraced/end of terrace?"
IF Household accommodation is a flat<br />
or maisonette (Accom = Flat) THEN<br />
FltTyp<br />
"INTERVIEWER CODE: IS THE<br />
FLAT/MAISONETTE:"<br />
1. "a purpose-built block"<br />
2. "a converted house/some other<br />
kind of building?"<br />
IF Household accommodation is<br />
another type (Accom = Other) THEN<br />
AccOth<br />
"INTERVIEWER CODE: IS THE<br />
ACCOMMODATION A:"<br />
1. "caravan, mobile home or<br />
houseboat"<br />
2. "or some other kind of<br />
accommodation?"<br />
BTenure / QTENURE.NTS<br />
ASK ALWAYS<br />
Ten1<br />
"SHOW CARD B<br />
In which of these ways do you occupy<br />
this accommodation?<br />
MAKE SURE ANSWER APPLIES TO<br />
^DMNAMES[QHRP.DVHRPNum] -<br />
THE HRP<br />
(HELP )"<br />
1. "Own outright"<br />
2. "Buying it with the help of a<br />
mortgage or loan"<br />
3. "Pay part rent and part mortgage<br />
(shared ownership)"<br />
4. "Rent it"<br />
"Live here rent-free (including rent-free<br />
in relative's/friend's<br />
property; excluding squatting)"<br />
6. "Squatting"<br />
BResLen / QRESLen.NTS<br />
ASK ALWAYS<br />
HLong<br />
"RECORDED FOR HOUSEHOLD<br />
REFERENCE PERSON<br />
(^LDMIntName) ONLY<br />
National Centre for Social Research<br />
208<br />
How long have you (has<br />
^LDMIntName) lived at this address?<br />
... (HELP )"<br />
1. "Less than 12 months"<br />
2. "12 months but less than 2 years"<br />
3. "2 years but less than 3 years"<br />
4. "3 years but less than 5 years"<br />
5. "5 years but less than 10 years"<br />
6. "10 years but less than 20 years"<br />
7. "20 years or longer"<br />
IF HRP has lived at address for less<br />
than three years (Hlong IN [L12M,<br />
M12L2Y, M2YL3Y]) THEN<br />
YMove<br />
"SHOW CARD C1<br />
Here are some reasons why people<br />
move. Can you tell me why<br />
you/^LDMIntName moved to this<br />
address?<br />
PROBE: Any other reasons?<br />
CODE ALL THAT APPLY<br />
(HELP )(HELPNOTE ADDED<br />
<strong>2003</strong> ONWARDS)"<br />
1. "To move to a better<br />
neighbourhood/more pleasant area"<br />
2. "Change of employment"<br />
3. "To be closer to work/school"<br />
4. "To be closer to family/friends"<br />
5. "To be closer to shops/leisure<br />
facilities"<br />
6. "Better public transport"<br />
7. "Wanted larger or better house/flat<br />
"<br />
8. "Wanted smaller or cheaper<br />
house/flat"<br />
9. "Moved in with or split up with a<br />
partner"<br />
10. "Wanted to buy"<br />
11. "Wanted own home/to live<br />
independently"<br />
97. "Other reason (SPECIFY)"<br />
IF respondent moved for other reason<br />
(Other IN Ymove) THEN<br />
OthYMove<br />
"Please specify other reasons.<br />
TEXT SHOULD BE NO MORE THAN<br />
60 CHARACTERS"
IF HRP gave more than one reason for<br />
moving (CARDINAL (Ymove) > 1)<br />
THEN<br />
YMoveM<br />
"SHOW CARD C1 AGAIN<br />
And what was the main reason<br />
you/^LDMIntName moved?<br />
CODE ONE ONLY"<br />
1. "To move to a better<br />
neighbourhood/more pleasant area"<br />
2. "Change of employment"<br />
3. "To be closer to work/school"<br />
4. "To be closer to family/friends"<br />
5. "To be closer to shops/leisure<br />
facilities"<br />
6. "Better public transport"<br />
7. "Wanted larger or better house/flat<br />
"<br />
8. "Wanted smaller or cheaper<br />
house/flat"<br />
9. "Moved in with or split up with a<br />
partner"<br />
10. "Wanted to buy"<br />
11. "Wanted own home/to live<br />
independently"<br />
97. "Other reason (SPECIFY)"<br />
IF HRP moved for other reason<br />
(YmoveM= other) THEN<br />
OthYMovM<br />
"Please specify other main reason.<br />
TEXT SHOULD BE NO MORE THAN<br />
60 CHARACTERS"<br />
IF HRP has lived at address for less<br />
than three years (Hlong IN [L12M,<br />
M12L2Y, M2YL3Y]) THEN<br />
PTImp<br />
"SHOW CARD C2<br />
When you/^LDMIntName were<br />
choosing this home, how important<br />
was the availability of public transport<br />
in the local area? "<br />
1. "Very important"<br />
2. "Fairly important"<br />
3. "Not very important"<br />
4. "Not at all important"<br />
National Centre for Social Research<br />
209<br />
IF HRP has lived at address for less<br />
than one year (Hlong = L12M) THEN<br />
OldAdd<br />
"Is your (is ^LDMIntName)'s old<br />
address more than one mile from here<br />
or less than that?"<br />
1. "More than one mile"<br />
2. "One mile or less"<br />
BLocServ / QLOCSERV.NTS<br />
ASK ALWAYS<br />
ServIntr<br />
"INTERVIEWER: ANYONE IN THE<br />
HOUSEHOLD WHO KNOWS THE<br />
ANSWERS CAN BE ASKED THESE<br />
QUESTIONS.<br />
I would like to ask you a few questions<br />
about local bus and train services.<br />
First I would like to ask about your<br />
local bus service..."<br />
1. "Press to continue."<br />
ASK ALWAYS<br />
NearBus<br />
"About how long would it take (me) to<br />
walk from here to the nearest bus stop<br />
or place where I could get on a bus? I<br />
am interested in the nearest one even<br />
if it isn't the main one you use. (HELP<br />
)<br />
RECORD TO NEAREST MINUTE<br />
IF RESPONDENT DOES NOT<br />
KNOW, ENTER AND<br />
ENCOURAGE ESTIMATE AT NEXT<br />
QUESTION"<br />
IF the time it would take to walk to the<br />
nearest bus stop is not known<br />
(NearBus = DK) THEN<br />
NearBand<br />
"SHOW CARD D1<br />
Taking your answer from this card,<br />
approximately how long would it take<br />
(me) (to walk to your nearest bus<br />
stop)?<br />
INTERVIEWER: IF DK ENCOURAGE<br />
ESTIMATE."<br />
1. "6 minutes or less"
2. "7-13 minutes"<br />
3. "14-26 minutes"<br />
4. "27-43 minutes"<br />
5. "44 minutes or longer"<br />
ASK ALWAYS<br />
GetBus<br />
"How frequent are the buses from that<br />
bus stop during the day? Is there ...<br />
READ OUT ...<br />
IF 'VARIES' TAKE WEEK DAY OFF-<br />
PEAK FREQUENCY"<br />
1. "...Less than one a day,"<br />
2. "at least one a day,"<br />
3. "at least one an hour,"<br />
4. "at least one every half-hour,"<br />
5. "or, at least one every quarter of<br />
an hour?"<br />
ASK ALWAYS<br />
NearSta<br />
"Now thinking of your local train<br />
service, how long would it take (me) to<br />
walk to your nearest railway station?<br />
(Again I am interested in the<br />
NEAREST one, even if it is not the<br />
main one or the one you use).<br />
RECORD TO NEAREST MINUTE<br />
IF RESPONDENT DOES NOT<br />
KNOW, ENTER AND<br />
ENCOURAGE ESTIMATE AT NEXT<br />
QUESTION"<br />
(CHANGED <strong>2003</strong> ONWARDS TO:)<br />
"Now thinking of your local train<br />
service, how long would it take (me) to<br />
walk to your nearest railway (that is<br />
Ex-BR) station?<br />
(Again I am interested in the<br />
NEAREST one, even if it is not the<br />
main one or the one you use).<br />
IF TOO FAR TO WALK, PROBE: If<br />
you did walk, how long would it take?<br />
DO NOT INCLUDE UNDERGROUND<br />
STATIONS.<br />
RECORD TO NEAREST MINUTE<br />
IF RESPONDENT DOES NOT<br />
KNOW, ENTER AND<br />
ENCOURAGE ESTIMATE AT NEXT<br />
QUESTION"<br />
National Centre for Social Research<br />
210<br />
IF the time it would take to walk to the<br />
nearest train station is not known<br />
(NearSta = DK) THEN<br />
BanRail<br />
"SHOW CARD D1<br />
Taking your answer from this card,<br />
approximately how long would it take<br />
(me) (to walk to your nearest railway<br />
station)?<br />
INTERVIEWER: IF DK ENCOURAGE<br />
ESTIMATE."<br />
1. "6 minutes or less"<br />
2. "7-13 minutes"<br />
3. "14-26 minutes"<br />
4. "27-43 minutes"<br />
5. "44 minutes or longer"<br />
ASK ALWAYS<br />
BusSta<br />
"How long would it take (me) to get to<br />
the railway station by bus? Please<br />
include any time spent walking but not<br />
waiting time.<br />
RECORD TO NEAREST MINUTE<br />
IF RESPONDENT DOES NOT<br />
KNOW, ENTER AND<br />
ENCOURAGE ESTIMATE AT NEXT<br />
QUESTION<br />
IF QUICKER TO WALK, ENTER<br />
AND CODE 6 AT NEXT<br />
QUESTION<br />
IF NO CONVENIENT BUS SERVICE,<br />
ENTER AND CODE 7 AT<br />
NEXT QUESTION (HELP )."<br />
IF the time it would take to take the<br />
bus to the nearest railway station is<br />
not known (BusSta = DK) OR if it is<br />
quicker to walk or there is no<br />
convenient bus service THEN<br />
BanBus<br />
"SHOW CARD D2<br />
Taking your answer from this card,<br />
approximately how long would it take<br />
(me) (to get to your nearest railway<br />
station by bus)?<br />
INTERVIEWER: IF DK ENCOURAGE<br />
ESTIMATE
IF BOTH CODE 6 AND 7 APPLY,<br />
USE CODE 7. (EXTRA INT.<br />
INSTRUCTION ADDED <strong>2003</strong><br />
ONWARDS)"<br />
1. "6 minutes or less"<br />
2. "7-13 minutes"<br />
3. "14-26 minutes"<br />
4. "27-43 minutes"<br />
5. "44 minutes or longer"<br />
6. "Quicker to walk"<br />
7. "No convenient bus service"<br />
ASK ALWAYS<br />
DescTa<br />
"What is your nearest railway station<br />
like? Is it ... READ OUT..."<br />
1. "...a station with frequent services<br />
throughout the day (at least once per<br />
hour),"<br />
2. "a station with frequent services<br />
only during rush hours (at least once<br />
per hour),"<br />
3. "or a station with less frequent<br />
services?"<br />
ASK ALWAYS<br />
ClosSta<br />
"Is there a (London Underground),<br />
metro, light rail or tram stop which is<br />
closer?<br />
IF YES, PROBE: Which type of stop is<br />
closer?<br />
HELP )(HELPNOTE ADDED<br />
<strong>2003</strong> ONWARDS)"<br />
1. "London Underground"<br />
2. "Metro"<br />
3. "Light Rail"<br />
4. "Tram"<br />
5. "No, no other stop is closer"<br />
IF there is a tube (London<br />
Underground/metro/light rail/tram)<br />
closer than the nearest railway station<br />
(ClosSta IN [LU, Metro, Lrail, Tram])<br />
THEN<br />
NearTube<br />
"How long would it take (me) to walk to<br />
your nearest ^tubetxt stop?<br />
RECORD TO NEAREST MINUTE<br />
National Centre for Social Research<br />
211<br />
IF RESPONDENT DOES NOT<br />
KNOW, ENTER AND<br />
ENCOURAGE ESTIMATE AT NEXT<br />
QUESTION"<br />
IF there is a tube (London<br />
Underground/metro/light rail/tram)<br />
closer than the nearest railway station<br />
(ClosSta IN [LU, Metro, Lrail, Tram])<br />
AND IF the time it would take to walk<br />
to nearest tube (London<br />
Underground/metro/light rail/tram) stop<br />
is not known (NearTube = DK)) THEN<br />
BanTube<br />
"SHOW CARD D1.<br />
Taking your answer from this card,<br />
approximately how long would it take<br />
(me) (to walk to your nearest ^tubetxt<br />
stop)?<br />
INTERVIEWER: IF DK ENCOURAGE<br />
ESTIMATE"<br />
1. "6 minutes or less"<br />
2. "7-13 minutes"<br />
3. "14-26 minutes"<br />
4. "27-43 minutes"<br />
5. "44 minutes or longer"<br />
IF there is a tube (London<br />
Underground/metro/light rail/tram)<br />
closer than the nearest railway station<br />
(ClosSta IN [LU, Metro, Lrail, Tram])<br />
THEN<br />
BusTube<br />
"And how long would it take (me) to<br />
get to the nearest ^tubetxt stop BY<br />
BUS? (including any time spent<br />
walking but not waiting time)?<br />
RECORD TO NEAREST MINUTE<br />
IF RESPONDENT DOES NOT<br />
KNOW, ENTER AND<br />
ENCOURAGE ESTIMATE AT NEXT<br />
QUESTION<br />
IF QUICKER TO WALK, ENTER<br />
AND CODE 6 AT NEXT<br />
QUESTION<br />
IF NO CONVENIENT BUS SERVICE,<br />
ENTER AND CODE 7 AT<br />
NEXT QUESTION (HELP )."
IF there is a tube (London<br />
Underground/metro/light rail/tram)<br />
closer than the nearest railway station<br />
(ClosSta IN [LU, Metro, Lrail, Tram])<br />
AND IF the time it would take to take<br />
the bus to the nearest tube (London<br />
Underground/metro/light rail/tram) stop<br />
is not known (BusTube = DK) THEN<br />
BanTBus<br />
"SHOW CARD D2.<br />
Taking your answer from this card,<br />
approximately how long would it take<br />
(me) (to get to your nearest ^tubetxt<br />
stop by bus)?<br />
INTERVIEWER: IF DK, ENCOURAGE<br />
ESTIMATE<br />
IF BOTH CODE 6 AND 7 APPLY,<br />
USE CODE 7. (EXTRA INT.<br />
INSTRUCTION ADDED <strong>2003</strong><br />
ONWARDS)"<br />
1. "6 minutes or less"<br />
2. "7-13 minutes"<br />
3. "14-26 minutes"<br />
4. "27-43 minutes"<br />
5. "44 minutes or longer"<br />
6. "Quicker to walk"<br />
7. "No convenient bus service"<br />
BAmenity / QAMENITY.NTS<br />
ASK ALWAYS<br />
IntroA<br />
"I would now like to ask you some<br />
questions about how long it would take<br />
(me) to WALK from here to each of the<br />
following places.<br />
INTERVIEWER: ASSUME AN<br />
AVERAGE WALK RATE OF 3MPH<br />
(5KPH)"<br />
1. "Press 1 and to continue."<br />
Module A ASK ALWAYS<br />
DocWalk<br />
"How long would it take (me) to walk to<br />
your doctor's surgery?<br />
IF TOO FAR TO WALK, PROBE: If<br />
you DID walk, how long would it take?<br />
INTERVIEWER: IF GREATER THAN<br />
97 MINUTES CODE 97<br />
National Centre for Social Research<br />
212<br />
(HELP )(HELPNOTE ADDED<br />
<strong>2003</strong> ONWARDS)"<br />
Module A IF the time it would take to<br />
walk to the doctor’s surgery is not<br />
known (DocWalk = DK) THEN<br />
BanDoc<br />
"SHOW CARD D1<br />
Taking your answer from this card,<br />
approximately how long would it take<br />
(me) (to walk to your doctor's<br />
surgery)?<br />
INTERVIEWER: IF DK ENCOURAGE<br />
ESTIMATE."<br />
1. "6 minutes or less"<br />
2. "7-13 minutes"<br />
3. "14-26 minutes"<br />
4. "27-43 minutes"<br />
5. "44 minutes or longer"<br />
Module B ASK ALWAYS<br />
POWalk<br />
"(How long would it take (me) to walk<br />
to...) the nearest Post Office?<br />
IF TOO FAR TO WALK, PROBE: If<br />
you DID walk, how long would it take?<br />
INTERVIEWER: IF GREATER THAN<br />
97 MINUTES CODE 97<br />
(HELP )(HELPNOTE ADDED<br />
<strong>2003</strong> ONWARDS)"<br />
Module B IF the time it would take to<br />
walk to the nearest Post Office is not<br />
known (POWalk = DK) THEN<br />
BanPO<br />
"SHOW CARD D1<br />
Taking your answer from this card,<br />
approximately how long would it take<br />
(me) (to walk to the nearest Post<br />
Office)?<br />
INTERVIEWER: IF DK ENCOURAGE<br />
ESTIMATE."<br />
1. "6 minutes or less"<br />
2. "7-13 minutes"<br />
3. "14-26 minutes"<br />
4. "27-43 minutes"<br />
5. "44 minutes or longer"
Module A ASK ALWAYS<br />
ChemWalk<br />
"(How long would it take (me) to walk<br />
to...) the nearest chemist?<br />
IF TOO FAR TO WALK, PROBE: If<br />
you DID walk, how long would it take?<br />
INTERVIEWER: IF GREATER THAN<br />
97 MINUTES CODE 97<br />
(HELP )(HELPNOTE ADDED<br />
<strong>2003</strong> ONWARDS)"<br />
Module A IF the time it would take to<br />
walk to the nearest chemist is not<br />
known (ChemWalk = DK) THEN<br />
BanChem<br />
"SHOW CARD D1<br />
Taking your answer from this card,<br />
approximately how long would it take<br />
(me) (to walk to the nearest chemist)?<br />
INTERVIEWER: IF DK ENCOURAGE<br />
ESTIMATE."<br />
1. "6 minutes or less"<br />
2. "7-13 minutes"<br />
3. "14-26 minutes"<br />
4. "27-43 minutes"<br />
5. "44 minutes or longer"<br />
ASK ALWAYS<br />
GrocWalk<br />
"(How long would it take (me) to walk<br />
to...) the nearest shop selling<br />
groceries?<br />
IF TOO FAR TO WALK, PROBE: If<br />
you DID walk, how long would it take?<br />
INTERVIEWER: IF GREATER THAN<br />
97 MINUTES CODE 97<br />
(HELP )(HELPNOTE ADDED<br />
<strong>2003</strong> ONWARDS)"<br />
IF the time it would take to walk to the<br />
nearest shop selling groceries is not<br />
known (GrocWalk) THEN<br />
BanGroc<br />
"SHOW CARD D1<br />
Taking your answer from this card,<br />
approximately how long would it take<br />
(me) (to walk to the nearest shop<br />
selling groceries)?<br />
National Centre for Social Research<br />
213<br />
INTERVIEWER: IF DK ENCOURAGE<br />
ESTIMATE."<br />
1. "6 minutes or less"<br />
2. "7-13 minutes"<br />
3. "14-26 minutes"<br />
4. "27-43 minutes"<br />
5. "44 minutes or longer"<br />
Module B ASK ALWAYS<br />
SCenWalk<br />
"(How long would it take (me) to walk<br />
to...) the nearest main shopping<br />
centre?<br />
IF TOO FAR TO WALK, PROBE: If<br />
you DID walk, how long would it take?<br />
INTERVIEWER: IF GREATER THAN<br />
97 MINUTES CODE 97 HELP ."<br />
Module B IF the time it would take to<br />
walk to the nearest main shopping<br />
centre is not known (ScenWalk = DK)<br />
THEN<br />
BanSCen<br />
"SHOW CARD D1<br />
Taking your answer from this card,<br />
approximately how long would it take<br />
(me) (to walk to the nearest shopping<br />
centre)?<br />
INTERVIEWER: IF DK ENCOURAGE<br />
ESTIMATE."<br />
1. "6 minutes or less"<br />
2. "7-13 minutes"<br />
3. "14-26 minutes"<br />
4. "27-43 minutes"<br />
5. "44 minutes or longer"<br />
Module A ASK ALWAYS<br />
HospWalk<br />
"(How long would it take (me) to walk<br />
to...) the nearest hospital providing<br />
general treatment?<br />
IF TOO FAR TO WALK, PROBE: If<br />
you DID walk, how long would it take?<br />
INTERVIEWER: IF GREATER THAN<br />
97 MINUTES CODE 97<br />
(HELP )(HELPNOTE ADDED<br />
<strong>2003</strong> ONWARDS)<br />
NOTE: The hospital does not need to<br />
have an Accident & Emergency
department but should have an outpatients.<br />
Exclude private, 'cottage' and<br />
specialist hospitals."<br />
Module A IF the time it would take to<br />
walk to the nearest hospital is not<br />
known (HospWalk = DK) THEN<br />
BanHosp<br />
"SHOW CARD D1<br />
Taking your answer from this card,<br />
approximately how long would it take<br />
(me) (to walk to the nearest hospital)?<br />
INTERVIEWER: IF DK ENCOURAGE<br />
ESTIMATE."<br />
1. "6 minutes or less"<br />
2. "7-13 minutes"<br />
3. "14-26 minutes"<br />
4. "27-43 minutes"<br />
5. "44 minutes or longer"<br />
ASK ALWAYS<br />
IntroB<br />
"I would now like to ask how long it<br />
would take to get to each of those<br />
places BY BUS. Please include<br />
walking to and from the bus stop but<br />
assume there is no waiting time."<br />
1. "Press 1 and to continue."<br />
Module A ASK ALWAYS<br />
DocBus<br />
"How long would it take (me) to go by<br />
bus to your doctor's surgery?<br />
RECORD NORMAL JOURNEY TIME,<br />
TO NEAREST MINUTE.<br />
DO NOT INCLUDE ONE-OFF<br />
DELAYS.<br />
NOTES: IF RESPONDENT DOES<br />
NOT KNOW, ENTER AND<br />
ENCOURAGE ESTIMATE AT NEXT<br />
QUESTION.<br />
IF QUICKER TO WALK, ENTER<br />
AND CODE 6 AT NEXT<br />
QUESTION<br />
IF NO CONVENIENT BUS SERVICE,<br />
ENTER AND CODE 7 AT<br />
NEXT QUESTION (HELP )."<br />
National Centre for Social Research<br />
214<br />
Module A IF the time it would take to<br />
take a bus to the nearest doctor is not<br />
known (DocBus = DK) THEN<br />
BanDocB<br />
"SHOW CARD D2<br />
Taking your answer from this card,<br />
approximately how long would it take<br />
(me) (to go by bus to your doctor's<br />
surgery)?<br />
INTERVIEWER: IF DK ENCOURAGE<br />
ESTIMATE<br />
IF BOTH CODE 6 AND 7 APPLY,<br />
USE CODE 7.(EXTRA INT.<br />
INSTRUCTION ADDED <strong>2003</strong><br />
ONWARDS)"<br />
1. "6 minutes or less"<br />
2. "7-13 minutes"<br />
3. "14-26 minutes"<br />
4. "27-43 minutes"<br />
5. "44 minutes or longer"<br />
6. "Quicker to walk"<br />
7. "No convenient bus service"<br />
Module B ASK ALWAYS<br />
POBus<br />
"How long would it take (me) to go by<br />
bus to the nearest Post Office?<br />
RECORD NORMAL JOURNEY TIME,<br />
TO NEAREST MINUTE.<br />
DO NOT INCLUDE ONE-OFF<br />
DELAYS.<br />
NOTES: IF RESPONDENT DOES<br />
NOT KNOW, ENTER AND<br />
ENCOURAGE ESTIMATE AT NEXT<br />
QUESTION.<br />
IF QUICKER TO WALK, ENTER<br />
AND CODE 6 AT NEXT<br />
QUESTION<br />
IF NO CONVENIENT BUS SERVICE,<br />
ENTER AND CODE 7 AT<br />
NEXT QUESTION (HELP )."<br />
Module B IF the time it would take to<br />
take a bus to the nearest Post Office is<br />
not known (POBus = DK) THEN<br />
BanPOB<br />
"SHOW CARD D2<br />
Taking your answer from this card,<br />
approximately how long would it take
(me) (to go by bus to the nearest Post<br />
Office)?<br />
INTERVIEWER: IF DK ENCOURAGE<br />
ESTIMATE<br />
IF BOTH CODE 6 AND 7 APPLY,<br />
USE CODE 7.(EXTRA INT.<br />
INSTRUCTION ADDED <strong>2003</strong><br />
ONWARDS)"<br />
1. "6 minutes or less"<br />
2. "7-13 minutes"<br />
3. "14-26 minutes"<br />
4. "27-43 minutes"<br />
5. "44 minutes or longer"<br />
6. "Quicker to walk"<br />
7. "No convenient bus service"<br />
Module A ASK ALWAYS<br />
ChemBus<br />
"(How long would it take (me) to go by<br />
bus to) the nearest chemist?<br />
RECORD NORMAL JOURNEY TIME,<br />
TO NEAREST MINUTE.<br />
DO NOT INCLUDE ONE-OFF<br />
DELAYS.<br />
NOTES: IF RESPONDENT DOES<br />
NOT KNOW, ENTER AND<br />
ENCOURAGE ESTIMATE AT NEXT<br />
QUESTION.<br />
IF QUICKER TO WALK, ENTER<br />
AND CODE 6 AT NEXT<br />
QUESTION<br />
IF NO CONVENIENT BUS SERVICE,<br />
ENTER AND CODE 7 AT<br />
NEXT QUESTION (HELP )."<br />
Module A IF the time it would take to<br />
take a bus to the nearest chemist is<br />
not known (ChemBus = DK) THEN<br />
BanChemB<br />
"SHOW CARD D2<br />
Taking your answer from this card,<br />
approximately how long would it take<br />
(me) (to go by bus to the nearest<br />
chemist)?<br />
INTERVIEWER: IF DK ENCOURAGE<br />
ESTIMATE<br />
IF BOTH CODE 6 AND 7 APPLY,<br />
USE CODE 7.(EXTRA INT.<br />
INSTRUCTION ADDED <strong>2003</strong><br />
ONWARDS)"<br />
National Centre for Social Research<br />
215<br />
1. "6 minutes or less"<br />
2. "7-13 minutes"<br />
3. "14-26 minutes"<br />
4. "27-43 minutes"<br />
5. "44 minutes or longer"<br />
6. "Quicker to walk"<br />
7. "No convenient bus service"<br />
ASK ALWAYS<br />
GrocBus<br />
"(How long would it take (me) to go by<br />
bus to) the nearest shop selling<br />
groceries<br />
RECORD NORMAL JOURNEY TIME,<br />
TO NEAREST MINUTE.<br />
DO NOT INCLUDE ONE-OFF<br />
DELAYS.<br />
NOTES: IF RESPONDENT DOES<br />
NOT KNOW, ENTER AND<br />
ENCOURAGE ESTIMATE AT NEXT<br />
QUESTION.<br />
IF QUICKER TO WALK, ENTER<br />
AND CODE 6 AT NEXT<br />
QUESTION<br />
IF NO CONVENIENT BUS SERVICE,<br />
ENTER AND CODE 7 AT<br />
NEXT QUESTION (HELP )."<br />
IF the time it would take to take a bus<br />
to the nearest shop selling groceries is<br />
not known (GrocBus = DK) THEN<br />
BanGrocB<br />
"SHOW CARD D2<br />
Taking your answer from this card,<br />
approximately how long would it take<br />
(me) (to go by bus to the nearest shop<br />
selling groceries)?<br />
INTERVIEWER: IF DK ENCOURAGE<br />
ESTIMATE<br />
IF BOTH CODE 6 AND 7 APPLY,<br />
USE CODE 7.(EXTRA INT.<br />
INSTRUCTION ADDED <strong>2003</strong><br />
ONWARDS)"<br />
1. "6 minutes or less"<br />
2. "7-13 minutes"<br />
3. "14-26 minutes"<br />
4. "27-43 minutes"<br />
5. "44 minutes or longer"<br />
6. "Quicker to walk"<br />
7. "No convenient bus service"
Module B ASK ALWAYS<br />
ScenBus<br />
"(How long would it take (me) to go by<br />
bus to) the nearest main shopping<br />
centre?<br />
RECORD NORMAL JOURNEY TIME,<br />
TO NEAREST MINUTE.<br />
DO NOT INCLUDE ONE-OFF<br />
DELAYS.<br />
NOTES: IF RESPONDENT DOES<br />
NOT KNOW, ENTER AND<br />
ENCOURAGE ESTIMATE AT NEXT<br />
QUESTION.<br />
IF QUICKER TO WALK, ENTER<br />
AND CODE 6 AT NEXT<br />
QUESTION<br />
IF NO CONVENIENT BUS SERVICE,<br />
ENTER AND CODE 7 AT<br />
NEXT QUESTION (HELP )."<br />
Module B IF the time it would take to<br />
take a bus to the nearest main<br />
shopping centre is not known<br />
(SCenBus = DK) THEN<br />
BanSCenB<br />
"SHOW CARD D2<br />
Taking your answer from this card,<br />
approximately how long would it take<br />
(me) (to go by bus to the nearest<br />
shopping centre)?<br />
INTERVIEWER: IF DK ENCOURAGE<br />
ESTIMATE<br />
IF BOTH CODE 6 AND 7 APPLY,<br />
USE CODE 7.(EXTRA INT.<br />
INSTRUCTION ADDED <strong>2003</strong><br />
ONWARDS)"<br />
1. "6 minutes or less"<br />
2. "7-13 minutes"<br />
3. "14-26 minutes"<br />
4. "27-43 minutes"<br />
5. "44 minutes or longer"<br />
6. "Quicker to walk"<br />
7. "No convenient bus service"<br />
Module A ASK ALWAYS<br />
HospBus<br />
National Centre for Social Research<br />
216<br />
"(How long would it take (me) to go by<br />
bus to) the nearest hospital providing<br />
general treatment?<br />
RECORD NORMAL JOURNEY TIME,<br />
TO NEAREST MINUTE.<br />
DO NOT INCLUDE ONE-OFF<br />
DELAYS.<br />
NOTES: IF RESPONDENT DOES<br />
NOT KNOW, ENTER AND<br />
ENCOURAGE ESTIMATE AT NEXT<br />
QUESTION.<br />
IF QUICKER TO WALK, ENTER<br />
AND CODE 6 AT NEXT<br />
QUESTION<br />
IF NO CONVENIENT BUS SERVICE,<br />
ENTER AND CODE 7 AT<br />
NEXT QUESTION (HELP )."<br />
Module A IF the time it would take to<br />
take a bus to the nearest hospital is<br />
not known (HospBus = DK) THEN<br />
BanHospB<br />
"SHOW CARD D2<br />
Taking your answer from this card,<br />
approximately how long would it take<br />
(me) (to go by bus to the nearest<br />
hospital)?<br />
INTERVIEWER: IF DK ENCOURAGE<br />
ESTIMATE<br />
IF BOTH CODE 6 AND 7 APPLY,<br />
USE CODE 7.(EXTRA INT.<br />
INSTRUCTION ADDED <strong>2003</strong><br />
ONWARDS)"<br />
1. "6 minutes or less"<br />
2. "7-13 minutes"<br />
3. "14-26 minutes"<br />
4. "27-43 minutes"<br />
5. "44 minutes or longer"<br />
6. "Quicker to walk"<br />
7. "No convenient bus service"<br />
ASK ALWAYS<br />
Order<br />
"SHOW CARD E1.<br />
I'd now like to ask a few questions<br />
about things which your household<br />
might have had delivered.<br />
Nowadays, does anyone in your<br />
household (do you) ever order any of<br />
these things over the phone, by post<br />
or on the internet?
CODE ALL THAT APPLY<br />
(HELP )(HELPNOTE ADDED<br />
<strong>2003</strong> ONWARDS)"<br />
1. "Food and drink (not including take<br />
away meals)"<br />
2. "Clothes"<br />
3. "Books/CDs/software"<br />
4. "Furniture"<br />
5. "Holiday/travel tickets"<br />
6. "Any other tickets (not for travel)"<br />
97. "Anything else"<br />
98. "None of these"<br />
(PRECODES CHANGED <strong>2003</strong><br />
ONWARDS TO:)<br />
1. "Food and drink (not including take<br />
away meals)"<br />
2. "Clothes"<br />
3. "Books/CDs/software"<br />
4. "Furniture"<br />
5. "Holiday/travel tickets"<br />
6. "Any other tickets (not for travel)"<br />
7. "Plants/bulbs/flowers"<br />
8. "Health Goods"<br />
97. "Anything else"<br />
98. "None of these"<br />
IF Household orders deliveries by<br />
phone, post or the internet ((Order =<br />
Response) AND NOT (None IN<br />
Order)) THEN<br />
Deliv<br />
"SHOW CARD E2.<br />
Can you tell me how often you or<br />
anyone in your household has any of<br />
these things delivered, which have<br />
been ordered by phone, by post or on<br />
the internet? (HELP )<br />
ONLY INCLUDE THINGS FOR<br />
DOMESTIC USE<br />
EXCLUDE<br />
LETTERS/MILK/NEWSPAPERS/MAG<br />
AZINES and TAKE AWAY MEALS "<br />
1. "3 or more times a week"<br />
2. "Once or twice a week"<br />
3. "Less than that but more than<br />
twice a month"<br />
4. "Once or twice a month"<br />
5. "Less than that but more than<br />
twice a year"<br />
National Centre for Social Research<br />
217<br />
6. "Once or twice a year"<br />
7. "Less than once a year"<br />
IF Household orders deliveries by<br />
phone, post or the internet ((Order =<br />
Response) AND NOT (None IN<br />
Order)) AND Household has deliveries<br />
more than once a year (Deliv IN<br />
[Wkly3…Yearly1]) THEN<br />
LastD<br />
"SHOW CARD E1.<br />
What was the last delivery of this sort<br />
that your household (you) received?<br />
CODE ALL THAT APPLY"<br />
1. "Food and drink (not including take<br />
away meals)"<br />
2. "Clothes"<br />
3. "Books/CDs/software"<br />
4. "Furniture"<br />
5. "Holiday/travel tickets"<br />
6. "Any other tickets (not for travel)"<br />
97. "Anything else (specify)"<br />
(PRECODES CHANGED <strong>2003</strong><br />
ONWARDS TO:)<br />
1. "Food and drink (not including take<br />
away meals)"<br />
2. "Clothes"<br />
3. "Books/CDs/software"<br />
4. "Furniture"<br />
5. "Holiday/travel tickets"<br />
6. "Any other tickets (not for travel)"<br />
7. "Plants/bulbs/flowers"<br />
8. "Health Goods"<br />
97. "Anything else (specify)"<br />
IF Household orders deliveries by<br />
phone, post or the internet ((Order =<br />
Response) AND NOT (None IN<br />
Order)) AND last delivery was<br />
‘anything else’ (LastD=Other) THEN<br />
XLastD<br />
"Please specify other answer.<br />
TEXT SHOULD BE NO MORE THAN<br />
60 CHARACTERS"<br />
IF Household orders deliveries by<br />
phone, post or the internet ((Order =<br />
Response) AND NOT (None IN
Order)) AND Household has deliveries<br />
more than once a year (Deliv IN<br />
[Wkly3…Yearly1]) AND IF the last<br />
delivery can be coded at LastD(LastD<br />
= Response) THEN<br />
HowOrd<br />
"And was this ordered by phone, by<br />
post or on the internet?"<br />
1. "by phone"<br />
2. "by post"<br />
3. "on the internet"<br />
IF Household orders deliveries by<br />
phone, post or the internet ((Order =<br />
Response) AND NOT (None IN<br />
Order)) AND Household has deliveries<br />
more than once a year (Deliv IN<br />
[Wkly3…Yearly1]) AND IF the last<br />
delivery can be coded at LastD (LastD<br />
= Response) AND IF the delivery was<br />
ordered by phone, by post or on the<br />
Internet (HowOrd IN [Phone…IntNet])<br />
THEN<br />
HowB<br />
"SHOW CARD E3.<br />
And if you had not ordered this<br />
^HowOTxt, how do you think you<br />
would have bought it?<br />
CODE ONE ONLY<br />
IF MORE THAN ONE ANSWER,<br />
PROBE FOR MOST LIKELY<br />
METHOD"<br />
1. "In person e.g. from a shop or<br />
travel agent"<br />
2. "By phone"<br />
3. "By post"<br />
4. "On the internet"<br />
5. "By fax"<br />
6. "On the doorstep"<br />
7. "Would have asked someone else<br />
to buy it in person"<br />
8. "Would not have bought it"<br />
97. "Other (Specify)"<br />
(PRECODES CHANGED <strong>2003</strong><br />
ONWARDS TO:)<br />
1. "In person e.g. from a shop or<br />
travel agent, railway station etc."<br />
2. "By phone"<br />
3. "By post"<br />
4. "On the internet"<br />
National Centre for Social Research<br />
218<br />
5. "By fax"<br />
6. "On the doorstep"<br />
7. "Would have asked someone else<br />
to buy it in person"<br />
8. "Would not have bought it"<br />
97. "Other (Specify)"<br />
IF Household orders deliveries by<br />
phone, post or the internet ((Order =<br />
Response) AND NOT (None IN<br />
Order)) AND Household has deliveries<br />
more than once a year (Deliv IN<br />
[Wkly3…Yearly1]) AND IF the last<br />
delivery can be coded at LastD (LastD<br />
= Response) AND IF the delivery was<br />
ordered by phone, by post or on the<br />
Internet (HowOrd IN [Phone…IntNet])<br />
AND HRP would have bought it some<br />
other way (HowB=other) THEN<br />
XHowB<br />
"Please specify other reasons.<br />
TEXT SHOULD BE NO MORE THAN<br />
60 CHARACTERS"<br />
ASK ALWAYS<br />
WhoShop<br />
"Can I check, who does the main food<br />
shopping for your household?<br />
NOTE: IF DOES NOT TRAVEL TO<br />
DO FOOD SHOPPING (E.G.<br />
INTERNET SHOPPING, GETS<br />
SHOPPING DELIVERED) THEN USE<br />
CODE 12.<br />
CODE ALL THAT APPLY"<br />
1. "^Shopper[1]"<br />
2. "^Shopper[2]"<br />
3. "^Shopper[3]"<br />
4. "^Shopper[4]"<br />
5. "^Shopper[5]"<br />
6. "^Shopper[6]"<br />
7. "^Shopper[7]"<br />
8. "^Shopper[8]"<br />
9. "^Shopper[9]"<br />
10. "^Shopper[10]"<br />
11. "Non-household member"<br />
12. "Household does not do food<br />
shopping"
IF more than one person does the<br />
food shopping (whoshop >1) THEN<br />
ShopOft<br />
"And which one person does the main<br />
food shopping most often? Is it<br />
^ShopTxt?<br />
INTERVIEWER: If respondent says all<br />
or equal prompt for who did main food<br />
shopping by themselves most recently.<br />
Otherwise ask respondent to nominate<br />
person to answer later questions about<br />
shopping.<br />
CODE ONE ONLY"<br />
1. "^Shopper[1]"<br />
2. "^Shopper[2]"<br />
3. "^Shopper[3]"<br />
4. "^Shopper[4]"<br />
5. "^Shopper[5]"<br />
6. "^Shopper[6]"<br />
7. "^Shopper[7]"<br />
8. "^Shopper[8]"<br />
9. "^Shopper[9]"<br />
10. "^Shopper[10]"<br />
IF the household does not do food<br />
shopping (None IN WhoShop) THEN<br />
YNoShop<br />
"Why is this?<br />
CODE ALL THAT APPLY"<br />
1. "Delivered by shop"<br />
2. "Most food from meals on<br />
wheels/day centre/restaurant etc."<br />
97. "Other reason (specify)"<br />
IF ‘other reason’ why household does<br />
not do food shopping (Other IN<br />
YNoShop)THEN<br />
XYNoShop<br />
"Please specify other reasons.<br />
TEXT SHOULD BE NO MORE THAN<br />
60 CHARACTERS"<br />
TChTrav / QTCHTRAV.NTS]<br />
BchTrav<br />
Questions asked if :<br />
Any individual household member is<br />
aged 7- 13, asked for each member<br />
in turn, answered by HRP or another<br />
respondent aged 16 or over<br />
National Centre for Social Research<br />
219<br />
IF HRP has child/ren THEN<br />
SchInt<br />
"I'd now like to ask a few questions<br />
about your/the ^children's journey to<br />
and from school."<br />
1. "Press 1 and to continue."<br />
IF HRP has child/ren THEN<br />
SchDly<br />
"Does ^Name make a daily journey to<br />
and from school?"<br />
1. "Makes daily journey"<br />
2. "No daily journey (e.g. educated at<br />
home/boarding school)"<br />
IF HRP’s child makes a daily journey<br />
to and from school (SchDly = Daily)<br />
THEN<br />
SchFar<br />
"How far is it from your home to<br />
^Name's school?<br />
FIRST ENTER UNIT OF<br />
MEASUREMENT.<br />
INTERVIEWER: USE MILES OR<br />
KILOMETERS FOR LONGER<br />
DISTANCES"<br />
1. "Minutes Walk"<br />
2. "Miles"<br />
3. "Kilometres"<br />
4. "Yards"<br />
5. "Metres"<br />
(PRECODES CHANGED <strong>2004</strong><br />
ONWARDS TO:)<br />
1. "Miles"<br />
2. "Kilometres"<br />
3. "Yards"<br />
4. "Metres"<br />
IF HRP’s child makes a daily journey<br />
to and from school (SchDly =<br />
Daily)AND IF distance to child’s school<br />
can be measured by ‘minutes walk’<br />
(SchFar = Mins) THEN<br />
SchMins<br />
"NOW ENTER DISTANCE IN<br />
MINUTES WALKING TIME"
SchMins (QUESTION DELETED <strong>2004</strong><br />
ONWARDS)<br />
IF HRP’s child makes a daily journey<br />
to and from school (SchDly = Daily)<br />
AND IF distance to child’s school is<br />
measured by miles (SchFar = Miles)<br />
THEN<br />
SchMil<br />
"NOW ENTER DISTANCE IN MILES"<br />
IF HRP’s child makes a daily journey<br />
to and from school (SchDly = Daily)<br />
AND IF distance to child’s school is<br />
measured by kilometres (SchFar =<br />
KM) THEN<br />
SchKm<br />
"NOW ENTER DISTANCE IN<br />
KILOMETRES"<br />
IF HRP’s child makes a daily journey<br />
to and from school (SchDly = Daily)<br />
AND IF distance to child’s school is<br />
measured by yards (Schfar = Yards)<br />
THEN<br />
SchYard<br />
"NOW ENTER DISTANCE IN YARDS"<br />
IF HRP’s child makes a daily journey<br />
to and from school (SchDly = Daily)<br />
AND IF distance to child’s school is<br />
measured by metres (SchFar =<br />
Metres) THEN<br />
SchM<br />
"NOW ENTER DISTANCE IN<br />
METRES"<br />
IF HRP’s child makes a daily journey<br />
to and from school (SchDly = Daily)<br />
THEN<br />
TravSc<br />
"And how does ^Name usually travel<br />
to school? (HELP )<br />
CODE ONE ONLY, FOR THE<br />
LONGEST PART, BY DISTANCE, OF<br />
THE CHILD'S USUAL JOURNEY TO<br />
SCHOOL<br />
National Centre for Social Research<br />
220<br />
IF DIFFERENT METHOD USED TO<br />
AND FROM SCHOOL, CODE<br />
METHOD TO SCHOOL. (EXTRA INT.<br />
INSTRUCTION ADDED <strong>2003</strong><br />
ONWARDS)"<br />
1. "Underground, metro, light rail,<br />
tram"<br />
2. "Train"<br />
3. "Public bus, minibus or coach"<br />
4. "School or local authority bus,<br />
minibus or coach"<br />
5. "Motorcycle, scooter or moped"<br />
6. "Car or van"<br />
7. "Taxi/minicab"<br />
8. "Bicycle"<br />
9. "On foot"<br />
97. "Other (specify)"<br />
IF child travels to school by ‘other’<br />
method (TravSc=Other) THEN<br />
XTravSc<br />
"Please specify other answer.<br />
TEXT SHOULD BE NO MORE THAN<br />
60 CHARACTERS"<br />
IF HRP’s child makes a daily journey<br />
to and from school (SchDly = Daily)<br />
THEN<br />
AccAd<br />
"When ^Name travels to or from<br />
school is he/she ...READ OUT...<br />
NOTE: BUS DRIVERS DO NOT<br />
COUNT AS AN ACCOMPANYING<br />
ADULT"<br />
1. "...usually accompanied by an<br />
adult,"<br />
2. "not usually accompanied by an<br />
adult,"<br />
3. "or sometimes accompanied and<br />
sometimes not?"<br />
4. "(part of way accompanied, part of<br />
way not)"<br />
IF HRP’s child makes a daily journey<br />
to and from school (SchDly = Daily)<br />
AND IF child is accompanied to school<br />
by an adult (AccAd = Acc) THEN<br />
NotAlw1<br />
"SHOW CARD F
What are the reasons ^Name does not<br />
usually travel to and from school on<br />
his/her own?<br />
CODE ALL THAT APPLY.<br />
IF TOO YOUNG, PROBE: Why do you<br />
think he/she's too young?"<br />
1. "Traffic danger"<br />
2. "Child might get lost/doesn't know<br />
the way"<br />
3. "Child might not arrive (on time)"<br />
4. "Fear of assault/molestation by an<br />
adult"<br />
5. "Fear of bullying by other children"<br />
6. "School too far away"<br />
97. "Other reason (specify)"<br />
IF there is another reason why child<br />
does not usually travel to and from<br />
school on their own (NotAlw1 = other)<br />
THEN<br />
XnotAlw1<br />
"Please specify other reasons.<br />
TEXT SHOULD BE NO MORE THAN<br />
60 CHARACTERS"<br />
IF HRP’s child makes a daily journey<br />
to and from school (SchDly = Daily)<br />
AND IF child is not usually<br />
accompanied or sometimes<br />
accompanied sometimes not (AccAd<br />
IN [NotAcc, SomeAcc]) THEN<br />
AgeAlw<br />
"At what age did ^Name first travel to<br />
or from school without an adult?<br />
ENTER AGE FIRST DID THIS, EVEN<br />
IF DID NOT ALWAYS TRAVEL<br />
UNACCOMPANIED AT THAT AGE"<br />
IF HRP’s child makes a daily journey<br />
to and from school (SchDly = Daily)<br />
AND IF child is not usually<br />
accompanied or sometimes<br />
accompanied sometimes not (AccAd<br />
IN [NotAcc, SomeAcc]) AND IF the<br />
age of when the child first travelled to<br />
or from school without an adult is<br />
given (AgeALw = Response) THEN<br />
NotAlw2<br />
"SHOW CARD F<br />
National Centre for Social Research<br />
221<br />
What were the reasons ^Name was<br />
not allowed to travel on his/her own<br />
before then?<br />
CODE ALL THAT APPLY<br />
IF TOO YOUNG, PROBE: Why do<br />
you think he/she was too young?"<br />
1. "Traffic danger"<br />
2. "Child might get lost/doesn't know<br />
the way"<br />
3. "Child might not arrive (on time)"<br />
4. "Fear of assault/molestation by an<br />
adult"<br />
5. "Fear of bullying by other children"<br />
6. "School too far away"<br />
97. "Other reason (specify)"<br />
IF there is another reason why the<br />
child was not allowed to travel on their<br />
own before then (NotAlw2= other)<br />
THEN<br />
XNotAlw2<br />
"Please specify other reasons.<br />
TEXT SHOULD BE NO MORE THAN<br />
60 CHARACTERS"<br />
ASK ALWAYS<br />
Roads<br />
"Is ^Name ever allowed to cross roads<br />
without being accompanied by an<br />
adult?<br />
IF YES, PROBE: Is that always or<br />
sometimes?<br />
NOTE: IF ONLY ALLOWED TO<br />
CROSS SOME ROADS, CODE<br />
'SOMETIMES'"<br />
1. "Yes, (almost) always"<br />
2. "Yes, sometimes/depends"<br />
3. "No, never"<br />
IF HRP’s child is always or sometimes<br />
allowed to cross roads without being<br />
accompanied by an adult (Roads IN<br />
[Always, Some]) THEN<br />
MainRd<br />
"And is ^Name allowed to cross main<br />
roads or only minor roads?"<br />
1. "Main roads"<br />
2. "Only minor roads"
BVehNum / QVEHNUM.NTS<br />
ASK ALWAYS<br />
IchEmp<br />
"INTERVIEWER: ASK OR RECORD<br />
May I just check is anyone in this<br />
household (are you) in paid<br />
employment?<br />
NOTE: INCLUDE SELF-<br />
EMPLOYMENT"<br />
1. "Yes (Someone in household<br />
working)"<br />
2. "No-one in household working"<br />
IF Household member is in paid<br />
employment (IchEmp = Yes) THEN<br />
CarPool<br />
" Some companies have a car-pool<br />
from which employees take a car<br />
when they need one. Does your<br />
household use cars from a company<br />
car-pool?<br />
NOTE: AS A DRIVER<br />
(HELP )(HELPNOTE ADDED<br />
<strong>2003</strong> ONWARDS)"<br />
1. "Yes"<br />
2. "No"<br />
ASK ALWAYS<br />
UseVcl<br />
"SHOW CARD H1<br />
Do you, or any members of your<br />
household, at present own or have<br />
continuous use of any motor vehicles?<br />
Please choose your answer from this<br />
card.<br />
INCLUDE COMPANY CARS (IF<br />
AVAILABLE FOR PRIVATE USE)"<br />
1. "Yes"<br />
2. "No"<br />
(CHANGED <strong>2004</strong> ONWARDS TO:)<br />
"SHOW CARD H1<br />
Do you, or any members of your<br />
household, at present own or have<br />
continuous use of any of the motor<br />
vehicles listed on this card?<br />
Please choose your answer from this<br />
card.<br />
National Centre for Social Research<br />
222<br />
INCLUDE COMPANY CARS (IF<br />
AVAILABLE FOR PRIVATE USE)"<br />
1. "Yes"<br />
2. "No"<br />
ASK ALWAYS<br />
BrokenV<br />
"And are there any other motor<br />
vehicles which are broken down or not<br />
in use but which your household may<br />
begin to use in the next month?<br />
(HELP )(HELPNOTE ADDED<br />
<strong>2003</strong> ONWARDS)"<br />
1. "Yes"<br />
2. "No"<br />
IF household has continuous use of<br />
motor vehicle OR there are broken<br />
vehicles which may be used in the<br />
next month ((UseVcl= Yes) OR<br />
(BrokenV=Yes))THEN<br />
NoPlveh<br />
"NUMBER OF VEHICLES<br />
^LVehNum1<br />
INTERVIEWER: INCLUDE ANY<br />
BROKEN DOWN VEHICLES WHICH<br />
MAY BE IN USE WITHIN THE NEXT<br />
MONTH BUT EXCLUDE COMPANY<br />
POOL CARS"<br />
(CHANGED <strong>2003</strong> ONWARDS TO:)<br />
How many vehicles does your<br />
household own or have continuous<br />
use of at present?<br />
^LVehNum1<br />
INTERVIEWER: INCLUDE ANY<br />
BROKEN DOWN VEHICLES WHICH<br />
MAY BE IN USE WITHIN THE NEXT<br />
MONTH BUT EXCLUDE COMPANY<br />
POOL CARS"<br />
IF pick up interview is being conducted<br />
(StatusQ=pick up) THEN<br />
NewVeh<br />
"When we completed the main<br />
interview together on<br />
(^QSignin.StartTxt), I asked you about<br />
any vehicles that your household had<br />
regular use of:
(May I just check), have you acquired<br />
the use of any (other) vehicles since<br />
then?<br />
ENTER RESPONSE AND ,<br />
THEN PRESS TO GO TO<br />
THE NEXT PICK-UP QUESTION<br />
SEE HELP SCREEN FOR<br />
HOUSEHOLD VEHICLE<br />
DEFINITION...(HELP )"<br />
1. "Yes"<br />
2. "No"<br />
IF Household has acquired new<br />
vehicle since main interview<br />
(StatusQ=Pick up) AND (NewVeh =<br />
Yes) THEN<br />
NewNo<br />
"How many other vehicles have you<br />
acquired since ^QSignin.StartTxt?<br />
ENTER RESPONSE AND ,<br />
THEN PRESS TO GO TO<br />
NEXT PICK-UP QUESTION"<br />
IF Household has continuous use of<br />
motor vehicle OR there are broken<br />
vehicles which may be used in the<br />
next month OR Household has<br />
acquired new vehicle since main<br />
interview ((UseVcl= Yes) OR<br />
(BrokenV=Yes) OR (NewVeh = Yes))<br />
THEN<br />
NumVeh<br />
"PRECODED. PRESS ENTER TO<br />
CONTINUE"<br />
TVehTab/ QTVEHTAB.NTS<br />
BVehTab<br />
Questions asked of:<br />
Respondent who best knows about<br />
vehicle (normally main driver but not<br />
necessarily) if QVehnum.Numveh><br />
0<br />
IF Household has acquired new<br />
vehicle since main interview (NewVeh<br />
= Yes) THEN<br />
WhenAcq<br />
National Centre for Social Research<br />
223<br />
"When did you acquire the use of your<br />
^LTVehTab1[LTLooper] additional<br />
vehicle?. Was it...READ OUT...<br />
NOTE: Travel Week was from<br />
^QSignIn.TravDate to<br />
^QSignIn.TrEndDat"<br />
1. "...before the start of the Travel<br />
Week,"<br />
2. "during the Travel Week,"<br />
"or, after the end of the Travel Week?"<br />
IF Household has acquired new<br />
vehicle since main interview (NewVeh<br />
= Yes) AND IF Household acquired<br />
new vehicle during the Travel Week or<br />
does not know when they acquired the<br />
vehicle in relation to the Travel Week<br />
((WhenAcq = During) OR (WhenAcq =<br />
DK)) THEN<br />
DateAcq<br />
"Can you tell me the date on which<br />
you acquired the vehicle?"<br />
FOR EACH HOUSEHOLD VEHICLE<br />
Make<br />
"ENTER A DESCRIPTION OF THE<br />
MAKE OF VEHICLE NUMBER<br />
^LTLooper.<br />
E.G. FORD, VAUXHALL, RENAULT,<br />
PEUGEOT"<br />
(CHANGED <strong>2003</strong> ONWARDS TO:)<br />
What is the make of vehicle number<br />
^LTLooper.<br />
E.G. FORD, VAUXHALL, RENAULT,<br />
PEUGEOT"<br />
FOR EACH HOUSEHOLD VEHICLE<br />
Model<br />
"ENTER DESCRIPTION OF THE<br />
MODEL OF VEHICLE NUMBER<br />
^LTLooper.<br />
E.G FIESTA, CLIO, MICRA, 106"<br />
(CHANGED <strong>2003</strong> ONWARDS TO:)<br />
"And the model? ^LTLooper.<br />
E.G FIESTA, CLIO, MICRA, 106"
IF the model is known (Model =<br />
Response) THEN<br />
ModSpec<br />
"ENTER ANY MODEL TYPE OR<br />
SPECIFICATION OF VEHICLE<br />
NUMBER ^LTLooper.<br />
E.G 1.6, XR2i, TURBO, ESTATE,<br />
CONVERTIBLE, 5 DOOR<br />
IT IS IMPORTANT THAT YOU<br />
COLLECT FULL DETAILS ABOUT<br />
THE VEHICLE AS YOU WILL NEED<br />
THIS INFORMATION FOR CODING<br />
LATER IN THE INTERVIEW"<br />
(CHANGED <strong>2003</strong> ONWARDS TO:)<br />
"Is there a model type or specification<br />
for this vehicle? If so enter it here.<br />
^LTLooper.<br />
E.G 1.6, XR2i, TURBO, ESTATE,<br />
CONVERTIBLE, 5 DOOR<br />
IT IS IMPORTANT THAT YOU<br />
COLLECT FULL DETAILS ABOUT<br />
THE VEHICLE AS YOU WILL NEED<br />
THIS INFORMATION FOR CODING<br />
LATER IN THE INTERVIEW"<br />
FOR EACH HOUSEHOLD VEHICLE<br />
VehUse<br />
"CODE WHETHER the ^Make<br />
^Model"<br />
1. "is in regular use,"<br />
2. "may begin to be used in the next<br />
month,"<br />
3. "ONLY ASK AT PICK UP: vehicle<br />
acquired since placement?"<br />
(IMPUTED FROM TypeVcl2 from<br />
<strong>2004</strong> ONWARDS:)<br />
IF household has continuous use of a<br />
motor vehicle/s THEN<br />
TypeVcl<br />
"I would now like to ask about the<br />
^Make ^Model ^ModSpec vehicle. Is<br />
it...READ OUT...<br />
^s^s^s^s^s^s^s^s^s^s^s^s^s^s (HELP<br />
)<br />
CAR INCLUDES MINIBUSES,<br />
MOTOR CARAVANS, 'PEOPLE<br />
CARRIERS' AND 4-WHEEL DRIVE<br />
PASSENGER VEHICLES.<br />
National Centre for Social Research<br />
224<br />
LIGHT VAN INCLUDES PICKUPS<br />
AND THOSE 4-WHEEL DRIVE<br />
VEHICLES, LAND ROVERS AND<br />
JEEPS THAT DO NOT HAVE SIDE<br />
WINDOWS BEHIND THE DRIVER"<br />
1. "a car"<br />
2. "a light van"<br />
3. "a motor cycle"<br />
4. "or some other motor vehicle?"<br />
(IMPUTED FROM TypeVcl2 from<br />
<strong>2004</strong> ONWARDS:)<br />
IF Household vehicle is a car (IF<br />
TypeVcl = Car) THEN<br />
CarType<br />
"ASK OR RECORD: Is the ^Make<br />
^Model a...<br />
INTERVIEWER: '4-WHEEL CAR'<br />
INCLUDES PEOPLE CARRIERS AND<br />
LIGHT VANS WITH SIDE WINDOWS<br />
BEHIND THE DRIVER (1.5 tons<br />
unladen weight or less)<br />
CODE MINIBUSES AND MOTOR<br />
CARAVANS AS '3'.<br />
4-WHEEL DRIVE PASSENGER<br />
VEHICLES (E.G. LAND ROVERS<br />
AND JEEPS) SHOULD BE CODED<br />
AS '3'"<br />
1. "...4-wheel car,"<br />
2. "a 3-wheel vehicle,"<br />
3. "or, some other motor vehicle?"<br />
(CHANGED <strong>2003</strong> ONLY TO:)<br />
"ASK OR RECORD: Is the ^Make<br />
^Model a...<br />
INTERVIEWER: '4-WHEEL CAR'<br />
INCLUDES PEOPLE CARRIERS AND<br />
LIGHT VANS WITH SIDE WINDOWS<br />
BEHIND THE DRIVER(3.5 tons gross<br />
weight or less)<br />
CODE MINIBUSES AND MOTOR<br />
CARAVANS AS '3'.<br />
4-WHEEL DRIVE PASSENGER<br />
VEHICLES (E.G. LAND ROVERS<br />
AND JEEPS) SHOULD BE CODED<br />
AS '3'"<br />
1. "...4-wheel car,"<br />
2. "a 3-wheel vehicle,"<br />
3. "or, some other motor vehicle?"
(IMPUTED FROM TypeVcl2 from<br />
<strong>2004</strong> ONWARDS:)<br />
IF Household vehicle is a motorcycle<br />
(TypeVcl = MotorCycle) THEN<br />
BikeType<br />
"ASK OR RECORD<br />
Is the ^Make ^Model a..."<br />
1. "Motorcycle/scooter with sidecar"<br />
2. "Motorcycle/scooter"<br />
3. "Moped"<br />
(IMPUTED FROM TypeVcl2 from<br />
<strong>2004</strong> ONWARDS:)<br />
IF Household vehicle is another type<br />
of vehicle OR if household car is<br />
another type of car ((TypeVcL =<br />
OtherVehicle) OR (CarType =<br />
OtherC)) THEN<br />
OthType<br />
"ASK OR RECORD<br />
Is the ^Make ^Model a...<br />
INTERVIEWER: 'LIGHT VAN'<br />
INCLUDES PICK-UPS THAT DO NOT<br />
HAVE SIDE WINDOWS BEHIND THE<br />
DRIVER AND INCLUDES MOST<br />
TRANSIT TYPE VANS."<br />
1. "...4-wheel drive passenger vehicle<br />
(e.g. Landrover, Jeep or similar),"<br />
2. "a light van (1.5 tons unladen<br />
weight or less),"<br />
3. "some other type of van or lorry<br />
(more than 1.5 tons unladen weight),"<br />
4. "a minibus, caravan, dormobile<br />
etc,"<br />
5. "or, some other motor vehicle<br />
(SPECIFY)?"<br />
(CHANGED <strong>2003</strong> ONLY TO:)<br />
"ASK OR RECORD<br />
Is the ^Make ^Model a...<br />
INTERVIEWER: 'LIGHT VAN'<br />
INCLUDES PICK-UPS THAT DO NOT<br />
HAVE SIDE WINDOWS BEHIND THE<br />
DRIVER AND INCLUDES MOST<br />
TRANSIT TYPE VANS."<br />
1. "...4-wheel drive passenger vehicle<br />
(e.g. Landrover, Jeep or similar),"<br />
National Centre for Social Research<br />
225<br />
2. "a light van (1.5 tons unladen<br />
weight or less),"<br />
3. "some other type of van or lorry<br />
(more than 3.5 tons gross,"<br />
4. "a minibus, caravan, dormobile<br />
etc,"<br />
5. "or, some other motor vehicle<br />
(SPECIFY)?"<br />
IF household owns some other<br />
vehicle (OthType = other) THEN<br />
XOthType<br />
"INTERVIEWER: Record other type of<br />
motor vehicle"<br />
(QUESTION INTRODUCED IN <strong>2004</strong>:)<br />
IF household has continuous use of a<br />
motor vehicle/s THEN<br />
TypeVcl2<br />
"I would now like to ask about the<br />
^Make ^Model ^ModSpec vehicle. Can<br />
you tell the type of vehicle this is from<br />
the list on this card.<br />
(1) 4-wheel car (side windows behind<br />
driver) (includes Multi Purpose<br />
Vehicles and people carriers<br />
(2) 4-wheel drive passenger vehicle<br />
(side windows behind driver)(eg<br />
Landrover, Jeep or similar)<br />
(3) 3-wheel car (side windows behind<br />
driver)<br />
(4) Minibus, motor-caravan, dormobile<br />
etc (side windows behind driver)<br />
(5) Light van (@Ino side windows<br />
behind driver@I) (includes pick ups<br />
and car based vans<br />
(6) Some other type of van or lorry<br />
(7) Motorcycle/scooter with sidecar<br />
(8) Motorcycle/scooter<br />
(9) Moped<br />
(10) Some other motor vehicle<br />
(SPECIFY)<br />
IF household vehicle is a car<br />
(TypeVcl=car)<br />
(IN <strong>2004</strong>, FILTER CHANGED TO:<br />
TypeVcl2=Wheel4..LightVan)
PrivVcl<br />
"FOR EACH VEHICLE IN TURN<br />
Is the ^Make<br />
^Model...^s^s^s^s^s^s^s^s^s^s^s^s<br />
(HELP )"<br />
1. "privately owned"<br />
2. "or is it a company vehicle?"<br />
IF household vehicle is a company car<br />
(TypeVcl=car & PrivVcl = company)<br />
CompCar<br />
"SHOW CARD H2.<br />
Can I just check which of these<br />
business mileage bands does the car<br />
belong to?"<br />
1. "1-2,499 business miles"<br />
2. "2,500 - 17,999 business miles"<br />
3. "18,000 business miles or more"<br />
4. "NONE OF BANDS APPLY<br />
(SPECIFY)"<br />
CompCar(QUESTION DELETED MID<br />
2002 ONWARDS)<br />
IF none of business mileage bands<br />
apply THEN<br />
XCompCar<br />
"INTERVIEWER: Record here why<br />
none of the Business Mileage Bands<br />
apply"<br />
XCompCar(QUESTION DELETED<br />
MID 2002 ONWARDS)<br />
ASK ALWAYS<br />
HmnDriv<br />
"Who drives the most mileage in the<br />
^Make ^Model (taken over the year as<br />
a whole)?<br />
IF MAIN DRIVER NOT HOUSEHOLD<br />
MEMBER, ENTER 89<br />
^DMADNAME[1](1)^s^s<br />
^DMADNAME[2](2)^s^s<br />
^DMADNAME[3](3)^s^s<br />
^DMADNAME[4](4)^s^s<br />
^DMADNAME[5](5)^s^s<br />
^DMADNAME[6](6)^s^s<br />
^DMADNAME[7](7)^s^s<br />
^DMADNAME[8](8)^s^s<br />
National Centre for Social Research<br />
226<br />
^DMADNAME[9](9)^s^s<br />
^DMADNAME[10](10)"<br />
(CHANGED <strong>2003</strong> ONWARDS TO:)<br />
"Who drives the most mileage in the<br />
^Make ^Model taken over the year as<br />
a whole)?<br />
(1) ^DMADNAME[1]<br />
(2) ^DMADNAME[2]<br />
(3) ^DMADNAME[3]<br />
(4) ^DMADNAME[4]<br />
(5) ^DMADNAME[5]<br />
(6) ^DMADNAME[6]<br />
(7) ^DMADNAME[7]<br />
(8) ^DMADNAME[8]<br />
(9) ^DMADNAME[9]<br />
(10) ^DMADNAME[10]<br />
(89) IF MAIN DRIVER NOT<br />
HOUSEHOLD MEMBER, ENTER 89"<br />
IF pick up interview is being conducted<br />
(StatusQ=pick up) THEN<br />
StillGot<br />
"INTERVIEWER: CODE OR ASK:<br />
Does the household still have the<br />
^Make ^Model?<br />
ENTER RESPONSE THEN<br />
, THEN PRESS TO<br />
GO TO NEXT PICK-UP QUESTION"<br />
1. "Yes"<br />
2. "No"<br />
IF the household no longer has their<br />
vehicle at pick up ((StatusQ=pick up)<br />
& (StillGot = No)) THEN<br />
WhenDis<br />
"Was the ^Make ^Model sold or<br />
disposed of...READ OUT...<br />
NOTE: Travel Week was from<br />
^QSignIn.TravDate to<br />
^QSignIn.TrEndDat"<br />
1. "...before the start of the Travel<br />
Week,"<br />
2. "during the Travel Week,"<br />
3. "or, after the end of the Travel<br />
Week?"
IF the household no longer has their<br />
vehicle at pick up ((StatusQ=pick up)<br />
& (StillGot = No)) AND the household<br />
disposed of their vehicle during the<br />
Travel Week or does not know when it<br />
was disposed of (Whendis=during OR<br />
don’t know) THEN<br />
DateDis<br />
"On what date did you sell or dispose<br />
of the ^Make ^Model?"<br />
BAttitud / QATTITUD.NTS<br />
Module A ASK ALWAYS<br />
AttIntro<br />
"Please tell me how you would rate<br />
each of the following types of<br />
transport. (HELP )"<br />
1. "Press to continue."<br />
AttIntro(QUESTION DELETED <strong>2004</strong><br />
ONWARDS)<br />
(QUESTION ADDED <strong>2004</strong><br />
ONWARDS:)<br />
Module A ASK ALWAYS<br />
SatServ<br />
"SHOW CARD G<br />
Now I would like to ask some<br />
questions about your local bus<br />
services. By local I mean services<br />
which operate near your home. How<br />
satisfied are you with your local bus<br />
services?"<br />
1. "Very satisfied"<br />
2. "Fairly satisfied"<br />
3. "Neither satisfied or dissatisfied"<br />
4. "Fairly dissatisfied"<br />
5. "Very dissatisfied"<br />
6. "Don't use buses"<br />
Module A ASK ALWAYS<br />
ReliaBus<br />
"SHOW CARD G1<br />
First of all, how would you rate the<br />
reliability of local buses?"<br />
1. "Very reliable"<br />
National Centre for Social Research<br />
227<br />
2. "Fairly reliable"<br />
3. "Neither reliable nor unreliable"<br />
4. "Fairly unreliable"<br />
5. "Very unreliable"<br />
6. "(No local service)"<br />
7. "(Do not use)"<br />
8. "(No opinion/Don't know)"<br />
(CHANGED <strong>2004</strong> ONWARDS TO:)<br />
"SHOW CARD G1<br />
And, how would you rate the reliability<br />
of local buses?"<br />
1. "Very reliable"<br />
2. "Fairly reliable"<br />
3. "Neither reliable nor unreliable"<br />
4. "Fairly unreliable"<br />
5. "Very unreliable"<br />
6. "(No local service)"<br />
7. "(Do not use)"<br />
8. "(No opinion/Don't know)"<br />
Module A IF local buses are very or<br />
fairly reliable, neither reliable or<br />
unreliable, fairly unreliable or very<br />
unreliable or not used by HRP<br />
(ReliaBus IN [vgood, fgood, neither,<br />
fpoor, vpoor, NotUse]) THEN<br />
FrqBus<br />
"SHOW CARD G2<br />
How would you rate the frequency of<br />
local buses?"<br />
1. "Very frequent"<br />
2. "Fairly frequent"<br />
3. "Neither frequent nor infrequent"<br />
4. "Fairly infrequent"<br />
5. "Very infrequent"<br />
6. "(No local service)"<br />
7. "(Do not use)"<br />
8. "(No opinion/Don't know)"<br />
Module A ASK ALWAYS<br />
RelMetro<br />
"SHOW CARD G1<br />
How would you rate the reliability of<br />
the ^traintxt?"<br />
1. "Very reliable"<br />
2. "Fairly reliable"<br />
3. "Neither reliable nor unreliable"<br />
4. "Fairly unreliable"
5. "Very unreliable"<br />
6. "(No local service)"<br />
7. "(Do not use)"<br />
8. "(No opinion/Don't know)"<br />
Module A IF local<br />
trains/tubes/metros/light rails/trams<br />
fairly reliable, neither reliable or<br />
unreliable, fairly unreliable or very<br />
unreliable or not used by HRP<br />
(RelMetro IN [vgood, fgood, neither,<br />
fpoor, vpoor, NotUse]) THEN<br />
FrqMetro<br />
"SHOW CARD G2<br />
How would you rate the frequency of<br />
the ^traintxt?"<br />
1. "Very frequent"<br />
2. "Fairly frequent"<br />
3. "Neither frequent nor infrequent"<br />
4. "Fairly infrequent"<br />
5. "Very infrequent"<br />
6. "(No local service)"<br />
7. "(Do not use)"<br />
8. "(No opinion/Don't know)"<br />
Module A ASK ALWAYS<br />
Integr<br />
"Are combined rail and bus tickets<br />
available in your area?"<br />
1. "Yes"<br />
2. "No"<br />
3. "Don't know"<br />
4. "No local service"<br />
Module A ASK ALWAYS<br />
Cyclane<br />
"SHOW CARD G3<br />
How would you rate the provision of<br />
cycle lanes/paths locally (WITHIN 5<br />
MILES OF THE RESPONDENT'S<br />
HOME)? (HELP )"<br />
1. "Very good"<br />
2. "Fairly good"<br />
3. "Neither good nor poor"<br />
4. "Fairly poor"<br />
5. "Very poor"<br />
6. "(No local cycle lanes)"<br />
National Centre for Social Research<br />
228<br />
7. "(Do not use)"<br />
"(No opinion/Don't know)"<br />
Module A ASK ALWAYS<br />
Pavement<br />
"SHOW CARD G4<br />
How would you rate the condition of<br />
pavements locally where you live?<br />
(HELP )"<br />
1. "Very good"<br />
2. "Fairly good"<br />
3. "Neither good nor poor"<br />
4. "Fairly poor"<br />
5. "Very poor"<br />
6. "(Not many pavements in the<br />
area)"<br />
7. "(Do not use)"<br />
8. "(No opinion/Don't know)"
Individual Questionnaire<br />
TWhoInt / QTWhoInt.NTS<br />
BWhoInt<br />
RECORD ALWAYS<br />
WhoInt<br />
"ENTER THE NUMBER OF THE<br />
PERSON YOU WANT TO<br />
INTERVIEW (OR RECORD AS NOT<br />
AVAILABLE) FROM THE LIST<br />
BELOW<br />
^LTWhoInt1"<br />
RECORD ALWAYS<br />
IndQn<br />
"CODE WHETHER FACE TO FACE<br />
INTERVIEW, PROXY INTERVIEW,<br />
OR PERSON NOT AVAILABLE.<br />
INTERVIEWER: IN GENERAL, FOR<br />
CHILDREN UNDER ELEVEN,<br />
INTERVIEW AN ADULT AND CODE<br />
AS 'PROXY'"<br />
1. "Face to face"<br />
2. "Proxy"<br />
3. "Not available"<br />
TDisab / QTDisab.NTS<br />
BDisab<br />
Questions asked of:<br />
Each individual household member<br />
aged 16 and over in turn<br />
IF age is 16 or over (DVAge>= 16)<br />
THEN<br />
Diffoot<br />
"^LDMIntname<br />
(First of all I want to ask some<br />
questions about any health problem or<br />
physical disability that affects<br />
travelling).<br />
Do you have any disability or other<br />
long standing health problem that<br />
makes it difficult for you to go out on<br />
foot?<br />
NOTE: INCLUDE PROBLEMS DUE<br />
TO OLD AGE"<br />
National Centre for Social Research<br />
229<br />
1. "Yes"<br />
2. "No"<br />
IF age is 16 or over (DVAge>= 16)<br />
AND respondent has health problem<br />
that makes it difficult for them to go out<br />
on foot (Diffoot = Yes) THEN<br />
Footout<br />
"^LDMIntName<br />
Do you go out on foot at all?<br />
IF YES, PROBE: on your own or only<br />
with someone to assist you"<br />
1. "Yes, on own"<br />
2. "Yes, only with someone to assist"<br />
3. "No"<br />
IF age is 16 or over (DVAge>= 16)<br />
AND respondent has health problem<br />
that makes it difficult for them to go out<br />
on foot (Diffoot = Yes) AND<br />
respondent does not go out on foot<br />
alone (Footout IN [Assis, No]) THEN<br />
GoOut<br />
"^LDMIntName<br />
Is it impossible for you to go out<br />
^alone on foot or could you manage it<br />
but with difficulty?"<br />
1. "Impossible"<br />
2. "Difficult"<br />
IF age is 16 or over (DVAge>= 16)<br />
THEN<br />
DifBus<br />
"^LDMIntName<br />
(Do you have a disability or other long<br />
standing health problem that makes it<br />
difficult for you) to use local buses?<br />
NOTE: IF DOES NOT USE<br />
BUSES,PROBE: Would you have any<br />
probelems if you didi use them?<br />
INCLUDE PROBLEMS DUE TO OLD<br />
AGE(EXTRA INT. INSTRUCTION<br />
ADDED <strong>2003</strong> ONWARDS)<br />
NOTE: INCLUDE PROBLEMS DUE<br />
TO OLD AGE"<br />
1. "Yes"<br />
2. "No"
IF age is 16 or over (DVAge>= 16)<br />
AND respondent has health problem<br />
that makes it difficult for them to use<br />
local buses (DifBus = Yes) THEN<br />
DifBusY<br />
"^LDMIntName<br />
How does this disability or health<br />
problem make it difficult for you to use<br />
local buses?<br />
PROBE: How else?<br />
CODE ALL THAT APPLY"<br />
1. "Difficulty getting to the bus stop"<br />
2. "Difficulty standing waiting at the<br />
bus stop"<br />
3. "Difficulty getting on or off buses"<br />
4. "Difficulty getting to and from the<br />
seat "<br />
5. "Difficulty communicating with the<br />
driver/conductor"<br />
6. "Difficulty finding out timetable<br />
information"<br />
97. "Other (specify)"<br />
(PRECODES CHANGED <strong>2003</strong><br />
ONWARDS TO:)<br />
1. "Difficulty getting to and from the<br />
bus stop"<br />
2. "Difficulty standing waiting at the<br />
bus stop"<br />
3. "Difficulty identifying destination of<br />
bus"<br />
4. "Difficulty getting on or off buses"<br />
5. "Difficulty getting to and from the<br />
seat "<br />
6. "Difficulty communicating with the<br />
driver/conductor"<br />
If respondents disability makes it<br />
difficult to use buses for other reason<br />
(Other IN DifBusY) THEN<br />
XDifBusY<br />
"^LDMIntName<br />
Please specify other answer.<br />
TEXT SHOULD BE NO MORE THAN<br />
60 CHARACTERS"<br />
IF age is 16 or over (DVAge>= 16)<br />
AND respondent has health problem<br />
that makes it difficult for them to use<br />
local buses (DifBus = Yes) THEN<br />
National Centre for Social Research<br />
230<br />
BusOut<br />
"^LDMIntName<br />
Can I check, do you use local buses<br />
at all nowadays?"<br />
1. "Yes"<br />
2. "No"<br />
IF age is 16 or over (DVAge>= 16)<br />
AND respondent has health problem<br />
that makes it difficult for them to use<br />
local buses (DifBus = Yes) AND<br />
respondent does not use local buses<br />
at all nowadays (BusOut = No) THEN<br />
BusPrb95<br />
"^LDMIntName<br />
CODE FIRST THAT APPLIES<br />
Is it because of a disability or health<br />
problems or because the bus service<br />
is poor or for some other reasons?"<br />
1. "Disability or health problem"<br />
2. "Poor bus service"<br />
3. "Other (SPECIFY)"<br />
IF respondent does not use local<br />
buses at all nowadays for other<br />
reasons (BusPrb95=Other)THEN<br />
XBusPb95<br />
"^LDMIntName<br />
INTERVIEWER: Record other reason"<br />
IF age is 16 or over (DVAge>= 16)<br />
THEN<br />
DifCar<br />
"^LDMIntName<br />
(And do you have a disability or longstanding<br />
health problem that makes it<br />
difficult for you) to get in or out of a<br />
car?<br />
NOTE: INCLUDE PROBLEMS DUE<br />
TO OLD AGE"<br />
1. "Yes"<br />
2. "No"<br />
IF age is 16 or over (DVAge>= 16)<br />
AND respondent has disability/long<br />
standing health problem that makes it<br />
difficult to go out on foot, use a local<br />
bus or get in or out of a car ((Diffoot =
Yes) OR (DifBus = Yes)) OR (DifCar =<br />
Yes)) THEN<br />
SpecTr<br />
"^LDMIntName<br />
SHOW CARD I<br />
As far as you know or have heard, are<br />
there any of these special transport<br />
services in your area for people who<br />
have difficulties in getting about?<br />
CODE ALL THAT APPLY"<br />
1. "Dial-a-ride service"<br />
2. "Supermarket bus "<br />
3. "Hospital car or service"<br />
4. "Day centre car or service"<br />
5. "Shared taxi scheme"<br />
6. "Taxi voucher scheme"<br />
7. "Postbus"<br />
8. "Community owned minibus"<br />
97. "Other special service (specify)"<br />
98. "(Don't know type/name of<br />
service)"<br />
99. "(Not aware of any of these<br />
services)"<br />
IF respondent has heard of other<br />
special transport service (SpecTr =<br />
Other)THEN<br />
XSpecTr<br />
"^LDMIntName<br />
Please specify other answer.<br />
TEXT SHOULD BE NO MORE THAN<br />
60 CHARACTERS"<br />
TMethod / QTMethod.NTS<br />
BMethod<br />
Module A ASK ALWAYS IF age is 1 or<br />
over (DVAge >=1) THEN<br />
IntroC<br />
"^LDMIntName<br />
I would now like to ask you about<br />
different methods of transport you<br />
currently use. You may have told me<br />
some of this already but I just need to<br />
check."<br />
1. "Press 1 and to continue."<br />
(QUESTION AND ROUTING<br />
CHANGED <strong>2004</strong> ONWARDS TO:)<br />
National Centre for Social Research<br />
231<br />
Module B ASK ALWAYS IF age is 1 or<br />
over (DVAge >=1) THEN<br />
IntroC<br />
"^LDMIntName<br />
I would now like to ask you about how<br />
much walking you do. You may have<br />
told me some of this already but I just<br />
need to check."<br />
1. "Press 1 and to continue."<br />
MOCULE B ASK ALWAYS IF age is 1<br />
or over (DVAge >=1) THEN<br />
Ordbus<br />
" ^LDMIntName<br />
SHOW CARD J<br />
How frequently do you use an ordinary<br />
bus?<br />
PLEASE COUNT EACH SINGLE<br />
TRIP AS ONE JOURNEY AND EACH<br />
RETURN TRIP AS TWO.<br />
NOTE: ONLY INCLUDE TRAVEL<br />
WITHIN GREAT BRITAIN, OVER THE<br />
LAST YEAR OR SO."<br />
1. "3 or more times a week"<br />
2. "Once or twice a week"<br />
3. "Less than that but more than<br />
twice a month"<br />
4. "Once or twice a month"<br />
5. "Less than that but more than<br />
twice a year"<br />
6. "Once or twice a year"<br />
7. "Less than that or never"<br />
MOCULE B ASK ALWAYS IF age is 1<br />
or over (DVAge>=1) THEN<br />
Coach<br />
" ^LDMIntName<br />
SHOW CARD J<br />
How frequently do you use) an<br />
express bus or coach within Great<br />
Britain<br />
PLEASE COUNT EACH SINGLE<br />
TRIP AS ONE JOURNEY AND EACH<br />
RETURN TRIP AS TWO.<br />
NOTE: ONLY INCLUDE TRAVEL<br />
WITHIN GREAT BRITAIN, OVER THE<br />
LAST YEAR OR SO."<br />
1. "3 or more times a week"<br />
2. "Once or twice a week"
3. "Less than that but more than<br />
twice a month"<br />
4. "Once or twice a month"<br />
5. "Less than that but more than<br />
twice a year"<br />
6. "Once or twice a year"<br />
7. "Less than that or never"<br />
MOCULE B ASK ALWAYS IF age is 1<br />
or over (DVAge >=1) THEN<br />
Train<br />
" ^LDMIntName<br />
SHOW CARD J<br />
(How frequently do you use) a train,<br />
not including underground, tram or<br />
light rail?<br />
PLEASE COUNT EACH SINGLE<br />
TRIP AS ONE JOURNEY AND EACH<br />
RETURN TRIP AS TWO.<br />
NOTE: ONLY INCLUDE TRAVEL<br />
WITHIN GREAT BRITAIN, OVER THE<br />
LAST YEAR OR SO."<br />
1. "3 or more times a week"<br />
2. "Once or twice a week"<br />
3. "Less than that but more than<br />
twice a month"<br />
4. "Once or twice a month"<br />
5. "Less than that but more than<br />
twice a year"<br />
6. "Once or twice a year"<br />
7. "Less than that or never"<br />
MOCULE B ASK ALWAYS IF age is 1<br />
or over (DVAge>=1) THEN<br />
TaxiCab<br />
" ^LDMIntName<br />
SHOW CARD J<br />
(How frequently do you use) a<br />
taxi/minicab?<br />
PLEASE COUNT EACH SINGLE<br />
TRIP AS ONE JOURNEY AND EACH<br />
RETURN TRIP AS TWO.<br />
NOTE: ONLY INCLUDE TRAVEL<br />
WITHIN GREAT BRITAIN, OVER THE<br />
LAST YEAR OR SO."<br />
1. "3 or more times a week"<br />
2. "Once or twice a week"<br />
3. "Less than that but more than<br />
twice a month"<br />
4. "Once or twice a month"<br />
National Centre for Social Research<br />
232<br />
5. "Less than that but more than<br />
twice a year"<br />
6. "Once or twice a year"<br />
7. "Less than that or never"<br />
MOCULE B ASK ALWAYS IF age is 1<br />
or over (DVAge >=1) THEN<br />
Plane<br />
" ^LDMIntName<br />
SHOW CARD J<br />
(How frequently do you use) an<br />
internal air light within Great Britain?<br />
PLEASE COUNT EACH SINGLE<br />
TRIP AS ONE JOURNEY AND EACH<br />
RETURN TRIP AS TWO.<br />
NOTE: ONLY INCLUDE TRAVEL<br />
WITHIN GREAT BRITAIN, OVER THE<br />
LAST YEAR OR SO."<br />
1. "3 or more times a week"<br />
2. "Once or twice a week"<br />
3. "Less than that but more than<br />
twice a month"<br />
4. "Once or twice a month"<br />
5. "Less than that but more than<br />
twice a year"<br />
6. "Once or twice a year"<br />
7. "Less than that or never"<br />
MOCULE B ASK ALWAYS IF age is 5<br />
or over (DVAge >=5) THEN<br />
Bicycle<br />
^LDMIntName<br />
SHOW CARD J<br />
How frequently do you use a bicycle?<br />
(HELP )<br />
PLEASE COUNT EACH SINGLE<br />
TRIP AS ONE JOURNEY AND EACH<br />
RETURN TRIP AS TWO<br />
NOTE: ONLY INCLUDE TRAVEL<br />
WITHIN GREAT BRITAIN, OVER THE<br />
LAST YEAR OR SO."<br />
1. "3 or more times a week"<br />
2. "Once or twice a week"<br />
3. "Less than that but more than<br />
twice a month"<br />
4. "Once or twice a month"<br />
5. "Less than that but more than<br />
twice a year"<br />
6. "Once or twice a year"<br />
7. "Less than that or never"
IF age is 1 or over (DVAge > 1) and<br />
respondent goes out on foot<br />
(NOT(Footout = No)) THEN<br />
Walk<br />
"^LDMIntName<br />
SHOW CARD J<br />
How frequently do you walk anywhere<br />
for 20 minutes or more without<br />
stopping. Please count each single trip<br />
as one journey and each return trip as<br />
two? (HELP )<br />
INCLUDE ALL WALKS, WHETHER<br />
FOR PLEASURE OR WITH A<br />
PURPOSE. (EXTRA INT.<br />
INSTRUCTION ADDED <strong>2003</strong><br />
ONWARDS)<br />
IF ROUND TRIP, COUNT AS ONE<br />
JOURNEY<br />
NOTE: ONLY INCLUDE TRAVEL<br />
WITHIN GREAT BRITAIN, OVER THE<br />
LAST YEAR OR SO."<br />
1. "3 or more times a week"<br />
2. "Once or twice a week"<br />
3. "Less than that but more than<br />
twice a month"<br />
4. "Once or twice a month"<br />
5. "Less than that but more than<br />
twice a year"<br />
6. "Once or twice a year"<br />
7. "Less than that or never"<br />
IF age is 1 or over (DVAge > 1) and<br />
respondent goes out on foot (NOT<br />
(Footout = No)) AND respondent<br />
walks for more than 20 minutes at<br />
least once a year Walk IN<br />
[Wkly3..Yearly1] THEN<br />
WhWalk<br />
"^LDMIntName<br />
Thinking about your @Ilast@I walk of<br />
20 minutes or more, where did you<br />
walk ... READ OUT<br />
CODE ONE ONLY"<br />
1. "...mostly on pavements alongside<br />
a road,"<br />
2. "mostly on country roads without<br />
pavements,"<br />
3. "mostly in a town or city park, or<br />
other urban area away from the road,"<br />
National Centre for Social Research<br />
233<br />
4. "mostly in the countryside (away<br />
from roads),"<br />
5. "or a mixture of these?"<br />
97. "Other (SPECIFY)"<br />
(CHANGED <strong>2003</strong> ONWARDS TO:)<br />
"^LDMIntName Thinking about your<br />
@Ilast@I walk of 20 minutes or more,<br />
where did you walk? Please choose<br />
your answer from this card.<br />
CODE ONE ONLY"<br />
1. "...mostly on pavements alongside<br />
a road,"<br />
2. "mostly on country roads without<br />
pavements,"<br />
3. "mostly in a town or city park, or<br />
other urban area away from the road,"<br />
4. "mostly in the countryside (away<br />
from roads),"<br />
5. "or a mixture of these?"<br />
97. "Other (SPECIFY)"<br />
IF respondent walked on another<br />
surface (WhWalk = other)THEN<br />
XWhWalk<br />
"^LDMIntName<br />
Please specify other answer.<br />
TEXT SHOULD BE NO MORE THAN<br />
60 CHARACTERS"<br />
IF age is 1 or over (DVAge > 1) and<br />
respondent goes out on foot<br />
(NOT(Footout = No)) AND respondent<br />
walks for more than 20 minutes at<br />
least once a year Walk IN<br />
[Wkly3..Yearly1] THEN<br />
FarWalk<br />
"^LDMIntName<br />
How long did the walk take you, one<br />
way?<br />
PLEASE COUNT EACH SINGLE<br />
TRIP AS ONE JOURNEY<br />
BUT IF NO PARTICULAR<br />
DESTINATION, RECORD TIME<br />
TAKEN FOR ROUND TRIP<br />
ENTER ANSWER IN MINUTES OR<br />
CODE 997 IF PREFERS TO GIVE<br />
DISTANCE"
If respondent prefers to give distance<br />
of walk (FarWalk = 997) THEN<br />
DistWalk<br />
"^LDMIntName<br />
ENTER DISTANCE WALKED TO<br />
NEAREST MILE"<br />
IF age is 1 or over (DVAge > 1) and<br />
respondent goes out on foot<br />
(NOT(Footout = No)) AND respondent<br />
walks for more than 20 minutes at<br />
least once a year Walk IN<br />
[Wkly3..Yearly1] THEN<br />
TrWalk<br />
"^LDMIntName<br />
Did you have to travel to get to the<br />
start of the walk?<br />
ADD IF NECESSARY: By means<br />
other than walking"<br />
1. "Yes"<br />
2. "No"<br />
IF respondent travelled to get to start<br />
of walk (TrWalk = Yes) THEN<br />
HtrWalk<br />
"^LDMIntName<br />
How did you travel there?<br />
CODE METHOD USED FOR<br />
LONGEST DISTANCE"<br />
1. "Underground, metro, light rail,<br />
tram"<br />
2. "Train"<br />
3. "Bus, minibus or coach"<br />
4. "Motorcycle, scooter or moped"<br />
5. "Car or van"<br />
6. "Taxi/minicab"<br />
7. "Bicycle"<br />
97. "Other (specify)"<br />
If respondent used other method of<br />
travel (HtrWalk = other)<br />
XHTrWalk<br />
"^LDMIntName<br />
Please specify other answer.<br />
TEXT SHOULD BE NO MORE THAN<br />
60 CHARACTERS"<br />
TCycle / QTCycle.NTS<br />
National Centre for Social Research<br />
234<br />
BCycle<br />
Questions asked of:<br />
Each individual household member<br />
aged 5 and over in turn<br />
IF age is greater than 4 (DVAge > 4)<br />
THEN<br />
GenCycle<br />
"^LDMIntName<br />
(The next few questions are about<br />
cycling.) Excluding exercise bikes, do<br />
you... READ OUT..."<br />
1. "...own a bicycle yourself,"<br />
2. "have regular use of a bicycle<br />
owned by someone else,"<br />
3. "or have no regular use of a<br />
bicycle?"<br />
IF age is greater than 4 (DVAge > 4)<br />
AND respondent regularly uses bicycle<br />
owned by someone else (GenCycle =<br />
UseElse) THEN<br />
CycElse<br />
"^LDMIntName<br />
Is that bicycle owned by someone in<br />
your household or someone outside<br />
the household?"<br />
1. "Someone in the household"<br />
2. "Someone outside the household"<br />
IF age is greater than 4 (DVAge > 4)<br />
THEN<br />
Cycle12<br />
"^LDMIntName<br />
(May I just check,) have you ridden a<br />
bicycle during the last 12 months, (that<br />
is since ^DLYEARTXT)? (HELP<br />
)"<br />
1. "Yes"<br />
2. "No"<br />
3. "Don't know / Can't remember"<br />
IF age is 4 or more (DVAge > 4) AND<br />
respondent has ridden bike in last 12<br />
months (Cycle12 = Yes) THEN<br />
CycRoute<br />
"^LDMIntName
When you cycled in the last 12<br />
months, did you usually cycle... READ<br />
OUT..."<br />
1. "...mainly on the road,"<br />
2. "mainly on pavements, cycle paths<br />
or cycle lanes that were not part of a<br />
road,"<br />
3. "mainly off the road in parks, open<br />
country, or private land,"<br />
4. "or on a variety of different<br />
surfaces?"<br />
CHANGED <strong>2003</strong> onwards to:<br />
"^LDMIntName<br />
When you cycled in the last 12<br />
months, where did you usually cycle?<br />
Please choose an answer from this<br />
card.<br />
1. "...mainly on the road,"<br />
2. "mainly on pavements, cycle paths<br />
or cycle lanes that were not part of a<br />
road,"<br />
3. "mainly off the road in parks, open<br />
country, or private land,"<br />
4. "or on a variety of different<br />
surfaces?"<br />
TDrLic / QTDrLic.NTS<br />
BDrlic<br />
Questions asked of :<br />
Each individual household member<br />
aged 16 and over in turn<br />
If age is 16 or over (DVAge >= 16)<br />
THEN<br />
DLFull<br />
"^LDMIntName<br />
Do you hold a full driving licence valid<br />
in Great Britain to drive either a car, or<br />
a motorcycle, scooter or moped?<br />
INCLUDE: DISQUALIFIED DRIVERS<br />
AND INTERNATIONAL<br />
PERMITS/OTHER LICENCES VALID<br />
IN THE UK."<br />
1. "Yes"<br />
2. "No"<br />
National Centre for Social Research<br />
235<br />
If respondent has full driving licence<br />
(DLFull = Yes) THEN<br />
DLTyp95<br />
"^LDMIntName<br />
Is it for a car only, a motorcycle only<br />
or for both, or is it for a car with special<br />
adaptations?<br />
THE CODES AFTER THE '/' APPLY<br />
TO LICENCES ISSUED AFTER JUNE<br />
1990<br />
INTERVIEWER: ASK RESPONDENT<br />
TO CHECK DRIVING LICENCE"<br />
1. "Car (A or B) / (B)"<br />
2. "Car (A or B) / (B) - (AUTOMATIC<br />
ONLY)"<br />
3. "Both car and motorcycle<br />
(A&D)/(A&B)"<br />
4. "Motorcycle (D) / (A)/P"<br />
5. "Car with special adaptations (A<br />
restricted, B)"<br />
6. "Moped (E) / (P)"<br />
If respondent has full driving licence<br />
(DLFull = Yes) AND licence type<br />
appears in the list above DLTyp95 IN<br />
[Car .. Moped] THEN<br />
LicChk<br />
"^LDMIntName<br />
INTERVIEWER: CODE WHETHER<br />
DRIVING LICENCE CHECKED FOR<br />
PREVIOUS QUESTION"<br />
1. "Seen by interviewer"<br />
2. "Consulted by informant"<br />
3. "Not seen/consulted"<br />
IF driving licence is for both a car and<br />
motorcycle (DLTyp95 = CarMot) THEN<br />
CarMot95<br />
"^LDMIntName<br />
May I just check, have you actually<br />
passed a test to drive a motorcycle of<br />
over 125CC?"<br />
1. "Yes"<br />
2. "No"<br />
IF respondent has licence for a car or<br />
car with special adaptations (DLTyp95<br />
= Car OR DLTyp95 = Auto OR
DLTyp95 = CarRes OR CarMot95 =<br />
RESPONSE) THEN<br />
Drive95<br />
"^LDMIntName<br />
Do you drive... READ OUT ...<br />
(HELP )<br />
CODE AUTOMATIC CAR AS AN<br />
ORDINARY CAR<br />
CODE ALL THAT APPLY"<br />
1. "...an ordinary car (without special<br />
adaptations for people with<br />
disabilities),"<br />
2. "...a car with special adaptations<br />
for people with disabilities,"<br />
3. "...or some other kind of vehicle?"<br />
4. "(no longer drive)"<br />
IF respondent drives some other kind<br />
of vehicle (Drive95 = other) THEN<br />
XOthVeh<br />
"^LDMIntName<br />
INTERVIEWER: DESCRIBE THIS<br />
OTHER TYPE OF VEHICLE"<br />
If respondent has licence for a car or<br />
car with special adaptations (DLTyp95<br />
= Car OR DLTyp95 = Auto OR<br />
DLTyp95 = CarRes OR CarMot95 =<br />
RESPONSE) AND respondent uses<br />
vehicles from a car pool, or has a<br />
household vehicle or broken vehicle<br />
and drives an ordinary car or a car<br />
with special adaptations or some other<br />
kind of vehicle ((CarPool = Yes OR<br />
UseVcl = Yes OR BrokenV = Yes)<br />
AND (Drive95 = OrdVeh OR Drive95 =<br />
OrdAdp OR OthVeh)) THEN<br />
VehUsu<br />
"^LDMIntName<br />
READ OUT IF MORE THAN ONE<br />
VEHICLE<br />
(May I check) which is the car/(vehicle)<br />
you usually drive?<br />
INTERVIEWER: ENTER VEHICLE<br />
NUMBER OR CODE 89 IF<br />
INFORMANT USUALLY DRIVES A<br />
NON-HOUSEHOLD CAR<br />
^DMVEH[1](1)^s^s ^DMVEH[2](2)^s^s<br />
^DMVEH[3](3)^s^s ^DMVEH[4](4)^s^s<br />
^DMVEH[5](5)^s^s ^DMVEH[6](6)^s^s<br />
^DMVEH[7](7)^s^s ^DMVEH[8](8)^s^s<br />
National Centre for Social Research<br />
236<br />
^DMVEH[9](9)^s^s<br />
^DMVEH[10](10)^s^s"<br />
(CHANGED <strong>2003</strong> ONWARDS TO:)<br />
"^LDMIntName<br />
READ OUT IF MORE THAN ONE<br />
VEHICLE<br />
(May I check) which is the car/(vehicle)<br />
you usually drive?<br />
INTERVIEWER: ENTER VEHICLE<br />
NUMBER OR CODE 89 IF<br />
INFORMANT USUALLY DRIVES A<br />
NON-HOUSEHOLD CAR<br />
(1) ^DMVEH[1]<br />
(2) ^DMVEH[2]<br />
(3) ^DMVEH[3]<br />
(4) ^DMVEH[4]<br />
(5) ^DMVEH[5]<br />
(6) ^DMVEH[6]<br />
(7) ^DMVEH[7]<br />
(8) ^DMVEH[8]<br />
(9) ^DMVEH[9]<br />
(10) ^DMVEH[10]<br />
(89) Usually drives non household<br />
vehicle"<br />
If respondent has licence for a car or<br />
car with special adaptations (DLTyp95<br />
= Car OR DLTyp95 = Auto OR<br />
DLTyp95 = CarRes OR CarMot95 =<br />
RESPONSE) AND respondent no<br />
longer drives (Drive95=NoDrv) THEN<br />
Nodriv95<br />
"^LDMIntName<br />
Is that because of a disability or health<br />
problem<br />
or for some other reason?"<br />
1. "Disability or health problem"<br />
2. "Other (SPECIFY)"<br />
If respondent does not drive for some<br />
other reason (NoDrive95 =<br />
other)THEN<br />
XNodriv<br />
"^LDMIntName<br />
INTERVIEWER: EXPLAIN WHY<br />
INFORMANT NO LONGER DRIVES."
IF respondent (does not hold a full<br />
driving licence or has a motorcyle or<br />
moped licence) and is older than 59<br />
((DLFull = No OR DLTyp95 = Mcycle<br />
OR DLTyp95 = Moped) AND (DVAge<br />
> 59)) THEN<br />
EvDLic95<br />
"^LDMIntName<br />
Have you ever held a full driving<br />
licence valid in Great<br />
Britain to drive a car?"<br />
1. "Yes"<br />
2. "No"<br />
If respondent (does not hold a full<br />
driving licence or has a motorcyle or<br />
moped licence) ((DLFull = No OR<br />
DLTyp95 = Mcycle OR DLTyp95 =<br />
Moped) AND is older than 59 (DVAge<br />
> 59)) AND respondent had a full<br />
driving licence to drive a car<br />
(EvDLic95 = Yes) THEN<br />
Nolic95<br />
"^LDMIntName<br />
Why do you no longer hold a licence?<br />
Is it because of a disability or health<br />
problem or for some other reason?"<br />
1. "Disability or health problem"<br />
2. "Other (SPECIFY)"<br />
IF there is some other reason why<br />
respondent no longer holds a licence<br />
(Nolic95 = other)THEN<br />
XNoLic95<br />
"^LDMIntName<br />
INTERVIEWER: EXPLAIN WHY<br />
INFORMANT NO LONGER HOLDS A<br />
LICENCE."<br />
IF respondent held a full driving<br />
licence to drive a car or respondent no<br />
longer drives (EvDLic95 = Yes OR<br />
Drive95 = NoDrv) THEN<br />
LastDr95<br />
"^LDMIntName<br />
How old were you when you last<br />
drove?"<br />
National Centre for Social Research<br />
237<br />
IF respondent has full driving licence<br />
for car, motorcycle, scooter, or moped<br />
(DLFull = Yes) THEN<br />
DLAge<br />
"^LDMIntName<br />
How old were you when you FIRST<br />
obtained a full licence?"<br />
IF respondent does not have a full<br />
driving licence for a car, motorcycle,<br />
scooter or moped and respondent has<br />
never held a full driving licence for a<br />
car (DLFull = No AND EvDLic95 = No)<br />
THEN<br />
DLProv<br />
"^LDMIntName<br />
Do you hold a provisional driving<br />
licence for a car, motorcycle, scooter<br />
or moped?"<br />
1. "Yes"<br />
2. "No"<br />
If age is 16 or over (DVAge >= 16)<br />
AND respondent does not have a full<br />
driving licence for a car, motorcycle,<br />
scooter or moped and respondent has<br />
never held a full driving licence for a<br />
car (DLFull = No AND EvDLic95 = No)<br />
AND respondent has a provisional<br />
licence for a car, motorcycle, scooter<br />
or moped (DLProv = Yes) THEN<br />
ProTyp95<br />
"^LDMIntName Is it for a car only, a<br />
car and motorcycle, a car with special<br />
adaptations or something else?<br />
CODE FIRST THAT APPLIES"<br />
1. "Car only"<br />
2. "Car and motorcycle"<br />
3. "Car with special adaptations"<br />
4. "Something else (SPECIFY)"<br />
IF provisional licence is for some other<br />
vehicle (ProTyp95 = Other) THEN<br />
XProTp95<br />
"^LDMIntName<br />
INTERVIEWER: Record other answer"
TILO / QTILO.NTS<br />
BILO<br />
Questions asked of:<br />
Each individual household member<br />
aged 16 and over in turn<br />
(QUESTION ADDED <strong>2004</strong><br />
ONWARDS:)<br />
IF aged 16 or over (DvAge >=16)<br />
THEN<br />
TDirPriv<br />
"SHOW CARD L1<br />
LDMIntName<br />
Thinking of any journeys you have<br />
made by car, van or motorcycle within<br />
the last 6 months, which (if any)of<br />
these have you done to plan your<br />
route before setting out?<br />
CODE ALL THAT APPLY"<br />
1. "Looked at a road map",<br />
2. "Asked a friend",<br />
3. "Telephoned the AA or RAC",<br />
4. "Contacted the venue/attraction<br />
you are visiting",<br />
5. "Used Transport Direct",<br />
6. "Used another journey planner on<br />
the Internet",<br />
7. "Used a computer-based journey<br />
planner on CD",<br />
8. "Checked Teletext/Ceefax for<br />
roadworks/congestion",<br />
9. "Used an in-car navigation<br />
system",<br />
10. "Relied on road signs",<br />
11. "None - never to go unfamiliar<br />
places",<br />
12. "None - someone else usually<br />
plans the route for me",<br />
13. "None - have not done a journey",<br />
97. "Anything else (specify)"<br />
(QUESTION ADDED <strong>2004</strong><br />
ONWARDS:)<br />
If respondent had other method of<br />
planning jounreys (Anything else IN<br />
TDirPriv) THEN<br />
XTDirPr<br />
National Centre for Social Research<br />
238<br />
"^LDMIntName<br />
Please specify other answer.<br />
TEXT SHOULD BE NO MORE THAN<br />
60 CHARACTERS"<br />
(QUESTION ADDED <strong>2004</strong><br />
ONWARDS:)<br />
IF aged 16 or over (DvAge >=16)<br />
THEN<br />
TDirPub<br />
"SHOW CARD L2<br />
Thinking of any journeys you have<br />
made by bus, tram, train or<br />
underground within the last 6 months,<br />
which (if any)of these have you used<br />
to get travel information or advice<br />
about your journey?<br />
CODE ALL THAT APPLY"<br />
1. "Asked a friend"<br />
2. "Public transport telephone inquiry<br />
service"<br />
3. "Timetable delivered through<br />
door/picked up at stations"<br />
4. "Timetable displayed at stations<br />
and stops"<br />
5. "Asked at a local station"<br />
6. "Contacted the venue/attraction<br />
you are visiting"<br />
7. "Teletext/Ceefax"<br />
8. "Digital TV interactive services"<br />
9. "Electronic kiosks/terminals"<br />
10. "Used Transport Direct"<br />
11. "Used other web sites"<br />
12. "None - someone else usually<br />
finds out for me"<br />
13. "None - have not done a journey"<br />
14. "None"<br />
97. "Other (please specify)"<br />
(QUESTION ADDED <strong>2004</strong><br />
ONWARDS:)<br />
If respondent had other method of<br />
getting travel information or advice for<br />
journeys (Other IN TdirPriv) THEN<br />
XTDirPub<br />
"LDMIntName<br />
Please specify other answer.
TEXT SHOULD BE NO MORE THAN<br />
60 CHARACTERS"<br />
IF aged 16 or over (DvAge >=16)<br />
THEN<br />
Wrking<br />
"^LDMIntName<br />
Did you do any paid work in the 7<br />
days ending Sunday the ^DLSUNTxt,<br />
either as an employee or as selfemployed?<br />
(HELP )"<br />
1. "Yes"<br />
2. "No"<br />
IF aged 16 or over (DvAge >=16) AND<br />
respondent did not do any paid work<br />
(Wrking = No) THEN<br />
SchemeET<br />
"^LDMIntName<br />
Were you on a government scheme<br />
for employment training?"<br />
1. "Yes"<br />
2. "No"<br />
IF aged 16 or over (DvAge >=16) AND<br />
respondent did not do any paid work<br />
(Wrking = No) AND respondent was<br />
not on a government training scheme<br />
(SchemeET = No) THEN<br />
JbAway<br />
"^LDMIntName<br />
Did you have a job or business that<br />
you were away from? (HELP )"<br />
1. "Yes"<br />
2. "No"<br />
3. "Waiting to take up a new<br />
job/business already obtained"<br />
IF aged 16 or over (DvAge >=16) AND<br />
respondent did not do any paid work<br />
(Wrking = No) AND respondent was<br />
not on a government training scheme<br />
(SchemeET = No) AND respondent<br />
was not away from a job or business<br />
or was waiting to take up a new job<br />
((JbAway = No) OR (JbAway =<br />
Waiting)) THEN<br />
OwnBus<br />
National Centre for Social Research<br />
239<br />
"^LDMIntName<br />
Did you do any unpaid work in that<br />
week for any business that you own?<br />
(HELP )"<br />
1. "Yes"<br />
2. "No"<br />
IF aged 16 or over (DvAge >=16) AND<br />
respondent did not do any paid work<br />
(Wrking = No) AND respondent was<br />
not on a government training scheme<br />
(SchemeET = No) AND respondent<br />
was not away from a job or business<br />
or was waiting to take up a new job<br />
((JbAway = No) OR (JbAway =<br />
Waiting)) AND respondent did not do<br />
unpaid work for their own business<br />
(OwnBus = No) THEN<br />
RelBus<br />
"^LDMIntName<br />
...or that a relative owns?....(HELP<br />
)"<br />
1. "Yes"<br />
2. "No"<br />
IF aged 16 or over (DvAge >=16) AND<br />
respondent did not do any paid work<br />
(Wrking = No) AND respondent was<br />
not on a government training scheme<br />
(SchemeET = No) AND respondent<br />
was not away from a job (JbAway =<br />
No) AND Did not do unpaid work for a<br />
business that a relative owns (RelBus<br />
= No) THEN<br />
Looked<br />
"^LDMIntName<br />
Thinking of the 4 weeks ending<br />
Sunday the ^DLSUNTxt, were you<br />
looking for any kind of paid work or<br />
government training scheme at any<br />
time in those 4 weeks?<br />
(HELP )"<br />
1. "Yes"<br />
2. "No"<br />
3. "Waiting to take up a new job or<br />
business already obtained"
(QUESTION ADDED <strong>2004</strong><br />
ONWARDS:)<br />
IF aged 16 or over (DvAge >=16) AND<br />
respondent did not do any paid work<br />
(Wrking = No) AND respondent was<br />
not on a government training scheme<br />
(SchemeET = No) AND respondent<br />
was looking for a job (Look=Yes) or<br />
waiting to take up a new job or<br />
business already obtained (JbAway=<br />
Waiting OR Looked= Waiting) THEN<br />
HowLong<br />
"SHOW CARD L3<br />
LDMIntName<br />
How long have you been looking/were<br />
you looking for paid work/a place on a<br />
govenment scheme"<br />
1. "Not yet started"<br />
2. "Less than 1 month"<br />
3. "1 month or more, less than 3<br />
months"<br />
4. "3 months or more, less than 6<br />
months"<br />
5. "6 months or more, less than 12<br />
months"<br />
6. "12 Months or more"<br />
IF aged 16 or over (DvAge >=16) AND<br />
respondent did not do any paid work<br />
(Wrking = No) AND respondent was<br />
not on a government training scheme<br />
(SchemeET = No) AND respondent<br />
was looking for a job, or waiting to take<br />
up a new job (Looked = Yes OR<br />
Looked = Wait OR JbAway<br />
= Waiting) THEN<br />
StartJ<br />
"^LDMIntName<br />
If a job or a place on a government<br />
scheme had been available in the<br />
week ending Sunday the ^DLSUNTxt,<br />
would you have been able to start<br />
within 2 weeks?"<br />
1. "Yes"<br />
2. "No"<br />
IF aged 16 or over (DvAge >=16) AND<br />
respondent did not do any paid work<br />
National Centre for Social Research<br />
240<br />
(Wrking = No) AND respondent was<br />
not on a government training scheme<br />
(SchemeET = No) AND respondent<br />
was not looking for paid work or did<br />
not have a job that they were away<br />
from (Looked = No OR StartJ = No)<br />
THEN<br />
YInAct<br />
"^LDMIntName<br />
What was the main reason you (did<br />
not seek any work in the last 4<br />
weeks/would not be able to start in the<br />
next 2 weeks?)<br />
(HELP )"<br />
1. "Student"<br />
2. "Looking after the family/home"<br />
3. "Temporarily sick or injured"<br />
4. "Long-term sick or disabled"<br />
5. "Retired from paid work"<br />
6. "Other reasons"<br />
TEDUC / QTEduc.NTS<br />
BEDUC<br />
Questions asked of:<br />
Each individual household member<br />
aged 16 and over in turn, if any of<br />
the following conditions are met:<br />
Wrking = Yes (1)<br />
SchemeET = Yes (1)<br />
JbAway = Yes (1) or “Waiting” (3)<br />
Looked = Yes (1)<br />
IF respondent did paid work or was on<br />
a government scheme for training or<br />
was away from a job or business or<br />
waiting to take up a new job or looking<br />
for paid work (Wrking = Yes OR<br />
SchemeET = Yes OR JbAway = Yes<br />
OR JbAway = Waiting OR Looked =<br />
Yes) THEN<br />
Educ<br />
"^LDMIntName<br />
Are you at present attending a school<br />
or college?"<br />
1. "Yes"
2. "No"<br />
IF respondent did paid work or was on<br />
a government scheme for training or<br />
was away from a job or business or<br />
waiting to take up a new job or looking<br />
for paid work (Wrking = Yes OR<br />
SchemeET = Yes OR JbAway = Yes<br />
OR JbAway = Waiting OR Looked =<br />
Yes) AND respondent is attending<br />
school or college (Educ = Yes) THEN<br />
EducFT<br />
"^LDMIntName<br />
May I check, are you a full-time<br />
student?"<br />
1. "Yes"<br />
2. "No"<br />
TTrEmp / QTTrEmp.NTS<br />
BTrEmp<br />
Questions asked of:<br />
Each individual household member<br />
in turn, if the following conditions are<br />
met:<br />
Male aged 16 to 64 (inclusive) AND<br />
DVILO3a= “unemp“ or “ecinact” (ILO<br />
classification of employment:<br />
Unemployed or Economically<br />
Inactive) AND Educ = No (2)<br />
Female aged 16 to 59 (inclusive)<br />
AND DVILO3a= “unemp“ or<br />
“ecinact” (ILO classification of<br />
employment: Unemployed or<br />
Economically Inactive) AND Educ =<br />
No (2)<br />
IF respondent is unemployed or<br />
ecomically inactive (DVILO3a =<br />
Unemp OR DVILO3a = EcInAct) AND<br />
(a male aged under 65 (DVAge < 65<br />
AND Sex = Male)<br />
OR a female aged under 60 (DVAge<br />
< 60 AND Sex = Female)) AND not<br />
attending school or college (Educ =<br />
No) THEN<br />
PrbJob<br />
"^LDMIntName<br />
National Centre for Social Research<br />
241<br />
Have you turned down a job in the<br />
past 12 months due to problems with<br />
transport?"<br />
1. "Yes"<br />
2. "No"<br />
IF respondent is unemployed or<br />
ecomically inactive (DVILO3a =<br />
Unemp OR DVILO3a = EcInAct) AND<br />
(a male aged under 65 (DVAge < 65<br />
AND Sex = Male) OR a female aged<br />
under 60 (DVAge < 60 AND Sex =<br />
Female)) AND not attending school or<br />
college AND (Educ = No) AND<br />
respondent had problems with<br />
transport (PrbJob = Yes) THEN<br />
PrbTyp1<br />
"^LDMIntName<br />
What sort of problems with transport<br />
were these?<br />
CODE ALL THAT APPLY"<br />
1. "Too far"<br />
2. "Car not available"<br />
3. "Don't have a current driving<br />
licence/can't drive"<br />
4. "Cost of petrol"<br />
5. "Lack of parking facilities"<br />
6. "Cost of parking"<br />
7. "Traffic congestion/roadworks"<br />
8. "Inadequate public transport"<br />
9. "Cost of using public transport"<br />
10. "Personal physical<br />
difficulties/disability"<br />
11. "Personal safety concerns"<br />
97. "Other (specify)"<br />
IF respondent had other problem with<br />
transport (Other IN PrbTyp1) THEN<br />
XPrbTyp1<br />
"^LDMIntName<br />
Please specify other answer.<br />
TEXT SHOULD BE NO MORE THAN<br />
60 CHARACTERS"<br />
IF respondent is unemployed or<br />
ecomically inactive (DVILO3a =<br />
Unemp OR DVILO3a = EcInAct) AND<br />
(a male aged under 65 (DVAge < 65<br />
AND Sex = Male) OR a female aged
under 60 (DVAge < 60 AND Sex =<br />
Female)) AND not attending school or<br />
college AND (Educ = No) THEN<br />
PrbNow<br />
"^LDMIntName<br />
And do you have any problems with<br />
transport now which would stop you<br />
from taking a job?"<br />
1. "Yes"<br />
2. "No"<br />
IF respondent is unemployed or<br />
economically inactive (DVILO3a =<br />
Unemp OR DVILO3a = EcInAct) AND<br />
(a male aged under 65 (DVAge < 65<br />
AND Sex = Male) OR a female aged<br />
under 60 (DVAge < 60 AND Sex =<br />
Female)) AND not attending school or<br />
college (Educ = No) AND respondent<br />
has a problem now that would stop<br />
them taking a job AND If respondent<br />
has mentioned a problem with<br />
transport earlier (PrbNow = Yes and<br />
PrbTyp1 = RESPONSE) THEN<br />
PrbSame<br />
"^LDMIntName<br />
Are these problems the same as<br />
those you mentioned before?"<br />
1. "Yes"<br />
2. "No"<br />
IF respondent does not have same<br />
problem as before (PrbSame = No)<br />
OR did not specify the earlier problem<br />
(PrbTyp1 RESPONSE) THEN<br />
PrbTyp2<br />
"^LDMIntName<br />
What sort of problems with transport<br />
are these?<br />
CODE ALL THAT APPLY"<br />
1. "Too far"<br />
2. "Car not available"<br />
3. "Don't have a current driving<br />
licence/can't drive"<br />
4. "Cost of petrol"<br />
5. "Lack of parking facilities"<br />
6. "Cost of parking"<br />
7. "Traffic congestion/roadworks"<br />
8. "Inadequate public transport"<br />
9. "Cost of using public transport"<br />
National Centre for Social Research<br />
242<br />
10. "Personal physical<br />
difficulties/disability"<br />
11. "Personal safety concerns"<br />
97. "Other (specify)"<br />
IF respondent had other problem with<br />
transport (PrbTyp2 = other) THEN<br />
XPrbTyp2<br />
"^LDMIntName<br />
Please specify other answer.<br />
TEXT SHOULD BE NO MORE THAN<br />
60 CHARACTERS"<br />
TLastJb / QTLastJb.NTS<br />
BlastJb<br />
Questions asked of:<br />
Each individual household member<br />
aged 16 and over in turn, if the<br />
following condition is met:<br />
DVILO3a= “unemp“ or “ecinact” (ILO<br />
classification of employment:<br />
Unemployed or Economically<br />
Inactive)<br />
IF employment status derived as<br />
economically inactive or unemployed<br />
(DVILO3a = EcInAct or DVILO3a =<br />
Unemp) THEN<br />
Everwk<br />
"^LDMIntName<br />
Have you ever had a paid job, apart<br />
from casual or holiday work?"<br />
1. "Yes"<br />
2. "No"<br />
IF employment status derived as<br />
economically inactive or unemployed<br />
(DVILO3a = EcInAct or DVILO3a =<br />
Unemp) AND respondent has had a<br />
paid job (Everwk = Yes) THEN<br />
DtJbL<br />
"^LDMIntName<br />
When did you leave your last PAID<br />
job?<br />
FOR DAY NOT GIVEN.....ENTER 15<br />
FOR DAY<br />
FOR MONTH NOT GIVEN....ENTER<br />
6 FOR MONTH
THIS QUESTION DOES NOT<br />
INCLUDE CASUAL OR HOLIDAY<br />
WORK (EXTRA INT. INSTRUCTION<br />
ADDED <strong>2003</strong> ONWARDS)<br />
(HELP )"<br />
TMainJb / QTMainJb.NTS<br />
BMainJb<br />
Questions asked of:<br />
Each individual household member<br />
aged 16 and over in turn, if the<br />
following conditions are met:<br />
DVILO3a= “InEmp” (ILO<br />
classification of employment:<br />
Employed)<br />
AND<br />
Everwk = Yes (1)<br />
IF respondent is aged 16 or<br />
over(DvAge >=16) AND employment<br />
status is derived as employed<br />
(DVILO3a = InEmp) OR respondent<br />
has had a paid job (Everwk = Yes)<br />
THEN<br />
IndD<br />
"^LDMIntName<br />
CURRENT OR LAST JOB<br />
What did/(does) the firm/organisation<br />
you work(ed) for mainly make or do (at<br />
the place where you work(ed))?<br />
DESCRIBE FULLY - PROBE<br />
MANUFACTURING or PROCESSING<br />
or DISTRIBUTING ETC. AND MAIN<br />
GOODS PRODUCED, MATERIALS<br />
USED, WHOLESALE or RETAIL<br />
ETC."<br />
IF employment status is derived as<br />
employed (DVILO3a = InEmp) OR<br />
respondent has had a paid job<br />
(Everwk = Yes)<br />
OccT<br />
"^LDMIntName<br />
^s^s^s^s JOB TITLE^s^s^s CURRENT<br />
OR LAST JOB<br />
National Centre for Social Research<br />
243<br />
What was/(is) your (main) job<br />
(^LMainJb2 ^DLSUNTxt)? (HELP<br />
)"<br />
IF employment status is derived as<br />
employed (DVILO3a = InEmp) OR<br />
respondent has had a paid job<br />
(Everwk = Yes)<br />
OccD<br />
"^LDMIntName<br />
^s^s^s CURRENT OR LAST JOB<br />
What did/ (do) you mainly do in your<br />
job?<br />
CHECK SPECIAL<br />
QUALIFICATIONS/TRAINING<br />
NEEDED TO DO THE JOB"<br />
IF employment status is derived as<br />
employed (DVILO3a = InEmp) OR<br />
respondent has had a paid job<br />
(Everwk = Yes)<br />
Stat<br />
"^LDMIntName<br />
Were/(are) you working as an<br />
employee or were/(are) you selfemployed?<br />
(HELP )"<br />
1. "Employee"<br />
2. "Self-employed"<br />
IF (employment status is derived as<br />
employed (DVILO3a = InEmp) OR<br />
respondent has had a paid job<br />
(Everwk = Yes)) AND respondent was<br />
an employee (Stat = Emp) THEN<br />
SVise<br />
"^LDMIntName<br />
In your job, do/(did) you have formal<br />
responsibility for supervising the work<br />
of other employees?<br />
DO NOT INCLUDE PEOPLE WHO<br />
ONLY SUPERVISE:<br />
- children, e.g. teachers, nannies,<br />
childminders<br />
- animals<br />
- security or buildings, e.g. caretakers,<br />
security guards "<br />
1. "Yes"<br />
2. "No"
IF (employment status is derived as<br />
employed (DVILO3a = InEmp) OR<br />
respondent has had a paid job<br />
(Everwk = Yes)) AND respondent was<br />
an employee (Stat = Emp) AND<br />
respondent did supervise other<br />
employees (SVise = Yes) THEN<br />
SViseDesc<br />
"^LDMIntName<br />
Please describe the type of<br />
responsibility you have for supervising<br />
the work of other employees.<br />
INTERVIEWER: PROBE FOR WHO<br />
AND WHAT IS BEING SUPERVISED"<br />
IF (employment status is derived as<br />
employed (DVILO3a = InEmp) OR<br />
respondent has had a paid job<br />
(Everwk = Yes)) AND respondent was<br />
an employee (Stat = Emp)<br />
EmpNo<br />
"^LDMIntName<br />
How many people work(ed) for your<br />
employer at the place where you<br />
work(ed)?<br />
Were there ^s^s^s ...READ OUT<br />
(HELP )"<br />
1. "...1 to 24,"<br />
2. "25 to 499,"<br />
3. "or 500 or more employees?"<br />
IF (employment status is derived as<br />
employed (DVILO3a = InEmp) OR<br />
respondent has had a paid job<br />
(Everwk = Yes)) AND respondent was<br />
not an employee (NOT(Stat =<br />
Emp))AND respondent was/is self<br />
employed (Stat = SelfEmp) THEN<br />
Solo<br />
"^LDMIntName<br />
Were/(are) you working on your own<br />
or did/(do) you have employees?<br />
ASK OR RECORD<br />
(HELP )"<br />
1. "on own/with partner(s) but no<br />
employees"<br />
2. "with employees"<br />
National Centre for Social Research<br />
244<br />
IF respondent works/has worked with<br />
employees (Solo = WithEmp) THEN<br />
SENo<br />
"^LDMIntName<br />
How many people did/(do) you employ<br />
at the place where you work(ed)?<br />
Were/(Are) there ^s^s^s ... READ OUT<br />
... (HELP )"<br />
1. "...1 to 24,"<br />
2. "25 to 499,"<br />
3. "or 500 or more employees?"<br />
(PRECODES CHANGED <strong>2003</strong><br />
ONWARDS TO:)<br />
1. "...1 to 24,"<br />
2. "or, 25 or more?"<br />
IF employment status is derived as<br />
employed (DVILO3a = InEmp) OR<br />
respondent has had a paid job<br />
(Everwk = Yes) THEN<br />
FtPtWk<br />
"^LDMIntName<br />
In your (main) job were/(are) you<br />
working... READ OUT ...<br />
(HELP )"<br />
1. "...full time,"<br />
2. "or part time?"<br />
TTrBen / QTTrBen.NTS<br />
BTrBen<br />
Questions asked of:<br />
Each individual household member<br />
aged 16 and over in turn, if the<br />
following conditions are met:<br />
DVILO3a= “InEmp” (ILO<br />
classification of employment:<br />
Employed)<br />
AND<br />
Stat = Emp (respondent is an<br />
employee)<br />
IF respondents employment status is<br />
derived as employed and respondent<br />
was working as an employee
(DVILO3a = InEmp AND Stat = Emp)<br />
THEN<br />
TrBen<br />
"^LDMIntName<br />
SHOW CARD K.<br />
Are any employees at your place of<br />
work (in your main job) offered any of<br />
the travel benefits on this card? IF<br />
YES, PROBE: Which ones? (HELP<br />
)<br />
EXCLUDE REIMBURSED<br />
EXPENSES, TRAVEL WARRANTS<br />
ETC.<br />
CODE ALL THAT APPLY"<br />
1. "Cut price or free bus tickets"<br />
2. "Cut price or free rail tickets"<br />
3. "Interest-free loan for a season<br />
ticket or travel pass"<br />
4. "Interest-free loan for a season<br />
ticket for parking"<br />
5. "Cut price or free car parking"<br />
6. "Company car or alternative<br />
benefit in place of a car"<br />
7. "Special bus or van run by your<br />
employer for your journey to work"<br />
8. "Other transport-related benefits<br />
(specify)"<br />
9. "No, none of these"<br />
(PRECODES CHANGED <strong>2003</strong> ONLY<br />
TO:)<br />
1. "Cut price or free bus tickets"<br />
2. "Cut price or free rail tickets"<br />
3. "Interest-free loan for a season<br />
ticket or travel pass"<br />
4. "Interest-free loan for a season<br />
ticket for parking"<br />
5. "Cut price or free car parking"<br />
6. "Company car or alternative<br />
benefit in place of a car"<br />
7. "Use of car(s) from company car<br />
pool"<br />
8. "Special bus or van run by your<br />
employer for your journey to work"<br />
9. "Other transport-related benefits<br />
(specify)"<br />
10. "No, none of these"<br />
TrBen (QUESTION DELETED <strong>2004</strong><br />
ONWARDS)<br />
National Centre for Social Research<br />
245<br />
IF employees are offered other<br />
transport related benefit (TrBen =<br />
other) THEN<br />
XTrBen<br />
"^LDMIntName<br />
Please specify other answer.<br />
TEXT SHOULD BE NO MORE THAN<br />
60 CHARACTERS"<br />
XtrBen (QUESTION DELETED <strong>2004</strong><br />
ONWARDS)<br />
IF respondent is/was working as an<br />
employee (DVILO3a = InEmp AND<br />
Stat = Emp) AND respondent receives<br />
travel benefit (TrBen = RESPONSE)<br />
THEN<br />
TrBenU<br />
"^LDMIntName<br />
SHOW CARD K.<br />
And does your employer (in your main<br />
job) offer @Iyou@I any of the benefits<br />
on this card?<br />
IF YES, PROBE: Which ones? (HELP<br />
)<br />
EXCLUDE REIMBURSED<br />
EXPENSES, TRAVEL WARRANTS<br />
ETC.<br />
CODE ALL THAT APPLY"<br />
1. "Cut price or free bus tickets"<br />
2. "Cut price or free rail tickets"<br />
3. "Interest-free loan for a season<br />
ticket or travel pass"<br />
4. "Interest-free loan for a season<br />
ticket for parking"<br />
5. "Cut price or free car parking"<br />
6. "Company car or alternative<br />
benefit in place of a car"<br />
7. "Special bus or van run by your<br />
employer for your journey to work"<br />
8. "Other transport-related benefits<br />
(specify)"<br />
9. "No, none of these"<br />
(PRECODES CHANGED <strong>2003</strong><br />
ONWARDS TO:)<br />
1. "Cut price or free bus tickets"<br />
2. "Cut price or free rail tickets"<br />
3. "Interest-free loan for a season<br />
ticket or travel pass"
4. "Interest-free loan for a season<br />
ticket for parking"<br />
5. "Cut price or free car parking"<br />
6. "Company car or alternative<br />
benefit in place of a car"<br />
7. "Use of car(s) from company car<br />
pool"<br />
8. "Special bus or van run by your<br />
employer for your journey to work"<br />
9. "Other transport-related benefits<br />
(specify)"<br />
10. "No, none of these"<br />
(ROUTING CHANGED <strong>2004</strong><br />
ONWARDS TO:<br />
IF respondent is/was working as an<br />
employee (DVILO3a = InEmp AND<br />
Stat = Emp) THEN<br />
TrBenU<br />
IF respondent was offered some other<br />
travel benefit (TrBenU = other) THEN<br />
XTrBenU<br />
"^LDMIntName<br />
Please specify other answer.<br />
TEXT SHOULD BE NO MORE THAN<br />
60 CHARACTERS"<br />
IF respondent is/was working as an<br />
employee (DVILO3a = InEmp AND<br />
Stat = Emp) ANDrespondent was<br />
offered cut price or free bus tickets<br />
(TrBenU = BusT) THEN<br />
UseBusT<br />
"^LDMIntName<br />
Do you make use of the cut price or<br />
free bus tickets?"<br />
1. "Yes"<br />
2. "No"<br />
IF respondent is/was working as an<br />
employee (DVILO3a = InEmp AND<br />
Stat = Emp) ANDrespondent was<br />
offered cut price or free train tickets<br />
(TrBenU = TrnT) THEN<br />
UseTrnT<br />
"^LDMIntName<br />
Do you make use of the cut price or<br />
free train tickets?"<br />
National Centre for Social Research<br />
246<br />
1. "Yes"<br />
2. "No"<br />
IF respondent is/was working as an<br />
employee (DVILO3a = InEmp AND<br />
Stat = Emp) ANDrespondent was<br />
offered interest-free loan for a season<br />
ticket or travel pass (TrBenU = Loan)<br />
THEN<br />
UseLoan<br />
"^LDMIntName<br />
Do you make use of the interest-free<br />
loan for a season ticket or travel<br />
pass?"<br />
1. "Yes"<br />
2. "No"<br />
IF respondent is/was working as an<br />
employee (DVILO3a = InEmp AND<br />
Stat = Emp) ANDrespondent was<br />
offered interest-free loan for a season<br />
ticket for parking (TrBenU =PLoan)<br />
THEN<br />
UsePL<br />
"^LDMIntName<br />
Do you make use of the interest-free<br />
loan for a season ticket for parking?"<br />
1. "Yes"<br />
2. "No"<br />
IF respondent is/was working as an<br />
employee (DVILO3a = InEmp AND<br />
Stat = Emp) ANDrespondent was<br />
offered cut price or free car parking<br />
(TrBenU = FreeP) THEN<br />
UseFP<br />
"^LDMIntName<br />
Do you make use of the cut price or<br />
free car parking?"<br />
1. "Yes"<br />
2. "No"<br />
IF respondent is/was working as an<br />
employee (DVILO3a = InEmp AND<br />
Stat = Emp) ANDrespondent was<br />
offered special bus or van run by<br />
employer (TrBenU = WrkB) THEN<br />
UseWrkB
"^LDMIntName<br />
Do you make use of the special bus or<br />
van run by your employer for your<br />
journey to work?"<br />
1. "Yes"<br />
2. "No"<br />
IF respondent is/was working as an<br />
employee (DVILO3a = InEmp AND<br />
Stat = Emp) AND respondent was<br />
offered a company car (TrBenU =<br />
Ccar) THEN<br />
CarAlt<br />
"^LDMIntName<br />
You said you were offered a company<br />
car. Were you offered any alternative<br />
benefits such as cash, or was there no<br />
choice?<br />
NOTE: IF CHOSE CAR FROM A<br />
RANGE OF BENEFITS, CODE<br />
'OFFERED ALTERNATIVE'"<br />
1. "Offered alternative"<br />
2. "No choice"<br />
IF respondent is/was working as an<br />
employee (DVILO3a = InEmp AND<br />
Stat = Emp) AND respondent was<br />
offered alternative to company car<br />
(CarAlt = Alt) THEN<br />
CarCh<br />
"^LDMIntName<br />
And did you choose the company car<br />
or did you choose the alternative<br />
benefit(s) instead?"<br />
1. "Chose company car"<br />
2. "Chose alternative benefit"<br />
(QUESTION ADDED <strong>2004</strong><br />
ONWARDS:)<br />
IF respondent is/was working as an<br />
employee (DVILO3a = InEmp AND<br />
Stat = Emp) AND respondent was<br />
offered no choice to company car<br />
(CarAlt = NoC) THEN<br />
CarAltA<br />
"LDMIntName<br />
So can I check - did you accept the<br />
offer of a company car or not?"<br />
National Centre for Social Research<br />
247<br />
1. "Yes"<br />
2. "No"<br />
TIncme / QTIncme.NTS<br />
BIncme<br />
Questions asked of:<br />
Each individual household member<br />
aged 16 and over in turn<br />
If age is 16 or over (DvAge >= 16)<br />
THEN<br />
Incme<br />
"^LDMIntName<br />
SHOW CARD L<br />
This card shows a number of possible<br />
sources of income. Can you tell me<br />
which different kinds of income you<br />
personally receive?<br />
PRESS FOR SOURCES OF<br />
INCOME SHOWN ON CARD L<br />
CODE 1 IF INFORMANT RECEIVES<br />
INCOME FROM ANY OF THESE<br />
SOURCES<br />
CODE 2 IF INFORMANT STATES<br />
THAT THEY HAVE NO SOURCE OF<br />
INCOME"<br />
(CHANGED <strong>2004</strong> ONWARDS TO:)<br />
"^LDMIntName<br />
SHOW CARD L<br />
This card shows a number of possible<br />
sources of income. Can you tell me<br />
whether you personally receive<br />
income from any of these? I do not<br />
need to know which.<br />
PRESS FOR SOURCES OF<br />
INCOME SHOWN ON CARD L<br />
CODE 1 IF INFORMANT RECEIVES<br />
INCOME FROM ANY OF THESE<br />
SOURCES<br />
CODE 2 IF INFORMANT STATES<br />
THAT THEY HAVE NO SOURCE OF<br />
INCOME"<br />
If age is 16 or over (DvAge >= 16)<br />
AND respondent received income<br />
(NOT(Incme = Noinc)) THEN<br />
IncGrp
"^LDMIntName<br />
SHOW CARD M<br />
Which of the letters on this card<br />
represents your own gross income<br />
from all sources mentioned?<br />
By gross income, I mean income from<br />
all sources before deductions for<br />
income tax, National Insurance etc.<br />
Please just tell me the letter. (HELP<br />
)<br />
INTEVIEWER - PLEASE TYPE IN<br />
THE LETTER"<br />
If respondent is the Household<br />
Reference Person AND the number of<br />
adults in the household is greater than<br />
1 (QTHComp.NumAdult > 1) THEN<br />
HIncGrp<br />
"^LDMIntName.<br />
SHOW CARD M<br />
INTERVIEWER: IF YOU ALREADY<br />
KNOW THAT THIS IS A ONE<br />
PERSON HOUSEHOLD, YOU CAN<br />
ENTER THE SAME ANSWER GIVEN<br />
AT THE PREVIOUS QUESTION<br />
(^IncGrp)<br />
And now think of the income of the<br />
household as a whole. Which of the<br />
letters on this card represents the<br />
gross income of the WHOLE<br />
household? (HELP )<br />
INTEVIEWER - PLEASE TYPE IN<br />
THE LETTER"<br />
TWorkPl / QTWorkPl.NTS<br />
BWorkPl<br />
Questions asked of :<br />
Each individual household member<br />
aged 16 and over in turn, if the<br />
following condition is met:<br />
DVILO3a= “InEmp” (ILO<br />
classification of employment:<br />
Employed)<br />
IF employment status derived as<br />
employed (DVILO3a = InEmp)THEN<br />
WkPlace<br />
"^LDMIntName<br />
National Centre for Social Research<br />
248<br />
When you go to work do you... READ<br />
OUT<br />
(HELP )"<br />
1. "...go to the same place every<br />
time,"<br />
2. "go to the same place on at least 2<br />
days running each week,"<br />
3. "go to different places,"<br />
4. "or work at home or in the same<br />
building as your home."<br />
IF respondent goes to the same<br />
workplace each time or at least 2 days<br />
a week (WkPlace = SameEv, or<br />
WkPlace = SameUse] THEN<br />
WkCode<br />
"^LDMIntName<br />
Where do you go to work?<br />
ADD IF NECESSARY: Can you tell me<br />
the town or area?<br />
INTERVIEWER: TYPE IN FIRST FEW<br />
LETTERS OF PLACE NAME TO<br />
ENTER CODING FRAME. IF THE<br />
PLACE IS NOT LISTED, TYPE XXX<br />
AND CODE AS 89 (NOT<br />
LISTED/DON'T KNOW)<br />
IF NECESSARY USE SHOW CARD N<br />
TO FIND OUT WHETHER THIS<br />
PLACE IS WITHIN M25 BOUNDARY.<br />
ON EXITING CODING FRAME<br />
PRESS ENTER TO MOVE TO NEXT<br />
QUESTION."<br />
If placename is not listed (WkCode =<br />
89) THEN<br />
XWkCode<br />
"^LDMIntName<br />
INTERVIEWER: TYPE IN NAME OF<br />
WORK PLACE, INCLUDING COUNTY<br />
OR NEAREST LARGE TOWN"<br />
IF respondent goes to the same<br />
workplace each time or at least 2 days<br />
a week (WkPlace = SameEv, or<br />
WkPlace = SameUse] IF respondent<br />
works in central London (WkUrbCd =<br />
23) THEN<br />
WkLon<br />
"^LDMIntName
SHOW CARD O Is it within the area<br />
shown on this map?<br />
SHOW CARD O FOR MAP OF<br />
CENTRAL LONDON"<br />
1. "Within"<br />
2. "Not within"<br />
IF respondent goes to the same<br />
workplace each time or at least 2 days<br />
a week (WkPlace = SameEv, or<br />
WkPlace = SameUse] AND<br />
respondent works in a town (WkUrbCd<br />
= 1..22 OR WkUrbCd = 24..48) THEN<br />
WkTown<br />
"^LDMIntName<br />
Is it within ^LWorkPl1?"<br />
1. "Within"<br />
2. "Not within"<br />
IF respondent goes to the same<br />
workplace each time or at least 2 days<br />
a week (WkPlace = SameEv, or<br />
WkPlace = SameUse] AND<br />
respondent works in an urban area<br />
(WkUrbCd = 50, 89 AND UrbRural =<br />
1..14, 89] THEN<br />
WkOthUrb<br />
"^LDMIntName<br />
Is it within 5 mins walk of the main<br />
shopping/business centre?"<br />
1. "Within"<br />
2. "Not within"<br />
TWkMeth / QTWkMeth.NTS<br />
BWkMeth<br />
Questions asked of:<br />
Each individual household member<br />
aged 16 and over in turn, if the<br />
following condition is met:<br />
WkPlace = (1) or (2) or (3)<br />
IF respondent works at same place<br />
every time, or at least 2 days a week<br />
or goes to different places (WkPlace =<br />
National Centre for Social Research<br />
249<br />
SameEv, OR SameUse OR Differ)<br />
THEN<br />
WkTrav<br />
"^LDMIntName<br />
How do you usually travel to work?<br />
THIS QUESTION APPLIES FOR THE<br />
MAIN JOB, THAT IS THE JOB IN<br />
WHICH RESPONDENT USUALLY<br />
WORKS THE MOST HOURS.<br />
CODE ONE ONLY, FOR THE<br />
LONGEST PART, BY DISTANCE, OF<br />
THE RESPONDENT'S USUAL<br />
JOURNEY TO WORK. (HELP )"<br />
1. "Underground, metro, light rail,<br />
tram"<br />
2. "Train"<br />
3. "Bus, minibus or coach"<br />
4. "Motorcycle, scooter or moped"<br />
5. "Car or van"<br />
6. "Taxi/minicab"<br />
7. "Bicycle"<br />
8. "On foot"<br />
97. "Other (specify)"<br />
If respondent travels to work some<br />
other way (WkTrav = other) THEN<br />
XWkTrav<br />
"^LDMIntName<br />
INTERVIEWER: Please record how<br />
informant usually travels to work.<br />
Remember to recode WkTrav 1 to 8<br />
where possible. (HELP )<br />
If respondent now says they work and<br />
live in the same premises then please<br />
go back and amend WkPlace"<br />
IF respondent normally travels to work<br />
by car (WkTrav = Car) THEN<br />
WkDrive<br />
"^LDMIntName<br />
When travelling to work are<br />
you...READ OUT"<br />
1. "...usually the driver,"<br />
2. "usually the passenger,"<br />
3. "or sometimes driver and<br />
sometimes passenger"
IF respondent travels to work by car or<br />
motorbike (WkTrav IN [Car, Mbike])<br />
THEN<br />
WkVEH<br />
"^LDMIntName<br />
Does your household own or have<br />
regular use of the vehicle that you<br />
travel to work in?<br />
IF MORE THAN ONE, PROBE FOR<br />
MAIN VEHICLE"<br />
1. "Yes"<br />
2. "No"<br />
WkVEH(QUESTION DELETED <strong>2004</strong><br />
ONWARDS)<br />
TWkHome / QTWkHome.NTS<br />
BWkHome<br />
Questions asked of:<br />
Each individual household member<br />
aged 16 and over in turn, if the<br />
following condition is met:<br />
DVILO3a= “InEmp” (ILO<br />
classification of employment:<br />
Employed)<br />
IF respondent works at same place<br />
every time, or at least 2 days a week<br />
or goes to different places (WkPlace =<br />
SameEv, OR SameUse OR Differ)<br />
THEN<br />
WkHome<br />
"^LDMIntName<br />
Can I just check, in the week ending<br />
last Sunday (the ^DLSUNTxt), did you<br />
work at home on any of the days<br />
INSTEAD of travelling to your usual<br />
place of work? (HELP )"<br />
1. "Yes"<br />
2. "No"<br />
IF respondent did work at home<br />
(WkHome = Yes) THEN<br />
HomeDay<br />
"^LDMIntName<br />
On which days did you work at home?<br />
CODE ALL THAT APPLY"<br />
National Centre for Social Research<br />
250<br />
1. "Monday"<br />
2. "Tuesday"<br />
3. "Wednesday"<br />
4. "Thursday"<br />
5. "Friday"<br />
6. "Saturday"<br />
7. "Sunday"<br />
IF respondent did not work at home<br />
(WkHome = NO) THEN<br />
PossHom<br />
"^LDMIntName<br />
Can I check, in your (main) job, would<br />
it be possible to do your kind of work<br />
at home instead of travelling to work?<br />
IF SOMETIMES, CODE 'YES'<br />
IF POSSIBLE TO BORROW<br />
NECESSARY EQUIPMENT FROM<br />
WORK, (E.G. LAPTOP, SEWING<br />
MACHINE), CODE YES"<br />
1. "Yes"<br />
2. "No"<br />
IF respondent did work at home<br />
(WkHome = Yes) OR if it possible for<br />
respondent to work from home<br />
(PossHom = Yes) THEN<br />
OftHome<br />
"^LDMIntName<br />
How often do you work at home (in<br />
your main job) instead of travelling to<br />
work?<br />
NOTE: DO NOT INCLUDE IF<br />
OUTSIDE NORMAL WORKING<br />
HOURS E.G. ADDITIONAL WORK AT<br />
HOME IN EVENING/WEEKENDS"<br />
1. "3 or more times a week"<br />
2. "Once or twice a week"<br />
3. "Less than that but more than<br />
twice a month"<br />
4. "Once or twice a month"<br />
5. "Less than that but more than<br />
twice a year"<br />
6. "Once or twice a year"<br />
7. "Less than that or never"<br />
IF respondent works at home less than<br />
once or twice a year (OftHome =<br />
LessYear) THEN
YNotWkH<br />
"^LDMIntName<br />
Why do you not work at home (more<br />
often) in your present (main) job?<br />
CODE ALL THAT APPLY"<br />
1. "Do not have a<br />
computer/modem/fax/telephone at<br />
home"<br />
2. "Employer does not allow it"<br />
3. "Just prefer not to"<br />
4. "No space to work at home"<br />
5. "Children at home "<br />
97. "Other reason (specify)"<br />
If respondent has another reason why<br />
they do not work at home more often<br />
(YnotWkH = other) THEN<br />
XYNotWkH<br />
"^LDMIntName<br />
Please specify other reasons.<br />
TEXT SHOULD BE NO MORE THAN<br />
60 CHARACTERS"<br />
IF respondent works at home at least<br />
once or twice a year or worked at<br />
home during the last 7 days (OftHome<br />
= Wkly3..Yearly1 OR WkPlace =<br />
Home) THEN<br />
TelComp<br />
"^LDMIntName<br />
When you work at home, do you<br />
usually use a telephone or a<br />
computer?<br />
IF YES, PROBE: Which do you use?"<br />
1. "Yes, telephone only"<br />
2. "Yes, computer only"<br />
3. "Yes, both"<br />
4. "No"<br />
IF respondent could work from home<br />
using a telephone, or both a telephone<br />
and computer (TelComp = Tel OR<br />
Both] THEN<br />
PossTel<br />
"^LDMIntName<br />
Would it be possible for you to work at<br />
home without the use of a telephone?"<br />
1. "Yes, always"<br />
2. "Yes, sometimes"<br />
National Centre for Social Research<br />
251<br />
3. "No, never"<br />
IF respondent could work from home<br />
using a computer, or both a telephone<br />
and computer (TelComp = Comp OR<br />
Both] THEN<br />
PossComp<br />
"^LDMIntName<br />
Would it be possible for you to work at<br />
home without the use of a computer?"<br />
1. "Yes, always"<br />
2. "Yes, sometimes"<br />
3. "No, never"<br />
TWkDiff / QTWkDiff.NTS<br />
BWkDiff<br />
Questions asked of:<br />
Each individual household member<br />
aged 16 and over in turn, if the<br />
following condition is met:<br />
WkPlace = (1), (2) or (3)<br />
IF respondent works at same place<br />
every time, or at least 2 days a week<br />
or goes to different places (WkPlace =<br />
SameEv, OR SameUse OR Differ)<br />
AND respondent travels to work by car<br />
or motorbike (WkTrav IN [Car, Mbike])<br />
THEN<br />
CarW<br />
"^LDMIntName<br />
(I'm now going to ask a few questions<br />
about how easy or difficult you find it to<br />
make different types of journeys, and<br />
why.)<br />
Do you usually experience any<br />
difficulties with travelling to or from<br />
work by ^CarBike?<br />
IF YES,PROBE: What difficulties?<br />
CODE ALL THAT APPLY "<br />
1. "No, no difficulties"<br />
2. "Too far/long journey"<br />
3. "Cost of petrol"<br />
4. "Lack of parking facilities"<br />
5. "Cost of parking"<br />
6. "Personal disability"<br />
7. "Concerns over personal safety"
8. "Traffic congestion/roadworks"<br />
9. "The weather"<br />
97. "Other (specify)"<br />
(PRECODES CHANGED <strong>2004</strong><br />
ONWARDS TO:)<br />
"No no difficulties"<br />
"Too far"<br />
3. "Car not available"<br />
4. "Don't have a current driving<br />
licence/can't drive"<br />
5. "Cost of petrol"<br />
6. "Lack of parking facilities"<br />
7. "Cost of parking"<br />
8. "Traffic congestion/roadworks"<br />
9. "Inadequate public transport"<br />
10. "Cost of using public transport"<br />
11. "Personal physical<br />
difficulties/disability"<br />
12. "Personal safety concerns"<br />
97. "Other (specify)"<br />
IF respondent experiences some other<br />
difficulty (CarW = Other) THEN<br />
XCarW<br />
"^LDMIntName<br />
specify other answer.<br />
TEXT SHOULD BE NO MORE THAN<br />
60 CHARACTERS"<br />
If respondent has more than one<br />
difficulty (CarW > 1) THEN<br />
CarWM<br />
"^LDMIntName<br />
And which @Ione@I of these things<br />
creates most difficulty?<br />
CODE ONE ONLY "<br />
1. "No, no difficulties"<br />
2. "Too far/long journey"<br />
3. "Cost of petrol"<br />
4. "Lack of parking facilities"<br />
5. "Cost of parking"<br />
6. "Personal disability"<br />
7. "Concerns over personal safety"<br />
8. "Traffic congestion/roadworks"<br />
9. "The weather"<br />
97. "Other (specify)"<br />
National Centre for Social Research<br />
252<br />
(PRECODES CHANGED <strong>2004</strong><br />
ONWARDS TO:)<br />
1. "No no difficulties"<br />
2. "Too far"<br />
3. "Car not available"<br />
4. "Don't have a current driving<br />
licence/can't drive"<br />
5. "Cost of petrol"<br />
6. "Lack of parking facilities"<br />
7. "Cost of parking"<br />
8. "Traffic congestion/roadworks"<br />
9. "Inadequate public transport"<br />
10. "Cost of using public transport"<br />
11. "Personal physical<br />
difficulties/disability"<br />
12. "Personal safety concerns"<br />
97. "Other (specify)"<br />
If respondent has some other difficulty<br />
(CarWM = Other) THEN<br />
XCarWM<br />
"^LDMIntName<br />
Please specify other answer.<br />
TEXT SHOULD BE NO MORE THAN<br />
60 CHARACTERS"<br />
IF respondent works at same place<br />
every time, or at least 2 days a week<br />
or goes to different places (WkPlace =<br />
SameEv, OR SameUse OR Differ)<br />
AND respondent travels to work by car<br />
or motorbike (WkTrav IN [Car, Mbike])<br />
THEN<br />
CarWEas<br />
"^LDMIntName<br />
SHOW CARD P.<br />
Suppose for some reason you could<br />
not use a ^carbike for travelling to or<br />
from work. How easy or difficult would<br />
it be to make this journey some other<br />
way? Please take your answer from<br />
this card. (HELP )"<br />
1. "Very easy"<br />
2. "Quite easy"<br />
3. " Neither easy nor difficult"<br />
4. "Quite difficult"<br />
5. "Very difficult"<br />
CarWeas(QUESTION DELETED <strong>2004</strong><br />
ONWARDS)
IF respondent would find it quite<br />
difficult or very difficult to make their<br />
journey some other way (CarWEas =<br />
Qdiff OR Vdiff) THEN<br />
CarWY<br />
"^LDMIntName<br />
Why would this be difficult?<br />
CODE ALL THAT APPLY"<br />
1. "Too far/long journey"<br />
2. "Journey not possible by public<br />
transport"<br />
3. "Unreliable public transport"<br />
4. "Cost of using public<br />
transport/taxis"<br />
5. "Poor information about public<br />
transport services"<br />
6. "Poor connections"<br />
7. "Finds public transport unpleasant"<br />
8. "Personal disability"<br />
9. "Concerns over personal safety"<br />
10. "Traffic congestion/roadworks"<br />
11. "Difficulties with dropping other<br />
people off on the way"<br />
12. "The weather"<br />
"Other (specify)"<br />
(PRECODES CHANGED <strong>2003</strong> ONLY<br />
TO:)<br />
1. "Too far/long journey"<br />
2. "Journey not possible by public<br />
transport"<br />
"Distance to public transport"<br />
"Unreliable public transport"<br />
"Cost of using public transport/taxis"<br />
"Poor information about public<br />
transport services"<br />
"Poor connections"<br />
"Finds public transport unpleasant"<br />
"Personal disability"<br />
"Concerns over personal safety"<br />
"Traffic congestion/roadworks"<br />
"Difficulties with dropping other people<br />
off on the way"<br />
13. "Vehicle essential for job (e.g. taxi<br />
driver/doctor)"<br />
14. "The weather"<br />
97. "Other (specify)"<br />
CarWy (QUESTION DELETED <strong>2004</strong><br />
ONWARDS)<br />
National Centre for Social Research<br />
253<br />
If there is another reason why<br />
respondent would find it difficult<br />
(CarWY = Other) THEN<br />
XCarWY<br />
"^LDMIntName<br />
Please specify other answer.<br />
TEXT SHOULD BE NO MORE THAN<br />
60 CHARACTERS"<br />
XCarWY(QUESTION DELETED <strong>2004</strong><br />
ONWARDS)<br />
IF more than one thing would create<br />
difficulty (CarWY > 1) THEN<br />
CarWYM<br />
"^LDMIntName<br />
And which @Ione@I of these things<br />
would create most difficulty for you?<br />
CODE ONE ONLY"<br />
1. "Too far/long journey"<br />
2. "Journey not possible by public<br />
transport"<br />
3. "Unreliable public transport"<br />
4. "Cost of using public<br />
transport/taxis"<br />
5. "Poor information about public<br />
transport services"<br />
6. "Poor connections"<br />
7. "Finds public transport unpleasant"<br />
8. "Personal disability"<br />
9. "Concerns over personal safety"<br />
10. "Traffic congestion/roadworks"<br />
11. "Difficulties with dropping other<br />
people off on the way"<br />
12. "The weather"<br />
97. "Other (specify)"<br />
(PRECODES CHANGED <strong>2003</strong> ONLY<br />
TO:)<br />
1. "Too far/long journey"<br />
2. "Journey not possible by public<br />
transport"<br />
"Distance to public transport"<br />
"Unreliable public transport"<br />
"Cost of using public transport/taxis"<br />
"Poor information about public<br />
transport services"<br />
"Poor connections"<br />
"Finds public transport unpleasant"<br />
"Personal disability"<br />
"Concerns over personal safety"
"Traffic congestion/roadworks"<br />
"Difficulties with dropping other people<br />
off on the way"<br />
13. "Vehicle essential for job (e.g. taxi<br />
driver/doctor)"<br />
14. "The weather"<br />
97. "Other (specify)"<br />
CarWYM (QUESTION DELETED<br />
<strong>2004</strong> ONWARDS)<br />
If there is another reason that would<br />
create difficulty (CarWYM =<br />
Other)THEN<br />
XCarWYM<br />
"^LDMIntName<br />
Please specify other answer.<br />
TEXT SHOULD BE NO MORE THAN<br />
60 CHARACTERS"<br />
XCarWYM (QUESTION DELETED<br />
<strong>2004</strong> ONWARDS)<br />
IF respondent works at same place<br />
every time, or at least 2 days a week<br />
or goes to different places (WkPlace =<br />
SameEv, OR SameUse OR Differ)<br />
AND respondent does not travel to<br />
work in a private car or motorbike<br />
(WkTrav IN [Tube, Train, Bus, Taxi ..<br />
Other]) THEN<br />
OthW<br />
"^LDMIntName<br />
(I'm now going to ask a few questions<br />
about how easy or difficult you find it to<br />
make different types of journeys, and<br />
why.)<br />
Do you usually experience any<br />
difficulties with travelling to or from<br />
work by ^TrMode?<br />
IF YES, PROBE: What difficulties?<br />
CODE ALL THAT APPLY"<br />
1. "No, no difficulties"<br />
2. "Too far/long journey"<br />
3. "Journey not possible by public<br />
transport"<br />
4. "Unreliable public transport"<br />
5. "Cost of using public<br />
transport/taxis"<br />
National Centre for Social Research<br />
254<br />
6. "Poor information about public<br />
transport services"<br />
7. "Poor connections"<br />
8. "Finds public transport unpleasant"<br />
9. "Personal disability"<br />
10. "Concerns over personal safety"<br />
11. "Traffic congestion/roadworks"<br />
12. "The weather"<br />
97. "Other (specify)"<br />
(PRECODES CHANGED <strong>2003</strong><br />
ONWARDS TO:)<br />
1. "No, no difficulties"<br />
2. "Too far/long journey"<br />
3. "Journey not possible by public<br />
transport"<br />
4. "Unreliable public transport"<br />
5. "Cost of using public<br />
transport/taxis"<br />
6. "Poor information about public<br />
transport services"<br />
7. "Poor connections"<br />
8. "Finds public transport unpleasant"<br />
9. "Personal disability"<br />
10. "Concerns over personal safety"<br />
"Traffic congestion/roadworks"<br />
"Lack of/no cycle lanes<br />
13. "The weather"<br />
97. "Other (specify)"<br />
IF respondent experiences some other<br />
difficulty (OthW = Other) THEN<br />
XOthW<br />
"^LDMIntName<br />
Please specify other answer.<br />
TEXT SHOULD BE NO MORE THAN<br />
60 CHARACTERS"
If respondent has more than one<br />
difficulty (OthW > 1) THEN<br />
OthWM<br />
"^LDMIntName<br />
And which @Ione@I of these things<br />
creates most difficulty?<br />
CODE ONE ONLY"<br />
1. "No, no difficulties"<br />
2. "Too far/long journey"<br />
3. "Journey not possible by public<br />
transport"<br />
4. "Unreliable public transport"<br />
5. "Cost of using public<br />
transport/taxis"<br />
6. "Poor information about public<br />
transport services"<br />
7. "Poor connections"<br />
8. "Finds public transport unpleasant"<br />
9. "Personal disability"<br />
10. "Concerns over personal safety"<br />
11. "Traffic congestion/roadworks"<br />
12. "The weather"<br />
97. "Other (specify)"<br />
(PRECODES CHANGED <strong>2003</strong><br />
ONWARDS TO:)<br />
1. "No, no difficulties"<br />
2. "Too far/long journey"<br />
3. "Journey not possible by public<br />
transport"<br />
4. "Unreliable public transport"<br />
5. "Cost of using public<br />
transport/taxis"<br />
6. "Poor information about public<br />
transport services"<br />
7. "Poor connections"<br />
8. "Finds public transport unpleasant"<br />
9. "Personal disability"<br />
10. "Concerns over personal safety"<br />
"Traffic congestion/roadworks"<br />
"Lack of/no cycle lanes<br />
13. "The weather"<br />
97. "Other (specify)"<br />
IF respondent has some other difficulty<br />
(CarWM = Other) THEN<br />
XOthWM<br />
"^LDMIntName<br />
Please specify other answer.<br />
National Centre for Social Research<br />
255<br />
TEXT SHOULD BE NO MORE THAN<br />
60 CHARACTERS"<br />
IF respondent has full driving licence<br />
for car, or both car and motorcycle or<br />
car with special adaptations (DLTyp95<br />
= Car OR Auto OR CarMot OR<br />
CarRes] AND (DMCARVAN = 1))<br />
THEN<br />
CarWN<br />
"^LDMIntName<br />
(Does/Do any of) your household's<br />
car/van(s) usually stay at home,<br />
unused, while you are at work?<br />
IF UNUSED, PROBE: Are you insured<br />
to drive it?"<br />
1. "No, (all) car(s) usually in use by<br />
others"<br />
2. "Car(s) unused, but respondent not<br />
insured to drive it"<br />
3. "Car unused and respondent is<br />
insured to drive it"<br />
CarWN (QUESTION DELETED <strong>2004</strong><br />
ONWARDS)<br />
IF car is unused and respondent is<br />
insured to drive it (CarWN = Unused)<br />
THEN<br />
CarWNY<br />
"^LDMIntName<br />
What are the reasons you don't use<br />
the car to get to or from work?<br />
CODE ALL THAT APPLY"<br />
1. "Quicker by ^TrMode"<br />
2. "Cheaper by ^TrMode"<br />
3. "Enjoys using ^TrMode"<br />
4. "Healthier to use ^TrMode"<br />
5. "Can work/rest/read on train/bus<br />
etc. "<br />
6. "Too far/long journey "<br />
7. "Don't have current driving<br />
licence/can't drive"<br />
8. "Don't like driving"<br />
9. "Cost of petrol"<br />
10. "Lack of parking facilities"<br />
11. "Cost of parking"<br />
12. "Personal disability"<br />
13. "Concerns over personal safety"<br />
14. "Traffic congestion/roadworks"
15. "Environmental concerns"<br />
97. "Other (specify)"<br />
CarWNY(QUESTION DELETED <strong>2004</strong><br />
ONWARDS)<br />
IF other reason why car is unused<br />
(CarWNY = other) THEN<br />
XCarWNY<br />
"^LDMIntName<br />
Please specify other answer.<br />
TEXT SHOULD BE NO MORE THAN<br />
60 CHARACTERS"<br />
XCarWNY (QUESTION DELETED<br />
<strong>2004</strong> ONWARDS)<br />
IF more than one reason why car<br />
remains unused during work<br />
(CarWNY) > 1) THEN<br />
CarWNYM<br />
"^LDMIntName<br />
And what is the main reason?<br />
CODE ONE ONLY"<br />
1. "Quicker by ^TrMode"<br />
2. "Cheaper by ^TrMode"<br />
3. "Enjoys using ^TrMode"<br />
4. "Healthier to use ^TrMode"<br />
5. "Can work/rest/read on train/bus<br />
etc. "<br />
6. "Too far/long journey "<br />
7. "Don't have current driving<br />
licence/can't drive"<br />
8. "Don't like driving"<br />
9. "Cost of petrol"<br />
10. "Lack of parking facilities"<br />
11. "Cost of parking"<br />
12. "Personal disability"<br />
13. "Concerns over personal safety"<br />
14. "Traffic congestion/roadworks"<br />
15. "Environmental concerns"<br />
97. "Other (specify)"<br />
CarWNYM (QUESTION DELETED<br />
<strong>2004</strong> ONWARDS)<br />
IF other reason why car remains<br />
unused (CarWYNM = other) THEN<br />
National Centre for Social Research<br />
256<br />
XCarWNYM<br />
"^LDMIntName<br />
Please specify other answer.<br />
TEXT SHOULD BE NO MORE THAN<br />
60 CHARACTERS"<br />
XCarWNYM(QUESTION DELETED<br />
<strong>2004</strong> ONWARDS)<br />
TShDiff / QTShDiff.NTS<br />
BShDiff<br />
Questions asked of:<br />
The household member who is the<br />
main food shopper in the household<br />
(DVShop)<br />
IF respondent does the main food<br />
shopping (WhoInt =<br />
Qamenity.DVShop) THEN<br />
TravSh<br />
"^LDMIntName<br />
Now some questions about shopping.<br />
How do you usually travel when you<br />
do your main food shopping?<br />
CODE ONE ONLY, FOR THE<br />
LONGEST PART, BY DISTANCE, OF<br />
THE RESPONDENT'S USUAL<br />
JOURNEY TO THE SHOPS.<br />
IF DIFFERENT METHOD TO GET TO<br />
SHOPS AND RETURN HOME, CODE<br />
METHOD TO GET HOME<br />
IF NO USUAL METHOD, ASK ABOUT<br />
THE LAST TIME"<br />
1. "Underground, metro, light rail,<br />
tram"<br />
2. "Train"<br />
3. "Bus, minibus or coach"<br />
4. "Motorcycle, scooter or moped"<br />
5. "Car or van"<br />
6. "Taxi/minicab"<br />
7. "Bicycle"<br />
8. "On foot"<br />
97. "Other (specify)"
IF respondent uses other method of<br />
travel for food shopping (TravSh =<br />
Other) THEN<br />
XTravSh<br />
"^LDMIntName<br />
Please specify other answer.<br />
TEXT SHOULD BE NO MORE THAN<br />
60 CHARACTERS"<br />
IF respondent does the main food<br />
shopping (WhoInt =<br />
Qamenity.DVShop) AND respondent<br />
usually does the food shopping in a<br />
car or motorbike (TravSh IN<br />
[Car,MBike]) THEN<br />
CarS<br />
"^LDMIntName<br />
Do you usually experience any<br />
difficulties with travelling by ^carbike<br />
when you do your main food<br />
shopping?<br />
IF Yes, PROBE: What difficulties?<br />
CODE ALL THAT APPLY"<br />
1. "No, no difficulties"<br />
2. "Too far/ long journey"<br />
3. "Cost of petrol"<br />
4. "Lack of parking facilities"<br />
5. "Cost of parking"<br />
6. "Personal disability"<br />
7. "Concerns over personal safety"<br />
8. "Traffic congestion/roadworks"<br />
9. "The weather"<br />
97. "Other (specify)"<br />
(PRECODES CHANGED <strong>2003</strong><br />
ONWARDS TO:)<br />
"No, no difficulties"<br />
"Too far/ long journey"<br />
"Cost of petrol"<br />
"Lack of parking facilities"<br />
"Cost of parking"<br />
"Personal disability"<br />
"Difficulty carrying shopping to car"<br />
"Concerns over personal safety"<br />
"Traffic congestion/roadworks"<br />
"Rely on non-household member<br />
taking them shopping"<br />
"The weather"<br />
"Other (specify)"<br />
National Centre for Social Research<br />
257<br />
IF respondent experiences other<br />
difficulty with travelling to or from food<br />
shopping (CarS = other) THEN<br />
XCarS<br />
"^LDMIntName<br />
Please specify other answer.<br />
TEXT SHOULD BE NO MORE THAN<br />
60 CHARACTERS"<br />
IF respondent experiences more than<br />
one difficutly (CarS > 1) THEN<br />
CarSM<br />
"^LDMIntName<br />
And which @Ione@I of these things<br />
creates most difficulty?<br />
CODE ONE ONLY"<br />
1. "No, no difficulties"<br />
2. "Too far/ long journey"<br />
3. "Cost of petrol"<br />
4. "Lack of parking facilities"<br />
5. "Cost of parking"<br />
6. "Personal disability"<br />
7. "Concerns over personal safety"<br />
8. "Traffic congestion/roadworks"<br />
9. "The weather"<br />
97. "Other (specify)"<br />
(PRECODES CHANGED <strong>2003</strong><br />
ONWARDS TO:)<br />
"No, no difficulties"<br />
"Too far/ long journey"<br />
"Cost of petrol"<br />
"Lack of parking facilities"<br />
"Cost of parking"<br />
"Personal disability"<br />
"Difficulty carrying shopping to car"<br />
"Concerns over personal safety"<br />
"Traffic congestion/roadworks"<br />
"Rely on non-household member<br />
taking them shopping"<br />
"The weather"<br />
"Other (specify)"
IF respondent experiences some other<br />
difficulty (CarSM = other) THEN<br />
XCarSM<br />
"^LDMIntName<br />
Please specify other answer.<br />
TEXT SHOULD BE NO MORE THAN<br />
60 CHARACTERS"<br />
IF respondent does the main food<br />
shopping (WhoInt =<br />
Qamenity.DVShop) AND respondent<br />
usually does the food shopping in a<br />
car or motorbike (TravSh IN<br />
[Car,MBike]) THEN<br />
CarSEas<br />
"^LDMIntName<br />
SHOW CARD P.<br />
Suppose for some reason you could<br />
@Inot@I use a ^carbike for your main<br />
food shopping, how easy or difficult do<br />
you think it would be to make this<br />
journey some other way? Please take<br />
your answer from this card. (HELP<br />
)<br />
THIS QUESTION REFERS TO EASE<br />
OF TRAVEL TO USUAL SHOPS FOR<br />
MAIN FOOD SHOPPING, EVEN IF<br />
THEY WOULD NOT BE VISITED IF<br />
THE CAR COULD NOT BE USED.<br />
(EXTRA INT. INSTRUCTION ADDED<br />
<strong>2003</strong> ONLY)"<br />
1. "Very easy"<br />
2. "Quite easy"<br />
3. " Neither easy nor difficult"<br />
4. "Quite difficult"<br />
5. "Very difficult"<br />
CarSEas(QUESTION DELETED <strong>2004</strong><br />
ONWARDS)<br />
IF respondent would find it quite<br />
difficult or very difficult to make the<br />
journey some other way (CarWEas =<br />
Qdiff OR Vdiff) THEN<br />
CarSY<br />
"^LDMIntName<br />
Why would this be difficult?<br />
CODE ALL THAT APPLY"<br />
1. "Too far/long journey"<br />
National Centre for Social Research<br />
258<br />
2. "Journey not possible by public<br />
transport"<br />
3. "Unreliable public transport"<br />
4. "Cost of using public<br />
transport/taxis"<br />
5. "Poor information about public<br />
transport services"<br />
6. "Poor connections"<br />
7. "Finds public transport unpleasant"<br />
8. "Personal disability"<br />
9. "Concerns over personal safety"<br />
10. "Traffic congestion/roadworks"<br />
11. "Difficulties carrying the shopping"<br />
12. "Difficulties managing with<br />
children"<br />
13. "The weather"<br />
97. "Other (specify)"<br />
(PRECODES CHANGED <strong>2003</strong> ONLY<br />
TO:)<br />
"Too far/long journey"<br />
"Journey not possible by public<br />
transport"<br />
"Distance to public transport"<br />
"Unreliable public transport"<br />
"Cost of using public transport/taxis"<br />
"Poor information about public<br />
transport services"<br />
"Poor connections"<br />
"Finds public transport unpleasant"<br />
"Personal disability"<br />
"Concerns over personal safety"<br />
"Traffic congestion/roadworks"<br />
"Difficulties carrying the shopping"<br />
"Difficulties managing with children"<br />
"The weather"<br />
97 "Other (specify)"<br />
CarSY(QUESTION DELETED <strong>2004</strong><br />
ONWARDS)<br />
IF there was another reason why<br />
respondent would find it difficult<br />
(CarSY = other) THEN<br />
XCarSY<br />
"^LDMIntName<br />
Please specify other answer.<br />
TEXT SHOULD BE NO MORE THAN<br />
60 CHARACTERS"
XCarSY (QUESTION DELETED <strong>2004</strong><br />
ONWARDS)<br />
IF more than one reason why this<br />
would create difficulty (CarSY > 1)<br />
THEN<br />
CarSYM<br />
"^LDMIntName<br />
And which @Ione@I of these things<br />
would create most difficulty for you?<br />
CODE ONE ONLY"<br />
1. "Too far/long journey"<br />
2. "Journey not possible by public<br />
transport"<br />
3. "Unreliable public transport"<br />
4. "Cost of using public<br />
transport/taxis"<br />
5. "Poor information about public<br />
transport services"<br />
6. "Poor connections"<br />
7. "Finds public transport unpleasant"<br />
8. "Personal disability"<br />
9. "Concerns over personal safety"<br />
10. "Traffic congestion/roadworks"<br />
11. "Difficulties carrying the shopping"<br />
12. "Difficulties managing with<br />
children"<br />
13. "The weather"<br />
97. "Other (specify)"<br />
(PRECODES CHANGED <strong>2003</strong> ONLY<br />
TO:)<br />
"Too far/long journey"<br />
"Journey not possible by public<br />
transport"<br />
"Distance to public transport"<br />
"Unreliable public transport"<br />
"Cost of using public transport/taxis"<br />
"Poor information about public<br />
transport services"<br />
"Poor connections"<br />
"Finds public transport unpleasant"<br />
"Personal disability"<br />
"Concerns over personal safety"<br />
"Traffic congestion/roadworks"<br />
"Difficulties carrying the shopping"<br />
"Difficulties managing with children"<br />
"The weather"<br />
97 "Other (specify)"<br />
National Centre for Social Research<br />
259<br />
CarSYM (QUESTION DELETED <strong>2004</strong><br />
ONWARDS)<br />
IF some other reason would create<br />
difficulty (CarSYM = other) THEN<br />
XCarSYM<br />
"^LDMIntName<br />
Please specify other answer.<br />
TEXT SHOULD BE NO MORE THAN<br />
60 CHARACTERS"<br />
XCarSYM(QUESTION DELETED<br />
<strong>2004</strong> ONWARDS)<br />
IF respondent does the main food<br />
shopping (WhoInt =<br />
Qamenity.DVShop) AND respondent<br />
does not usually do the food shopping<br />
in a private vehicle (TravSh IN [Tube,<br />
Train, Bus, Taxi .. Other]) THEN<br />
OthS<br />
"^LDMIntName<br />
Do you usually experience any<br />
difficulties with travelling by ^TrMode<br />
when you do your main food<br />
shopping?<br />
IF Yes, PROBE: What difficulties?<br />
CODE ALL THAT APPLY "<br />
1. "No, no difficulties"<br />
2. "Too far/long journey"<br />
3. "Journey not possible by public<br />
transport"<br />
4. "Unreliable public transport"<br />
5. "Cost of using public<br />
transport/taxis"<br />
6. "Poor information about public<br />
transport services"<br />
7. "Poor connections"<br />
8. "Finds public transport unpleasant"<br />
9. "Personal disability"<br />
10. "Concerns over personal safety"<br />
11. "Traffic congestion/roadworks"<br />
12. "Difficulties carrying the shopping"<br />
13. "Difficulties managing with<br />
children"<br />
14. "The weather"<br />
97. "Other (specify)"
IF respondent experiences some other<br />
difficulties when travelling for main<br />
food shopping (OthS = other) THEN<br />
XOthS<br />
"^LDMIntName<br />
Please specify other answer.<br />
TEXT SHOULD BE NO MORE THAN<br />
60 CHARACTERS"<br />
IF there is more than one reason<br />
which creates difficulty when travelling<br />
for the main food shopping (OthS > 1)<br />
THEN<br />
OthSM<br />
"^LDMIntName<br />
And which @Ione@I of these things<br />
creates most difficulty?<br />
CODE ONE ONLY"<br />
1. "No, no difficulties"<br />
2. "Too far/long journey"<br />
3. "Journey not possible by public<br />
transport"<br />
4. "Unreliable public transport"<br />
5. "Cost of using public<br />
transport/taxis"<br />
6. "Poor information about public<br />
transport services"<br />
7. "Poor connections"<br />
8. "Finds public transport unpleasant"<br />
9. "Personal disability"<br />
10. "Concerns over personal safety"<br />
11. "Traffic congestion/roadworks"<br />
12. "Difficulties carrying the shopping"<br />
13. "Difficulties managing with<br />
children"<br />
14. "The weather"<br />
97. "Other (specify)"<br />
IF there is some other reason which<br />
creates difficulty (OthSM = other)<br />
THEN<br />
XothSM<br />
"^LDMIntName<br />
Please specify other answer.<br />
TEXT SHOULD BE NO MORE THAN<br />
60 CHARACTERS"<br />
National Centre for Social Research<br />
260<br />
IF respondent has full driving licence<br />
for car, or both car and motorcycle or<br />
car with special adaptations (DLTyp95<br />
= Car OR Auto OR CarMot OR<br />
CarRes] AND (DMCARVAN = 1)) AND<br />
respondent does not usually do the<br />
food shopping in a private vehicle<br />
(TravSh IN [Tube, Train, Bus, Taxi ..<br />
Other]) THEN<br />
CarSN<br />
"^LDMIntName<br />
(Does/Do any of) your car/van(s)<br />
usually stay at home, unused, while<br />
you do the main food shopping?<br />
IF UNUSED, PROBE: Are you insured<br />
to drive it?"<br />
1. "No, (all) car(s) usually in use by<br />
others"<br />
2. "Car(s) unused, but respondent not<br />
insured to drive it"<br />
3. "Car unused and respondent is<br />
insured to drive it"<br />
CarSN(QUESTION DELETED <strong>2004</strong><br />
ONWARDS)<br />
IF car is unused and respondent is<br />
insured to drive it (CarWN = Unused)<br />
THEN<br />
CarSNY<br />
"^LDMIntName<br />
What are the reasons you don't use<br />
the car for your main food shopping?<br />
CODE ALL THAT APPLY "<br />
1. "Quicker by ^TrMode"<br />
2. "Cheaper by ^TrMode"<br />
3. "Enjoys using ^TrMode"<br />
4. "Healthier to use ^TrMode"<br />
5. "Can work/rest/read on train/bus<br />
etc. "<br />
6. "Too far/long journey "<br />
7. "Don't have current driving<br />
licence/can't drive "<br />
8. "Don't like driving"<br />
9. "Cost of petrol"<br />
10. "Lack of parking facilities"<br />
11. "Cost of parking"<br />
12. "Personal disability"<br />
13. "Concerns over personal safety"<br />
14. "Traffic congestion/roadworks"<br />
15. "Environmental concerns"
97. "Other (specify)"<br />
(PRECODES CHANGED <strong>2003</strong> ONLY<br />
TO:)<br />
"Quicker by ^TrMode"<br />
"Cheaper by ^TrMode"<br />
"Enjoys using ^TrMode"<br />
"Healthier to use ^TrMode"<br />
"Can work/rest/read on train/bus etc. "<br />
"Combines with another journey (e.g.<br />
returning from work)"<br />
"Too far/long journey "<br />
"Don't have current driving<br />
licence/can't drive "<br />
"Don't like driving"<br />
"Cost of petrol"<br />
"Lack of parking facilities"<br />
"Cost of parking"<br />
"Personal disability"<br />
"Concerns over personal safety"<br />
"Traffic congestion/roadworks"<br />
"Environmental concerns"<br />
97. "Other (specify)"<br />
CarSNY (QUESTION DELETED <strong>2004</strong><br />
ONWARDS)<br />
IF some other reason why car remains<br />
unused (CarSNY = other) THEN<br />
XCarSNY<br />
"^LDMIntName<br />
Please specify other answer.<br />
TEXT SHOULD BE NO MORE THAN<br />
60 CHARACTERS"<br />
XCarSNY(QUESTION DELETED<br />
<strong>2004</strong> ONWARDS)<br />
IF more than one reason why car<br />
remains unused (CarSNY >1) THEN<br />
CarSNYM<br />
"^LDMIntName<br />
And what is the @Imain@I reason?<br />
CODE ONE ONLY "<br />
1. "Quicker by ^TrMode"<br />
2. "Cheaper by ^TrMode"<br />
3. "Enjoys using ^TrMode"<br />
4. "Healthier to use ^TrMode"<br />
National Centre for Social Research<br />
261<br />
5. "Can work/rest/read on train/bus<br />
etc."<br />
6. "Too far/long journey "<br />
7. "Don't have current driving<br />
licence/can't drive "<br />
8. "Don't like driving"<br />
9. "Cost of petrol"<br />
10. "Lack of parking facilities"<br />
11. "Cost of parking"<br />
12. "Personal disability"<br />
13. "Concerns over personal safety"<br />
14. "Traffic congestion/roadworks"<br />
15. "Environmental concerns"<br />
"Other (specify)"<br />
(PRECODES CHANGED <strong>2003</strong> ONLY<br />
TO:)<br />
"Quicker by ^TrMode"<br />
"Cheaper by ^TrMode"<br />
"Enjoys using ^TrMode"<br />
"Healthier to use ^TrMode"<br />
"Can work/rest/read on train/bus etc. "<br />
"Combines with another journey (e.g.<br />
returning from work)"<br />
"Too far/long journey "<br />
"Don't have current driving<br />
licence/can't drive "<br />
"Don't like driving"<br />
"Cost of petrol"<br />
"Lack of parking facilities"<br />
"Cost of parking"<br />
"Personal disability"<br />
"Concerns over personal safety"<br />
"Traffic congestion/roadworks"<br />
"Environmental concerns"<br />
97. "Other (specify)"<br />
CarSNYM(QUESTION DELETED<br />
<strong>2004</strong> ONWARDS)<br />
IF some other reason why car remains<br />
unused (CarSNYM = other) THEN<br />
XCarSNYM<br />
"^LDMIntName<br />
Please specify other answer.<br />
TEXT SHOULD BE NO MORE THAN<br />
60 CHARACTERS"
XCarSNYM(QUESTION DELETED<br />
<strong>2004</strong> ONWARDS)<br />
TDemTr / QTDemTr.NTS<br />
BDemTr<br />
Questions asked of:<br />
Each individual household member<br />
aged 16 and over in turn<br />
IF aged 16 or over (DvAGE >= 16)<br />
THEN<br />
OthDif<br />
"^LDMIntName<br />
SHOW CARD Q<br />
(Apart from anything you have already<br />
mentioned) Do you have any transport<br />
difficulties for any of these types of<br />
journey?<br />
CODE ALL THAT APPLY"<br />
1. "Travelling to the doctors/hospital"<br />
2. "Visiting friends/relatives at their<br />
home"<br />
3. "Travelling to other social<br />
activities"<br />
4. "Taking the children to<br />
school/social activities etc."<br />
5. "Travelling to<br />
school/college/university"<br />
6. "Travelling for any other reason<br />
(specify)"<br />
7. "No difficulties with any of these"<br />
IF respondent has transport difficulties<br />
for some other journey purpose<br />
(OthDif = Other) THEN<br />
XOthDif<br />
"^LDMIntName<br />
PLEASE SPECIFY OTHER REASON<br />
FOR TRAVELLING.<br />
TEXT SHOULD BE NO MORE THAN<br />
60 CHARACTERS"<br />
IF respondent has transport difficulties<br />
travelling to the doctors (OthDif = Med)<br />
THEN<br />
YDiff1<br />
National Centre for Social Research<br />
262<br />
"^LDMIntName<br />
What difficulties do you experience<br />
when travelling to the<br />
doctors/hospital?<br />
CODE ALL THAT APPLY"<br />
1. "Too far/long journey"<br />
2. "Journey not possible by public<br />
transport"<br />
3. "Unreliable public transport"<br />
4. "Cost of using public<br />
transport/taxis"<br />
5. "Poor information about public<br />
transport services"<br />
6. "Poor connections"<br />
7. "Finds public transport unpleasant"<br />
8. "Don't have current driving<br />
licence/can't drive "<br />
9. "Cost of petrol"<br />
10. "Lack of parking facilities"<br />
11. "Cost of parking"<br />
12. "Personal disability"<br />
13. "Concerns over personal safety"<br />
14. "Traffic congestion/roadworks"<br />
97. "Other (SPECIFY)"<br />
IF respondent has other transport<br />
difficulties with travelling to the<br />
doctors/hospital (YDiff1 = other) THEN<br />
XYDiff1<br />
"^LDMIntName<br />
PLEASE SPECIFY OTHER ANSWER.<br />
TEXT SHOULD BE NO MORE THAN<br />
60 CHARACTERS"
IF respondent has transport difficulties<br />
when visiting friends/relatives at their<br />
home (OthDif =Visit) THEN<br />
YDiff2<br />
"^LDMIntName<br />
What difficulties do you experience<br />
when visiting friends/relatives at their<br />
home?<br />
CODE ALL THAT APPLY"<br />
1. "Too far/long journey"<br />
2. "Journey not possible by public<br />
transport"<br />
3. "Unreliable public transport"<br />
4. "Cost of using public<br />
transport/taxis"<br />
5. "Poor information about public<br />
transport services"<br />
6. "Poor connections"<br />
7. "Finds public transport unpleasant"<br />
8. "Don't have current driving<br />
licence/can't drive "<br />
9. "Cost of petrol"<br />
10. "Lack of parking facilities"<br />
11. "Cost of parking"<br />
12. "Personal disability"<br />
13. "Concerns over personal safety"<br />
14. "Traffic congestion/roadworks"<br />
97. "Other (SPECIFY)"<br />
IF respondent has other transport<br />
difficulties when visiting<br />
friends/relatives at their home (YDiff2<br />
= other) THEN<br />
XYDiff2<br />
"^LDMIntName<br />
PLEASE SPECIFY OTHER ANSWER.<br />
TEXT SHOULD BE NO MORE THAN<br />
60 CHARACTERS"<br />
IF respondent has transport difficulties<br />
when travelling to other social<br />
activities (OthDif = Social) THEN<br />
YDiff3<br />
"^LDMIntName<br />
What difficulties do you experience<br />
when travelling to other social<br />
activities?<br />
CODE ALL THAT APPLY"<br />
1. "Too far/long journey"<br />
National Centre for Social Research<br />
263<br />
2. "Journey not possible by public<br />
transport"<br />
3. "Unreliable public transport"<br />
4. "Cost of using public<br />
transport/taxis"<br />
5. "Poor information about public<br />
transport services"<br />
6. "Poor connections"<br />
7. "Finds public transport unpleasant"<br />
8. "Don't have current driving<br />
licence/can't drive "<br />
9. "Cost of petrol"<br />
10. "Lack of parking facilities"<br />
11. "Cost of parking"<br />
12. "Personal disability"<br />
13. "Concerns over personal safety"<br />
14. "Traffic congestion/roadworks"<br />
97. "Other (SPECIFY)"<br />
IF respondent has other transport<br />
difficulties when travelling to other<br />
social activities (YDiff3 = other) THEN<br />
XYDiff3<br />
"^LDMIntName<br />
PLEASE SPECIFY OTHER ANSWER.<br />
TEXT SHOULD BE NO MORE THAN<br />
60 CHARACTERS"<br />
IF respondent has transport difficulties<br />
when when taking the children to<br />
school/social activities etc (OthDif =<br />
Escort) THEN<br />
YDiff4<br />
"^LDMIntName<br />
What difficulties do you experience<br />
when taking the children to<br />
school/social activities etc?<br />
CODE ALL THAT APPLY"<br />
1. "Too far/long journey"<br />
2. "Journey not possible by public<br />
transport"<br />
3. "Unreliable public transport"<br />
4. "Cost of using public<br />
transport/taxis"<br />
5. "Poor information about public<br />
transport services"<br />
6. "Poor connections"<br />
7. "Finds public transport unpleasant"<br />
8. "Don't have current driving<br />
licence/can't drive "
9. "Cost of petrol"<br />
10. "Lack of parking facilities"<br />
11. "Cost of parking"<br />
12. "Personal disability"<br />
13. "Concerns over personal safety"<br />
14. "Traffic congestion/roadworks"<br />
97. "Other (SPECIFY)"<br />
IF respondent has other transport<br />
difficulties when taking the children to<br />
school/social activities etc (YDiff4 =<br />
other) THEN<br />
XYDiff4<br />
"^LDMIntName<br />
PLEASE SPECIFY OTHER ANSWER.<br />
TEXT SHOULD BE NO MORE THAN<br />
60 CHARACTERS"<br />
IF respondent has transport difficulties<br />
when travelling to<br />
school/college/university (OthDif =<br />
Educ) THEN<br />
YDiff5<br />
"^LDMIntName<br />
What difficulties do you experience<br />
when travelling to<br />
school/college/university?<br />
CODE ALL THAT APPLY"<br />
1. "Too far/long journey"<br />
2. "Journey not possible by public<br />
transport"<br />
3. "Unreliable public transport"<br />
4. "Cost of using public<br />
transport/taxis"<br />
5. "Poor information about public<br />
transport services"<br />
6. "Poor connections"<br />
7. "Finds public transport unpleasant"<br />
8. "Don't have current driving<br />
licence/can't drive "<br />
9. "Cost of petrol"<br />
10. "Lack of parking facilities"<br />
11. "Cost of parking"<br />
12. "Personal disability"<br />
13. "Concerns over personal safety"<br />
14. "Traffic congestion/roadworks"<br />
97. "Other (SPECIFY)"<br />
National Centre for Social Research<br />
264<br />
IF respondent has other transport<br />
difficulties when travelling to<br />
school/college/university (YDiff5 =<br />
other) THEN<br />
XYDiff5<br />
"^LDMIntName<br />
PLEASE SPECIFY OTHER ANSWER.<br />
TEXT SHOULD BE NO MORE THAN<br />
60 CHARACTERS"<br />
IF respondent has transport difficulties<br />
when travelling for some other journey<br />
purpose (OthDif = Other) THEN<br />
YDiff6<br />
"^LDMIntName<br />
What difficulties do you experience<br />
when travelling: ^XOthDif ?<br />
CODE ALL THAT APPLY"<br />
1. "Too far/long journey"<br />
2. "Journey not possible by public<br />
transport"<br />
3. "Unreliable public transport"<br />
4. "Cost of using public<br />
transport/taxis"<br />
5. "Poor information about public<br />
transport services"<br />
6. "Poor connections"<br />
7. "Finds public transport unpleasant"<br />
8. "Don't have current driving<br />
licence/can't drive "<br />
9. "Cost of petrol"<br />
10. "Lack of parking facilities"<br />
11. "Cost of parking"<br />
12. "Personal disability"<br />
13. "Concerns over personal safety"<br />
14. "Traffic congestion/roadworks"<br />
97. "Other (SPECIFY)"<br />
IF respondent has other transport<br />
difficulties when travelling for some<br />
other journey purpose (YDiff6 = other)<br />
THEN<br />
XYDiff6<br />
"^LDMIntName<br />
PLEASE SPECIFY OTHER ANSWER.<br />
TEXT SHOULD BE NO MORE THAN<br />
60 CHARACTERS"
BNoTick / QNOTICK.NTS<br />
IF age is greater than 4 (DVAge > 4)<br />
THEN<br />
StckT<br />
"^LDMIntName<br />
SHOW CARD R<br />
Do you have any of these special<br />
tickets or passes, valid for a week or<br />
longer?<br />
INTERVIEWER: EXCLUDE ONE DAY<br />
TRAVELCARDS AND CARNETS.<br />
BLUE/ORANGE DISBALED BADGES<br />
ARE NOT INCLUDED.<br />
ASK TO SEE TICKET/PASS. (EXTRA<br />
INT. INSTRUCTION ADDED <strong>2003</strong><br />
ONWARDS)"<br />
1. "Yes"<br />
2. "No"<br />
IF respondent does have special ticket<br />
(StckT = Yes) THEN<br />
SeeTick<br />
"^LDMIntName<br />
INTERVIEWER: Ask Respondent to<br />
get ticket/pass if possible."<br />
1. "Ticket/Pass seen"<br />
2. "Ticket/Pass NOT seen"<br />
IF respondent does have special ticket<br />
(StckT = Yes) THEN<br />
NoTckt<br />
"^LDMIntName<br />
How many of these do you have?"<br />
TTicket / QTICKET.NTS<br />
BTicket<br />
Questions asked of:<br />
Each individual household member<br />
aged 5 and over, in turn<br />
National Centre for Social Research<br />
265<br />
IF respondent does have special ticket<br />
(StckT = Yes) THEN<br />
TckT<br />
"^LDMIntName<br />
TO RECORD DETAILS OF<br />
^LTTicket3 TICKET<br />
PRESS AND CONTINUE"<br />
IF respondent does have special ticket<br />
(StckT = Yes) THEN<br />
SpecTk<br />
"^LDMIntName<br />
TICKET NUMBER: ^LTTicket1<br />
TYPE OF SPECIAL TICKET\PASS<br />
(HELP )<br />
INTERVIEWER: CODE TYPE OF<br />
TICKET"<br />
1. "NON-CONCESSIONARY Season<br />
ticket"<br />
2. "NON-CONCESSIONARY Area<br />
travel card"<br />
3. "NON-CONCESSIONARY<br />
Combined season/area travel card"<br />
4. "NON-CONCESSIONARY<br />
Railcard"<br />
5. "NON-CONCESSIONARY<br />
Employee's special pass"<br />
6. "Other NON-CONCESSIONARY<br />
ticket (SPECIFY)"<br />
7. "CONCESSIONARY OAP Pass"<br />
8. "CONCESSIONARY Scholar's<br />
pass"<br />
9. "CONCESSIONARY Disabled<br />
person's pass"<br />
10. "CONCESSIONARY Subsidised<br />
travel tokens"<br />
11. "Other CONCESSIONARY ticket<br />
(SPECIFY)"<br />
If respondent has some other<br />
concessionary ticket (SpecTk = other)<br />
THEN<br />
XSpecTk<br />
"^LDMIntName<br />
INTERVIEWER: Please describe what<br />
kind of other concessionary or nonconcessionary<br />
ticket the informant<br />
has."
IF respondent does have special ticket<br />
(StckT = Yes) THEN<br />
TkMode<br />
"^LDMIntName<br />
TICKET NUMBER: ^LTTicket1<br />
What forms of transport does the ticket<br />
cover?"<br />
1. "Train"<br />
2. "LT underground/Tyne and Wear<br />
Metro/ Glasgow underground"<br />
3. "Light Rail/Tram"<br />
4. "Bus"<br />
5. "Other single method"<br />
6. "Combined (ex-BR) train &<br />
underground"<br />
7. "Combined (ex-BR) train & bus<br />
(NOT IN LONDON)"<br />
8. "Combined underground/bus"<br />
9. "Combined (ex-BR) train &<br />
underground & bus"<br />
10. "Combined (ex-BR) train &<br />
underground & bus & light rail/tram"<br />
11. "Other combination of methods"<br />
IF ticket covers combined methods of<br />
transport (Tkmode = ComBRug –<br />
OthComb) THEN<br />
MoMls<br />
"^LDMIntName<br />
TICKET NUMBER: ^LTTicket1<br />
When you use your combined ticket,<br />
on which method of transport do you<br />
travel furthest?"<br />
1. "Train"<br />
2. "Underground"<br />
3. "Light Rail/Tram"<br />
4. "Bus"<br />
5. "DK/Other"<br />
(CHANGED <strong>2003</strong> ONWARDS TO:)<br />
When you use your combined ticket,<br />
on which method of transport do you<br />
travel the most mileage?"<br />
1. "Train"<br />
2. "Underground"<br />
3. "Light Rail/Tram"<br />
4. "Bus"<br />
5. "DK/Other"<br />
National Centre for Social Research<br />
266<br />
IF ticket type is anything other than a<br />
subsidised ticket (SpecTk Subsidy)<br />
THEN<br />
TkTime<br />
"^LDMIntName<br />
TICKET NUMBER: ^LTTicket1<br />
How long does the ticket\pass last<br />
for?"<br />
1. "1 week"<br />
2. "1 month"<br />
3. "3 months/school term"<br />
4. "6 months"<br />
5. "1 Year"<br />
6. "more than 1 year"<br />
7. "unlimited"<br />
97. "Other (SPECIFY)"<br />
IF ticket lasts for a different time period<br />
(TkTime = Other)THEN<br />
XTkTime<br />
"^LDMIntName<br />
INTERVIEWER: Please record the<br />
length of time the ticket covers.<br />
Remember to recode wherever<br />
possible."<br />
IF ticket type is anything other than a<br />
subsidised ticket (SpecTk Subsidy)<br />
THEN<br />
TkCst<br />
"^LDMIntName<br />
TICKET NUMBER: ^LTTicket1<br />
What was the actual (net) cost to you<br />
of the ticket?<br />
ENTER COST TO THE HOUSEHOLD<br />
IN POUNDS & PENCE. EXAMPLES<br />
10 pounds and 6p. Enter 10.06<br />
7 pounds and 63p. Enter 7.63<br />
IF NIL ENTER 0"<br />
IF ticket type is anything other than a<br />
subsidised ticket (SpecTk Subsidy)<br />
THEN<br />
NumJrn<br />
"^LDMIntName<br />
TICKET NUMBER: ^LTTicket1<br />
How many ^MMethtxt journeys per<br />
week would you expect to use the
ticket\pass for. Please count each<br />
single trip as one journey and return<br />
trips as two?<br />
INTERVIEWER: IF AVERAGE IS<br />
LESS THAN ONCE A WEEK ENTER<br />
0"<br />
IF ticket type is anything other than a<br />
subsidised ticket (SpecTk Subsidy)<br />
AND IF the respondent makes on<br />
average less than one journey a week<br />
(NumJrn = 0) THEN<br />
YrNum<br />
"^LDMIntName<br />
SHOW CARD S<br />
TICKET NUMBER: ^LTTicket1<br />
Could you look at this card and tell me<br />
on about how many (main method)<br />
journeys you use the ticket\pass?<br />
PLEASE COUNT THE NUMBER OF<br />
SINGLE JOURNEYS"<br />
1. "More than 12 times per year/once<br />
a month"<br />
2. "Up to 12 times per year/once a<br />
month"<br />
3. "Three or four times a year"<br />
4. "Once or twice a year"<br />
5. "Less than once a year or never"<br />
IF ticket type is anything other than a<br />
subsidised ticket (SpecTk Subsidy)<br />
THEN<br />
TkTPay<br />
"^LDMIntName<br />
TICKET NUMBER: ^LTTicket1<br />
When you use the ticket\pass do you<br />
usually have to pay anything at the<br />
time of travel, or do you travel free?"<br />
1. "Pay something"<br />
2. "Travel free"<br />
TWhoLDJ / QTWhoLDJ.NTS<br />
BWhoLDJ<br />
ASK ALWAYS<br />
AnyLDJ1<br />
"^LDMIntName<br />
National Centre for Social Research<br />
267<br />
Now I'd like to ask you about any long<br />
distance journeys you have made.<br />
I mean journeys within Great Britain of<br />
50 miles or more in one direction, say<br />
from here to [NAMES OF 2 OR 3<br />
PLACES 45 MILES AWAY].<br />
Have you made any long distance<br />
journeys within Great Britain of 50<br />
miles or more ^LWhoLDJ2<br />
^QSignin.RecDay, ^QSignin.RecTxt<br />
^LWhoLDJ3 ?<br />
INTERVIEWER - please refer to<br />
calendar."<br />
1. "Yes"<br />
2. "No"<br />
IF Respondent did not make any long<br />
distance journeys (AnyLDJ1 = No)<br />
THEN<br />
Longest<br />
"^LDMIntName<br />
How far was the longest journey you<br />
made since ^QSignin.RecDay,<br />
^QSignin.RecTxt?<br />
INTERVIEWER: ENTER THE<br />
LENGTH OF THE JOURNEY IN<br />
MILES. IF THE JOURNEY WAS 50<br />
MILES OR MORE, ENTER '0' THEN<br />
GO BACK TO CHANGE ANYLDJ1 TO<br />
'YES'."<br />
ASK ALWAYS AT PICK-UP<br />
AnyLDJ2<br />
"^LDMIntName<br />
LONG DISTANCE JOURNEYS<br />
RECORDED AT PICKUP<br />
INTERVIEWER: PRESS AND<br />
IF THERE ARE LONG<br />
DISTANCE JOURNEYS FOR<br />
^LDMInTName AT PICK UP.<br />
@RREMEMBER TO PRESS THE<br />
KEY AT THE NEXT<br />
QUESTION TO MAKE SURE YOU<br />
GO TO THE LONG DISTANCE<br />
JOURNEY SECTION FOR@R<br />
^LDMIntName"<br />
1. "Yes"<br />
2. "No"
BLDJINT / QLDJINT.NTS<br />
If Respondent made any long distance<br />
journyeys (AnyLDJ2 = Yes) THEN<br />
LDJInt<br />
"^LDMIntName<br />
INTERVIEWER: DO YOU WANT TO<br />
ENTER THE JOURNEYS MADE BY<br />
^LDMIntname NOW OR LATER?"<br />
1. "Now"<br />
2. "Later"<br />
TLDJQs / QTLDJQs.NTS<br />
BLDJQs<br />
IF Respondent made any long<br />
distance journyeys (AnyLDJ2 = Yes)<br />
THEN<br />
LDJ<br />
"ENTER LONG DISTANCE JOURNEY<br />
NUMBER"<br />
IF Respondent made any long<br />
distance journyeys (AnyLDJ2 = Yes)<br />
THEN<br />
LDJDate<br />
"^LDMIntName<br />
On what date did you make your<br />
^LOrdTxt long distance journey of 50<br />
miles or more ^LLDJQs2?"<br />
IF Respondent made more than one<br />
long distance journey (LTLDJQs1 > 1)<br />
THEN<br />
RepJ<br />
"^LDMIntName<br />
IF REPEAT OF PREVIOUS<br />
JOURNEY MADE BY THIS PERSON,<br />
ENTER JOURNEY NUMBER, THEN<br />
PRESS THEN .<br />
OTHERWISE ENTER 0"<br />
(QUESTION ADDED <strong>2003</strong><br />
ONWARDS:)<br />
National Centre for Social Research<br />
268<br />
IF Respondent made more than one<br />
long distance journey (LTLDJQs1 > 1)<br />
THEN<br />
RepJR<br />
"^LDMIntName<br />
IF RETURN JOURNEY OF<br />
PREVIOUS JOURNEY MADE BY<br />
THIS PERSON, ENTER JOURNEY<br />
NUMBER, THEN PRESS <br />
THEN .<br />
OTHERWISE ENTER 0"<br />
IF Respondent made more than one<br />
long distance journey (LTLDJQs1 > 1)<br />
THEN<br />
DupP<br />
"^LDMIntName<br />
IF DUPLICATE OF JOURNEY MADE<br />
BY ANOTHER HOUSEHOLD<br />
MEMBER, ENTER THEIR PERSON<br />
NUMBER<br />
OTHERWISE ENTER 0<br />
IF Respondent made more than one<br />
long distance journey (LTLDJQs1 > 1)<br />
THEN<br />
DupJ<br />
"^LDMIntName<br />
ENTER<br />
^QNames.QBNames[DupP].Name's<br />
JOURNEY NUMBER FOR THE<br />
DUPLICATE JOURNEY, THEN<br />
PRESS THEN .<br />
^DupJTxt[1] ^DupJTxt[2]<br />
^DupJTxt[3] ^DupJTxt[4]<br />
^DupJTxt[5] ^DupJTxt[6]<br />
^DupJTxt[7] ^DupJTxt[8]<br />
^DupJTxt[9] ^DupJTxt[10]<br />
^DupJTxt[11] ^DupJTxt[12]<br />
^DupJTxt[13] ^DupJTxt[14]<br />
^DupJTxt[15] ^DupJTxt[16]<br />
^DupJTxt[17] ^DupJTxt[18]<br />
^DupJTxt[19] ^DupJTxt[20]<br />
^DupJTxt[21] ^DupJTxt[22]<br />
^DupJTxt[23] ^DupJTxt[24]<br />
^DupJTxt[25] ^DupJTxt[26]<br />
^DupJTxt[27] ^DupJTxt[28]<br />
^DupJTxt[29] ^DupJTxt[30]<br />
^DupJTxt[31] ^DupJTxt[32]<br />
^DupJTxt[33] ^DupJTxt[34]<br />
^DupJTxt[35] ^DupJTxt[36]
^DupJTxt[37] ^DupJTxt[38]<br />
^DupJTxt[39] ^DupJTxt[40]"<br />
ASK FOR ALL LONG DISTANCE<br />
JOURNEYS<br />
Orig<br />
"^LDMIntName<br />
From where did your journey begin?<br />
INTERVIEWER: TYPE IN FIRST<br />
FEW LETTERS OF PLACE NAME TO<br />
ENTER<br />
CODING FRAME. IF THE PLACE IS<br />
NOT LISTED, TYPE XXX AND CODE<br />
AS 89 (NOT LISTED/DON'T KNOW).<br />
IF NECESSARY USE SHOW CARD N<br />
TO FIND OUT WHETHER THIS<br />
PLACE IS WITHIN M25 BOUNDARY.<br />
ON EXITING THE CODING FRAME<br />
PRESS ENTER AGAIN TO MOVE TO<br />
NEXT QUESTION."<br />
IF placename is not in codeframe<br />
(Orig = 89)THEN<br />
XOrig<br />
"^LDMIntName<br />
INTERVIEWER: TYPE IN NAME OF<br />
PLACE FROM WHICH JOURNEY<br />
BEGAN, INCLUDING COUNTY OR<br />
NEAREST LARGE TOWN"<br />
CODE FOR ALL LONG DISTANCE<br />
JOURNEYS<br />
OrigUA<br />
"^LDMIntName<br />
Unitary Authority code of origin<br />
PRECODED - PRESS ENTER TO<br />
CONTINUE"<br />
ASK FOR ALL LONG DISTANCE<br />
JOURNEYS<br />
OrigUR<br />
"^LDMIntName<br />
Urban/Rural code of origin<br />
PRECODED - PRESS ENTER TO<br />
CONTINUE"<br />
National Centre for Social Research<br />
269<br />
ASK FOR ALL LONG DISTANCE<br />
JOURNEYS<br />
OrigPl<br />
"Place of origin - from coding frame"<br />
ASK FOR ALL LONG DISTANCE<br />
JOURNEYS<br />
PurpTo<br />
"^LDMIntName<br />
What was the purpose of your<br />
journey?<br />
PROBE AS NECESSARY.<br />
Was it @Iprincipally@I to pick up or<br />
accompany someone else?<br />
IF SO: What were @Ithey@I doing at<br />
the time?<br />
TYPE IN AS MUCH DETAIL AS<br />
POSSIBLE"<br />
ASK FOR ALL LONG DISTANCE<br />
JOURNEYS<br />
PurpFro1<br />
"^LDMIntName<br />
ASK OR RECORD<br />
(Can I check) Did your journey start<br />
from home or from somewhere else?"<br />
1. "Home"<br />
2. "Somewhere else"<br />
If the journey started from somewhere<br />
else (PurpFro1 = Elsew) THEN<br />
PurpFro<br />
"^LDMIntName<br />
Why were you at the place where your<br />
journey started from?<br />
ADD IF NECESSARY: 'for example,<br />
were you at work/college, visiting<br />
friends, on holiday etc?'<br />
PROBE AS NECESSARY.<br />
Were you there @Iprincipally@I to<br />
pick up or accompany someone else?<br />
IF SO: What were @Ithey@I doing at<br />
the time?<br />
TYPE IN AS MUCH DETAIL AS<br />
POSSIBLE"
ASK FOR ALL LONG DISTANCE<br />
JOURNEYS<br />
Dest<br />
"^LDMIntName<br />
Where did your journey end?<br />
INTERVIEWER: TYPE IN FIRST FEW<br />
LETTERS OF PLACE NAME TO<br />
ENTER CODING FRAME. IF THE<br />
PLACE IS NOT LISTED, TYPE XXX<br />
AND CODE AS 89 (NOT<br />
LISTED/DON'T KNOW).<br />
IF NECESSARY USE SHOW CARD N<br />
TO FIND OUT WHETHER THIS<br />
PLACE IS WITHIN M25 BOUNDARY<br />
ON EXITING THE CODING FRAME,<br />
PRESS ENTER AGAIN TO MOVE TO<br />
THE NEXT QUESTION. (EXTRA INT.<br />
INSTRUCTION ADDED <strong>2003</strong><br />
ONWARDS)"<br />
IF placename is not in codeframe<br />
(Dest = 89) THEN<br />
XDest<br />
"^LDMIntName<br />
INTERVIEWER: TYPE IN NAME OF<br />
PLACE WHERE JOURNEY ENDED,<br />
INCLUDING COUNTY OR NEAREST<br />
LARGE TOWN"<br />
ASK FOR ALL LONG DISTANCE<br />
JOURNEYS<br />
Dist<br />
"^LDMIntName<br />
How far did you travel (in total on this<br />
journey)?<br />
IF INFORMANT ANSWERS DON'T<br />
KNOW, ASK FOR AN ESTIMATE.<br />
ENTER DISTANCE IN MILES"<br />
ASK FOR ALL LONG DISTANCE<br />
JOURNEYS<br />
Meth95<br />
"^LDMIntName<br />
What method of travel did you use for<br />
the main part of your journey? (By<br />
main part I mean the part of your<br />
journey which covered the longest<br />
distance) (HELP )"<br />
National Centre for Social Research<br />
270<br />
1. "Walk"<br />
2. "Bicycle"<br />
3. "Private (hire) bus"<br />
4. "Car"<br />
5. "Motorcycle"<br />
6. "Van, lorry"<br />
7. "Other private"<br />
8. "Ordinary bus - London"<br />
9. "Ordinary bus - elsewhere"<br />
10. "Coach, express bus"<br />
11. "Excursion/tour bus"<br />
12. "LT Underground"<br />
13. "Train"<br />
14. "Light Rail"<br />
15. "Aircraft (public)"<br />
16. "Taxi"<br />
17. "Minicab"<br />
18. "Other public"<br />
19. "Private (unspecified)"<br />
20. "Public (unspecified)"<br />
IF LDJ was undertaken in a private<br />
vehicle (Meth95 IN [Car, MCycle,<br />
VanLorry, OthPriv]) AND age 16 or<br />
more (DVAge >= 16) THEN<br />
DriPas<br />
"^LDMIntName<br />
Were you the driver of this vehicle or<br />
the passenger?<br />
(HELP )"<br />
1. "Driver"<br />
2. "Passenger"<br />
ASK FOR ALL LONG DISTANCE<br />
JOURNEYS<br />
More<br />
"^LDMIntName<br />
Did you make any other long distance<br />
journeys<br />
^LLDJQs2?<br />
Please include return journeys.<br />
@R^LLDJQs3@R"<br />
1. "Yes"<br />
2. "No"<br />
EndInd
"INTERVIEWER: THAT COMPLETES<br />
THE INDIVIDUAL INTERVIEW FOR<br />
^LDMIntName"<br />
1. "Press 1 and to continue."<br />
Individual Pick Up Interview<br />
TPickUp / QTPICKUP.NTS<br />
BPickUp<br />
Questions asked if:<br />
QSignIn.StatusQ = Pickup<br />
RECORD ALWAYS<br />
WhoPU<br />
"Which person do you want to do the<br />
individual pick up interview for?<br />
ENTER PERSON NUMBER FROM<br />
LIST BELOW.<br />
1. ^PUNames[1]<br />
2. ^PUNames[2]<br />
3. ^PUNames[3]<br />
4. ^PUNames[4]<br />
5. ^PUNames[5]<br />
6. ^PUNames[6]<br />
7. ^PUNames[7]<br />
8. ^PUNames[8]<br />
9. ^PUNames[9]<br />
10. ^PUNames[10]<br />
NB You may interview people in any<br />
order at pick up but if you do not follow<br />
the @Iplacement@I interview order<br />
shown below the facility to copy<br />
duplicate long distance journeys may<br />
not always be available.<br />
^LSOrdTxt"<br />
RECORD ALWAYS<br />
PUQn<br />
"CODE WHETHER FACE TO FACE<br />
INTERVIEW, PROXY INTERVIEW,<br />
OR PERSON NOT AVAILABLE.<br />
INTERVIEWER: IN GENERAL, FOR<br />
CHILDREN UNDER ELEVEN,<br />
INTERVIEW AN ADULT AND CODE<br />
AS 'PROXY'"<br />
1. "Face to face"<br />
2. "Proxy"<br />
3. "Not available"<br />
National Centre for Social Research<br />
271<br />
RECORD ALWAYS<br />
Session<br />
"Session original interview in"<br />
RECORD ALWAYS<br />
SessLine<br />
"Line number in session original<br />
interview in"<br />
IF Respondent aged over 4 (DVAge ><br />
4) THEN<br />
StckPic<br />
"^LDMIntName.<br />
SHOW CARD R<br />
Since I interviewed you on<br />
^QSignin.StartTxt, have you bought or<br />
been given any of these special tickets<br />
or passes, valid for a week or longer?<br />
INTERVIEWER: EXCLUDE ONE DAY<br />
TRAVELCARDS AND CARNETS.<br />
BLUE/ORANGE DISABLED BADGES<br />
ARE NOT INCLUDED. (EXTRA INT.<br />
INSTRUCTION ADDED <strong>2003</strong><br />
ONWARDS)<br />
ASK TO SEE TICKET/PASS."<br />
1. "Yes"<br />
2. "No"<br />
IF Respondent aged over 4 (DVAge ><br />
4) AND IF Respondent has been<br />
bought or been given a special ticket<br />
or pass (StckPic = Yes) THEN<br />
NewTNo<br />
"^LDMIntName.<br />
How many special tickets or passes<br />
have you bought or been given since<br />
then?"<br />
NewTick<br />
"^LDMIntName<br />
^LNewTTxt<br />
IF ANY DIFFERENT, CODE NUMBER<br />
OF @INEW@I TICKETS.<br />
IF ONLY REPLACEMENT TICKETS<br />
OBTAINED SINCE THE PLACEMENT<br />
INTERVIEW THEN CODE '0'"
ASK ALWAYS<br />
DLFNew<br />
"^LDMIntName<br />
Since I last interviewed you on<br />
^QSignin.StartTxt, have you acquired<br />
a full driving licence valid in Great<br />
Britain to drive either a car, or a<br />
motorcycle, scooter or moped?"<br />
1. "Yes"<br />
2. "No"<br />
IF Respondent has a driving licence<br />
OR the respondent has a licence for a<br />
motorcycle over 125CC (IF DLTyp95 =<br />
Car OR Auto OR CarRes OR<br />
CarMot95 = RESPONSE) THEN<br />
Drive95<br />
"^LDMIntName<br />
Do you drive... READ OUT ...<br />
(HELP )<br />
CODE AUTOMATIC CAR AS AN<br />
ORDINARY CAR<br />
CODE ALL THAT APPLY"<br />
1. "...an ordinary car (without special<br />
adaptations for people with<br />
disabilities),"<br />
2. "...a car with special adaptations<br />
for people with disabilities,"<br />
3. "...or some other kind of vehicle?"<br />
4. "(no longer drive)"<br />
IF Respondent has not acquired a full<br />
driving licence (DLFNew = No) THEN<br />
DLNPro<br />
"^LDMIntName<br />
Have you acquired a provisional<br />
driving licence since I<br />
last interviewed you on<br />
^QSignin.PlDay, ^QSignin.StartTxt?"<br />
1. "Yes"<br />
2. "No"<br />
ASK ALWAYS<br />
AnyLDJP<br />
"^LDMIntName<br />
National Centre for Social Research<br />
272<br />
(Now I'd like to ask you about long<br />
distance journeys you may have made<br />
between<br />
^LWhoLDJ1 and ^QSignin.Rec2day,<br />
^QSignin.Rec2.<br />
By long distance I mean a journey<br />
made within Great Britain of 50 miles<br />
or more in one direction say from here<br />
to [2 or 3 places 45 miles away]).<br />
Have you made any journeys within<br />
Great Britain of 50 miles or more<br />
between ^LWhoLDJ1 and<br />
^QSignin.Rec2Day, ^QSignin.Rec2?"<br />
1. "Yes and ready to enter now"<br />
2. "Yes but code later"<br />
3. "No"<br />
(QUESTION ADDED <strong>2003</strong><br />
ONWARDS:)<br />
LDJDisp<br />
"INTERVIEWER: Use <br />
and select Session ^SessionN from<br />
the parallel block menu.<br />
Once you have selected the session<br />
use the key to take<br />
you to point where journey details can<br />
be entered for ^LDMIntName.<br />
Do not enter '1' here until you have<br />
entered the long distance<br />
Journeys.<br />
1. "Press 1 and to continue."<br />
IF Respondent has not made a long<br />
distance journey since the placement<br />
interview (AnyLDJP = No) THEN<br />
Long2<br />
"^LDMIntName<br />
@ Have you made a longer journey<br />
than the one of<br />
^QTWhoLDJ[Session].WhoLDJ[SessLi<br />
ne].Longestx miles that you mentioned<br />
at the first interview?<br />
IF THE JOURNEY WAS 50 MILES<br />
OR MORE GO BACK AND CHANGE<br />
AnyLDJP TO 'YES'."<br />
1. "Yes"<br />
2. "No"
IF Respondent is aged between 5 and<br />
15 (DVAge = 5) THEN<br />
YPDQ<br />
"INTERVIEWER: CHECK DAY 7 OF<br />
^LDMintName's DIARY TO SEE IF<br />
'TIME SPENT IN THE STREET' HAS<br />
BEEN COMPLETED.<br />
IF NOT FULLY COMPLETED, ASK<br />
FOR THIS INFORMATION AND<br />
ENTER IT NOW.<br />
IF COMPLETED, ENTER LATER.<br />
(INT. INSTRUCTION DELETED <strong>2003</strong><br />
ONWARDS)<br />
IF NO TIME WAS SPENT IN THE<br />
STREET, ENTER 'NOW' AND<br />
RECORD 'NO' AT THE NEXT<br />
QUESTION"<br />
1. "Now"<br />
2. "Later"<br />
IF Respondent is aged between 5 and<br />
15 (DVAge = 5) AND IF<br />
Time spent on street is entered now<br />
(YPDQ = Now) THEN<br />
InStreet<br />
"Did ^LDMIntName spend any time in<br />
the street on day 7 that was not<br />
included in the journeys for that day?<br />
ASK OR RECORD."<br />
1. "Yes"<br />
2. "No"<br />
(CHANGED <strong>2003</strong> ONWARDS TO:)<br />
"Did ^LDMIntName/you spend any<br />
time playing in the street on day 7<br />
which was not included in the journeys<br />
for that day? "<br />
ASK OR RECORD.<br />
1. "Yes"<br />
2. "No"<br />
IF Respondent is aged between 5 and<br />
15 (DVAge = 5) AND IF<br />
Respondent spent time in the street on<br />
day 7 (InStreet = Yes) THEN<br />
Start1<br />
"^LDMIntName<br />
ENTER START TIME OF 1st PERIOD<br />
IN STREET IN 24 HOUR CLOCK<br />
(E.G. 13:00)"<br />
National Centre for Social Research<br />
273<br />
(CHANGED <strong>2003</strong> ONLY TO:)<br />
"^LDMIntName<br />
When did you go out to play for the<br />
first time on that day?<br />
ENTER START TIME OF 1st PERIOD<br />
IN STREET IN 24 HOUR CLOCK<br />
(E.G. 13:00)"<br />
(CHANGED <strong>2004</strong> ONWARDS TO:)<br />
"^LDMIntName<br />
When did you go out to play for the<br />
first time on that day?<br />
ENTER START TIME OF 1st PERIOD<br />
IN STREET IN 24 HOUR CLOCK<br />
(E.G. 13:00 for 1pm in the afternoon,<br />
18.30 for 6.30pm in the evening)"<br />
End1<br />
"^LDMIntName<br />
ENTER END TIME OF 1st PERIOD IN<br />
STREET IN 24 HOUR CLOCK (E.G.<br />
13:00)"<br />
(CHANGED <strong>2003</strong> ONLY TO:)<br />
"And when did you finish playing in the<br />
street?<br />
ENTER END TIME OF 1st PERIOD IN<br />
STREET IN 24 HOUR CLOCK (E.G.<br />
13:00)"<br />
(CHANGED <strong>2004</strong> ONWARDS TO:)<br />
"And when did you finish playing in the<br />
street?<br />
ENTER END TIME OF 1st PERIOD IN<br />
STREET IN 24 HOUR CLOCK (E.G.<br />
13:00 for 1pm in the afternoon, 18.30<br />
for 6.30pm in the evening)"<br />
Start2<br />
"^LDMIntName<br />
ENTER START TIME OF 2nd<br />
PERIOD IN STREET IN 24 HOUR<br />
CLOCK (E.G. 13:00)<br />
IF NO MORE PERIODS IN STREET<br />
PRESS "
(CHANGED <strong>2003</strong> ONLY TO:)<br />
"^LDMIntName<br />
When did you go out to play for the<br />
second time on that day?<br />
ENTER START TIME OF 2nd<br />
PERIOD IN STREET IN 24 HOUR<br />
CLOCK (E.G. 13:00)"<br />
(CHANGED <strong>2004</strong> ONWARDS TO:)<br />
"^LDMIntName<br />
When did you go out to play for the<br />
second time on that day?<br />
ENTER START TIME OF 2nd<br />
PERIOD IN STREET IN 24 HOUR<br />
CLOCK (E.G. 13:00 for 1pm in the<br />
afternoon, 18.30 for 6.30pm in the<br />
evening)"<br />
End2<br />
"^LDMIntName<br />
ENTER END TIME OF 2nd PERIOD<br />
IN STREET IN 24 HOUR CLOCK<br />
(E.G. 13:00)<br />
(CHANGED <strong>2003</strong> ONLY TO:)<br />
"And when did you finish playing in the<br />
street?<br />
ENTER END TIME OF 2nd PERIOD<br />
IN STREET IN 24 HOUR CLOCK<br />
(E.G. 13:00)"<br />
(CHANGED <strong>2004</strong> ONWARDS TO:)<br />
"And when did you finish playing in the<br />
street?<br />
ENTER END TIME OF 2nd PERIOD<br />
IN STREET IN 24 HOUR CLOCK<br />
(E.G. 13:00 for 1pm in the afternoon,<br />
18.30 for 6.30pm in the evening)"<br />
Start3<br />
"^LDMIntName<br />
ENTER START TIME OF 3rd PERIOD<br />
IN STREET IN 24 HOUR CLOCK<br />
(E.G. 13:00)<br />
IF NO MORE PERIODS IN STREET<br />
PRESS "<br />
(CHANGED <strong>2003</strong> ONLY TO:)<br />
"^LDMIntName<br />
National Centre for Social Research<br />
274<br />
When did you go out to play for the<br />
third time on that day?<br />
ENTER START TIME OF 3rd PERIOD<br />
IN STREET IN 24 HOUR CLOCK<br />
(E.G. 13:00)"<br />
(CHANGED <strong>2004</strong> ONWARDS TO:)<br />
"^LDMIntName<br />
When did you go out to play for the<br />
third time on that day?<br />
ENTER START TIME OF 3rd PERIOD<br />
IN STREET IN 24 HOUR CLOCK<br />
(E.G. 13:00 for 1pm in the afternoon,<br />
18.30 for 6.30pm in the evening)"<br />
End3<br />
"^LDMIntName<br />
ENTER END TIME OF 3rd PERIOD IN<br />
STREET IN 24 HOUR CLOCK (E.G.<br />
13:00)<br />
(CHANGED <strong>2003</strong> ONLY TO:)<br />
"And when did you finish playing in the<br />
street?<br />
ENTER END TIME OF 3rd PERIOD IN<br />
STREET IN 24 HOUR CLOCK (E.G.<br />
13:00)"<br />
(CHANGED <strong>2004</strong> ONWARDS TO:)<br />
"And when did you finish playing in the<br />
street?<br />
ENTER END TIME OF 3rd PERIOD IN<br />
STREET IN 24 HOUR CLOCK (E.G.<br />
13:00 for 1pm in the afternoon, 18.30<br />
for 6.30pm in the evening)"<br />
Start4<br />
"^LDMIntName<br />
ENTER START TIME OF 4th PERIOD<br />
IN STREET IN 24 HOUR CLOCK<br />
(E.G. 13:00)<br />
IF NO MORE PERIODS IN STREET<br />
PRESS "<br />
(CHANGED <strong>2003</strong> ONLY TO:)<br />
"^LDMIntName<br />
When did you go out to play for the<br />
fourth time on that day?
ENTER START TIME OF 4th PERIOD<br />
IN STREET IN 24 HOUR CLOCK<br />
(E.G. 13:00)"<br />
(CHANGED <strong>2004</strong> ONWARDS TO:)<br />
"^LDMIntName<br />
When did you go out to play for the<br />
fourth time on that day?<br />
ENTER START TIME OF 4th PERIOD<br />
IN STREET IN 24 HOUR CLOCK<br />
(E.G. 13:00 for 1pm in the afternoon,<br />
18.30 for 6.30pm in the evening)"<br />
End4<br />
"^LDMIntName<br />
ENTER END TIME OF 4th PERIOD IN<br />
STREET IN 24 HOUR CLOCK (E.G.<br />
13:00)<br />
(CHANGED <strong>2003</strong> ONLY TO:)<br />
"And when did you finish playing in the<br />
street?<br />
ENTER END TIME OF 4th PERIOD IN<br />
STREET IN 24 HOUR CLOCK (E.G.<br />
13:00)"<br />
(CHANGED <strong>2004</strong> ONWARDS TO:)<br />
"And when did you finish playing in the<br />
street?<br />
ENTER END TIME OF 4th PERIOD IN<br />
STREET IN 24 HOUR CLOCK (E.G.<br />
13:00 for 1pm in the afternoon, 18.30<br />
for 6.30pm in the evening)"<br />
Start5<br />
"^LDMIntName<br />
ENTER START TIME OF 5th PERIOD<br />
IN STREET IN 24 HOUR CLOCK<br />
(E.G. 13:00)<br />
IF NO MORE PERIODS IN STREET<br />
PRESS "<br />
(CHANGED <strong>2003</strong> ONLY TO:)<br />
"^LDMIntName<br />
When did you go out to play for the<br />
fifth time on that day?<br />
ENTER START TIME OF 5th PERIOD<br />
IN STREET IN 24 HOUR CLOCK<br />
(E.G. 13:00)"<br />
National Centre for Social Research<br />
275<br />
(CHANGED <strong>2004</strong> ONWARDS TO:)<br />
"^LDMIntName<br />
When did you go out to play for the<br />
fifth time on that day?<br />
ENTER START TIME OF 5th PERIOD<br />
IN STREET IN 24 HOUR CLOCK<br />
(E.G. 13:00 for 1pm in the afternoon,<br />
18.30 for 6.30pm in the evening)"<br />
End5<br />
"^LDMIntName<br />
ENTER END TIME OF 5th PERIOD IN<br />
STREET IN 24 HOUR CLOCK (E.G.<br />
13:00)<br />
(CHANGED <strong>2003</strong> ONLY TO:)<br />
"And when did you finish playing in the<br />
street?<br />
ENTER END TIME OF 5th PERIOD IN<br />
STREET IN 24 HOUR CLOCK (E.G.<br />
13:00)"<br />
(CHANGED <strong>2004</strong> ONWARDS TO:)<br />
"And when did you finish playing in the<br />
street?<br />
ENTER END TIME OF 5th PERIOD IN<br />
STREET IN 24 HOUR CLOCK (E.G.<br />
13:00 for 1pm in the afternoon, 18.30<br />
for 6.30pm in the evening)"
Vehicle Questionnaire<br />
BVehInt / QVehInt.NTS<br />
Questions asked if:<br />
QVehNum.Numveh > 0<br />
AND<br />
QTVehTab.QVehTab[LVLoop].Whe<br />
nAcq Aftr<br />
Questions asked of:<br />
Respondent who best knows about<br />
vehicle (normally main driver but not<br />
necessarily)<br />
ALWAYS RECORD<br />
Intro<br />
"THIS IS THE START OF THE<br />
VEHICLE QUESTIONNAIRE FOR<br />
THE ^DMVEH[LVLoop]<br />
INTERVIEWER: DO YOU WANT TO<br />
COMPLETE THE QUESTIONNAIRE<br />
FOR THIS VEHICLE NOW OR<br />
LATER?<br />
INTERVIEWER: ASK THESE<br />
QUESTIONS OF THE MAIN DRIVER<br />
(^MDName) IF POSSIBLE<br />
^LPUTxt"<br />
1. "Now"<br />
2. "Later"<br />
ASK ALWAYS<br />
RegIntr<br />
"I'd now like to ask for some details<br />
about the ^DMVEH[LVLoop] so that<br />
we can collect information about the<br />
types of motor vehicles that people<br />
use.<br />
First, could you give me the<br />
registration number."<br />
1. "Willing to give (British) registration<br />
number"<br />
2. "Not willing to give registration<br />
number"<br />
3. "Foreign registration number"<br />
National Centre for Social Research<br />
276<br />
(PRECODES CHANGED <strong>2003</strong><br />
ONWARDS TO:)<br />
1. "Willing to give (British) registration<br />
number"<br />
2. "Not willing to give registration<br />
number"<br />
3. "Willing to give registration number<br />
but cannot remember it correctly"<br />
4. "Foreign registration number"<br />
IF Respondent is willing to give<br />
registration number (RegIntr = Willing)<br />
THEN:<br />
RegExpl<br />
"READ OUT: We will use this to look<br />
up some details already held by DVLA.<br />
No information on your vehicle will be<br />
given to anyone outside the statistics<br />
section at DTLR and the registration<br />
number will not be used to identify you<br />
or your household.<br />
DVLA = DRIVER AND VEHICLE<br />
LICENSING AGENCY"<br />
1. "Acceptable to respondent -<br />
continue"<br />
2. "Not acceptable - change RegIntr"<br />
(CHANGED <strong>2004</strong> ONWARDS TO:)<br />
"READ OUT: We will use this to look<br />
up some details already held by DVLA.<br />
No information on your vehicle will be<br />
given to anyone outside the statistics<br />
section at DfT and the registration<br />
number will not be used to identify you<br />
or your household.<br />
DVLA = DRIVER AND VEHICLE<br />
LICENSING AGENCY"<br />
1. "Acceptable to respondent -<br />
continue"<br />
2. "Not acceptable - change RegIntr"<br />
IF this is acceptable (RegExpl =<br />
Accept) THEN:<br />
VRegNo1<br />
"ENTER REGISTRATION NUMBER<br />
FOR THE ^DMVEH[LVLoop]<br />
INTERVIEWER: PLEASE USE<br />
CAPITAL LETTERS AND DO NOT<br />
USE SPACES BETWEEN PARTS OF<br />
THE CODE."
IF this is acceptable (RegExpl =<br />
Accept) THEN:<br />
RFormat<br />
"INTERVIEWER: CODE FORMAT OF<br />
REGISTRATION NUMBER.<br />
(HOW REGISTRATION YEAR OF<br />
VEHICLE IS IDENTIFIED)."<br />
1. "AB@I12@ICDE (new format 2001<br />
onwards, with registration year shown<br />
by 2 numbers)."<br />
2. "@IA@I123CDE, @IA@I12BCD,<br />
@IA@I1BCD (old format 1983-2001<br />
with registration year letter at the<br />
@Istart@I)."<br />
3. "ABC123@ID@I, ABC12@ID@I,<br />
ABC1@ID@I (old pre-1983 format<br />
with registration year letter at the<br />
@Iend@I)."<br />
4. "None of these"<br />
IF this is acceptable (RegExpl =<br />
Accept) THEN:RegNo<br />
"Can I ask you to repeat your<br />
registration number, so I can check it<br />
is recorded correctly.<br />
INTERVIEWER: ENTER<br />
REGISTRATION NUMBER FOR THE<br />
^DMVEH[LVLoop] AGAIN TO<br />
CONFIRM.<br />
PLEASE USE CAPITAL LETTERS<br />
AND DO NOT USE SPACES<br />
BETWEEN PARTS OF THE CODE.<br />
READ NUMBER BACK TO<br />
RESPONDENT TO VERIFY.<br />
^LPUTxt"<br />
IF Registration number not given<br />
(RegNo Response) THEN:<br />
FuelTyp<br />
"^DMVEH[LVLoop]<br />
What fuel does the<br />
^DMVEH[LVLoop]'s engine use?"<br />
1. "Petrol (INCLUDES LEAD FREE<br />
AND TWO STROKE)"<br />
2. "Diesel"<br />
3. "Electric/Battery"<br />
4. "Liquefied Petroleum Gas (LPG)"<br />
5. "Bi-fuel (petrol/gas)"<br />
97. "Other (SPECIFY)"<br />
National Centre for Social Research<br />
277<br />
IF Some other fuel type is used<br />
(FuelTyp = Other) THEN:<br />
XFuelTyp<br />
"^DMVEH[LVLoop]<br />
PLEASE SPECIFY THE OTHER<br />
ANSWER.<br />
TEXT SHOULD BE NO MORE THAN<br />
60 CHARACTERS"<br />
IF Registration number not given<br />
(RegNo Response) AND the<br />
vehicle uses petrol (FuelTyp = Petrol)<br />
THEN:<br />
Leaded<br />
"^DMVEH[LVLoop]<br />
ASK OR RECORD<br />
Is the petrol... READ OUT...<br />
(HELP )"<br />
1. "...always unleaded,"<br />
2. "sometimes unleaded, sometimes<br />
lead replacement petrol (LRP),"<br />
3. "always lead replacement petrol,"<br />
4. "or always leaded (classic cars<br />
only)?"<br />
(PRECODES CHANGED <strong>2003</strong> ONLY<br />
TO:)<br />
1. "...always unleaded,"<br />
2. "sometimes unleaded, sometimes<br />
lead replacement petrol (LRP),"<br />
3. "always lead replacement petrol,"<br />
4. "CLASSIC CARS ONLY: or always<br />
leaded?"<br />
Leaded(QUESTION DELETED <strong>2004</strong><br />
ONWARDS)<br />
BVMake / QVMake.NTS<br />
Questions asked if:<br />
QVehNum.Numveh > 0<br />
AND<br />
QTVehTab.QVehTab[LVLoop].Whe<br />
nAcq Aftr<br />
AND
QVehInt.Intro = Now<br />
AND<br />
QVehInt.FuelTyp Electric<br />
Questions asked of:<br />
Respondent who best knows about<br />
vehicle (normally main driver but not<br />
necessarily)<br />
IF Registration number not given<br />
(RegNo Response) AND IF vehicle<br />
does not use electric/battery fuel<br />
(QVehInt.Fueltyp Electric) THEN:<br />
LogBook<br />
"^DMVEH[LVLoop]<br />
I need to obtain details about the<br />
^DMVEH[LVLoop] which are given in<br />
the registration document (or log<br />
book).<br />
ASK RESPONDENT TO GET LOG<br />
BOOK IF POSSIBLE."<br />
1. "Seen by interviewer"<br />
2. "Consulted by informant"<br />
3. "Not seen /consulted"<br />
IF Registration number not given<br />
(RegNo Response) AND IF vehicle<br />
does not use electric/battery fuel<br />
(QVehInt.Fueltyp Electric) THEN:<br />
Personal<br />
"^DMVEH[LVLoop]<br />
Is the registration number for this<br />
vehicle a personalised or cherished<br />
number?"<br />
1. "Yes"<br />
2. "No"<br />
IF Registration number not given<br />
(RegNo Response) AND IF vehicle<br />
does not use electric/battery fuel<br />
(QVehInt.Fueltyp Electric) AND IF<br />
Registration number is not<br />
personalised or cherished (Personal<br />
Yes) THEN:<br />
SimReg<br />
"SHOW CARD T1<br />
National Centre for Social Research<br />
278<br />
^DMVEH[LVLoop]<br />
Which of the numbers on this card<br />
looks similiar to your registration<br />
number?<br />
POINT TO EACH AND SAY:Is it like<br />
this with two letters, then two numbers,<br />
or like this with a letter at the start, or<br />
like this with a letter at the end?"<br />
1. "AB@I12@I CDE"<br />
2. "@IA@I123 CDE, @IA@I12 BCD,<br />
@IA@I1 BCD"<br />
3. "ABC 123@ID@I, ABC 12@ID@I,<br />
ABC 1@IA@I"<br />
4. "None of these"<br />
(CHANGED <strong>2003</strong> ONWARDS TO:)<br />
"SHOW CARD U1<br />
^DMVEH[LVLoop]<br />
I would like to know the registration<br />
year of the ^DMVEH[LVLoop].<br />
To help with this, can you tell me<br />
which of the numbers on this<br />
card looks similar to the<br />
^DMVEH[LVLoop]'s registration<br />
number?<br />
POINT TO EACH AND SAY:Is it like<br />
this with two letters, then two numbers,<br />
or like this with a letter at the start, or<br />
like this with a letter at the end?"<br />
1. "AB@I12@I CDE"<br />
2. "@IA@I123 CDE, @IA@I12 BCD,<br />
@IA@I1 BCD"<br />
3. "ABC 123@ID@I, ABC 12@ID@I,<br />
ABC 1@IA@I"<br />
4. "None of these"<br />
IF Registration number not given<br />
(RegNo Response) AND IF vehicle<br />
does not use electric/battery fuel<br />
(QVehInt.Fueltyp Electric) AND IF<br />
Registration number is not<br />
personalised or cherished (Personal<br />
Yes) AND IF Registration number<br />
is not in any given pattern (NOT<br />
(SimReg IN [Pat1..Pat3])) THEN:<br />
LookReg<br />
"^DMVEH[LVLoop]<br />
Could I look at the registration number<br />
to find out which letter denotes the<br />
year in your registration number? I will<br />
not enter the whole number into the<br />
computer
INTERVIEWER: Please refer to<br />
CHECK CARD 1."<br />
1. "Yes"<br />
2. "No"<br />
IF Registration number not given<br />
(RegNo Response) AND IF vehicle<br />
does not use electric/battery fuel<br />
(QVehInt.Fueltyp Electric) AND IF<br />
Registration number is not<br />
personalised or cherished (Personal<br />
Yes) AND IF Registration number<br />
follows format 1 above (SimReg =<br />
Pat1) THEN:<br />
WhatNum<br />
"^DMVEH[LVLoop]<br />
SHOW CARD T1<br />
What is the number in the middle of<br />
your registration number?<br />
RECORD THE RELEVANT NUMBER"<br />
(CHANGED <strong>2003</strong> ONWARDS TO:)<br />
"^DMVEH[LVLoop]<br />
SHOW CARD T1<br />
What is the number in the middle of<br />
the registration number that denotes<br />
the year?<br />
RECORD THE RELEVANT NUMBER"<br />
IF Registration number not given<br />
(RegNo Response) AND IF vehicle<br />
does not use electric/battery fuel<br />
(QVehInt.Fueltyp Electric) AND IF<br />
Registration number is not<br />
personalised or cherished (Personal<br />
Yes) AND IF (Registration number<br />
follows format 2 or 3 above OR<br />
Respondent showed the registration)<br />
(SimReg IN [Pat2..Pat3] OR (LookReg<br />
= Yes)) THEN:<br />
Letter<br />
"^DMVEH[LVLoop]<br />
SHOW CARD T1<br />
Which letter denotes the year^LetTxt<br />
INTERVIEWER: IF PATTERN<br />
SELECTED AT QUESTION SimReg<br />
POINT TO THE REGISTRATION<br />
SEQUENCE SELECTED ON SHOW<br />
CARD T1, AND ASK WHAT<br />
REGISTRATION LETTER IS IN THE<br />
National Centre for Social Research<br />
279<br />
SAME POSITION AS THE LETTER<br />
@IIN COLOUR@I ON THE CARD.<br />
INTERVIEWER: Please refer to<br />
CHECK CARD 1.<br />
RECORD THE RELEVANT LETTER"<br />
IF Registration number not given<br />
(RegNo Response) AND IF vehicle<br />
does not use electric/battery fuel<br />
(QVehInt.Fueltyp Electric) AND IF<br />
Registration number is not<br />
personalised or cherished (Personal<br />
Yes) AND IF the Respondent has<br />
given the letter which denotes the year<br />
of their vehicle’s registration (Letter =<br />
Response) AND Respondent showed<br />
the registration (LookReg = Yes)<br />
THEN:<br />
Numba<br />
"^DMVEH[LVLoop]<br />
Does the letter come at the beginning<br />
or the end of the registration number?<br />
ASK OR RECORD AND CHECK"<br />
1. "Letter before number"<br />
2. "Letter after number"<br />
IF Registration number not given<br />
(RegNo Response) AND IF vehicle<br />
does not use electric/battery fuel<br />
(QVehInt.Fueltyp Electric) THEN:<br />
RegYear<br />
"^DMVEH[LVLoop]<br />
ASK OR RECORD AND CHECK.<br />
Could you tell me the exact year and<br />
month in which the vehicle was first<br />
registered?<br />
^LVMake3<br />
ENTER YEAR HERE"<br />
IF Registration number not given<br />
(RegNo Response) AND IF vehicle<br />
does not use electric/battery fuel<br />
(QVehInt.Fueltyp Electric) THEN:<br />
RegMon<br />
"^DMVEH[LVLoop]<br />
MONTH OF FIRST REGISTRATION"
IF Registration number not given<br />
(RegNo Response) AND IF vehicle<br />
does not use electric/battery fuel<br />
(QVehInt.Fueltyp Electric) THEN:<br />
TaxCl<br />
"SHOW CARD T2<br />
^DMVEH[LVLoop]<br />
ASK OR RECORD AND CHECK<br />
To which of these taxation classes<br />
does the ^DMVEH[LVLoop] belong?"<br />
1. "Private and Light Goods(1.5 tons<br />
or less)"<br />
2. "Taxi (HACKNEY)"<br />
3. "3 wheel car (TRICYCLE)"<br />
4. "Disabled (DISABLED)"<br />
5. "Motorcycle, scooter, moped<br />
(BICYCLE)"<br />
6. "Heavy goods (more than 1.5<br />
tons)"<br />
97. "Other (SPECIFY)"<br />
(PRECODES CHANGED <strong>2003</strong><br />
ONWARDS TO:)<br />
1. "Private and Light Goods (3.5 tons<br />
gross weight or less)"<br />
2. "Motorcycle, scooter, moped, 3wheeler"<br />
3. "Heavy goods (more than 3.5 tons<br />
gross weight)"<br />
4. "Disabled - exempt"<br />
5. "Historic vehicle - exempt"<br />
97. "Other (SPECIFY)"<br />
IF the vehicle belongs in another tax<br />
class (TaxCl = Other) THEN:<br />
XTaxCl<br />
"Please specify other answer.<br />
Text should be no more than 60<br />
characters"<br />
IF Registration number not given<br />
(RegNo Response) AND IF vehicle<br />
does not use electric/battery fuel<br />
(QVehInt.Fueltyp Electric) AND IF<br />
Vehicle is a 4-wheeled car or a light<br />
van ((DMVEHTYPE[LVLoop] =<br />
"Wheel4") OR (DMVEHTYPE[LVLoop]<br />
= "LightVan")) AND IF Vehicle was<br />
manufactured since 1983 (LVMake1<br />
IN [1983..2012]) THEN:<br />
National Centre for Social Research<br />
280<br />
(IN <strong>2004</strong>, asked of all cars,even if<br />
registration number is given, hence<br />
removal of filter RegNoResponse)<br />
CarCoding<br />
"INTERVIEWER: Please code car<br />
make and model<br />
PRESS TO START<br />
CODING (HELP )<br />
Car make, model and modspec are:<br />
^DMVEH[LVLoop]<br />
^QTVehTab.QVehTab[LVLoop].Modsp<br />
ec<br />
If you can't find the right code type<br />
for 'don't know'<br />
ON EXITING THE CODING FRAME<br />
PRESS ENTER TO MOVE TO THE<br />
NEXT QUESTION"<br />
BEngFTS / QEngFts.NTS<br />
Questions asked if:<br />
QVehNum.Numveh > 0<br />
AND<br />
QTVehTab.QVehTab[LVLoop].Whe<br />
nAcq Aftr<br />
Questions asked of:<br />
Respondent who best knows about<br />
vehicle (normally main driver but not<br />
necessarily) if QVehNum.Numveh ><br />
0<br />
IF Registration number not given<br />
(RegNo Response) AND IF vehicle<br />
does not use electric/battery fuel<br />
(QVehInt.Fueltyp Electric) AND IF<br />
Registration number is not<br />
personalised or cherished (Personal<br />
Yes) AND IF vehicle is not<br />
classified as a heavy goods vehicle or<br />
vehicle is not given classification by<br />
the respondent (QVMake.Taxcl IN<br />
[Private…Motobike, other} OR<br />
QVMake.TaxCl RESPONSE)<br />
THEN:
(IN <strong>2004</strong>, asked of all cars,even if<br />
registration number is given, hence<br />
removal of filter RegNoResponse)<br />
EnSize<br />
"^DMVEH[LVLoop]<br />
ASK OR RECORD AND CHECK<br />
What is the size of the<br />
^DMVEH[LVLoop]'s engine in cc's?<br />
(1 litre = 1000 cc)<br />
PROBE IF ANSWER IS GIVEN TO<br />
NEAREST 100cc........(HELP ):"<br />
IF Registration number not given<br />
(RegNo Response) AND IF vehicle<br />
does not use electric/battery fuel<br />
(QVehInt.Fueltyp Electric) AND IF<br />
Registration number is not<br />
personalised or cherished (Personal<br />
Yes) AND IF vehicle is not<br />
classified as a heavy goods vehicle or<br />
vehicle is not given classification by<br />
the respondent (QVMake.Taxcl IN<br />
[Private…Motobike, other} OR<br />
QVMake.TaxCl RESPONSE) AND<br />
IF engine size is not known (EnSize =<br />
Don’t Know) THEN:<br />
BenSize<br />
"SHOW CARD U<br />
^DMVEH[LVLoop]<br />
Taking your answer from this card,<br />
what is the engine size?"<br />
1. "up to 50cc"<br />
2. "51 to 125cc"<br />
3. "126 to 250cc"<br />
4. "251 to 700cc"<br />
5. "701 to 1000cc (0.7 to 1 litre)"<br />
6. "1001 to 1300cc (1.0 to 1.3 litres)"<br />
7. "1301 to 1400cc (1.3 to 1.4 litres)"<br />
8. "1401 to 1500cc (1.4 to 1.5 litres)"<br />
9. "1501 to 1800cc (1.5 to 1.8 litres)"<br />
10. "1801 to 2000cc (1.8 to 2.0 litres)"<br />
11. "2001 to 2500cc (2.0 to 2.5 litres)"<br />
12. "2501 to 3000cc (2.5 to 3.0 litres)"<br />
13. "3001cc and over (3 litres and<br />
over)"<br />
IF Registration number not given<br />
(RegNo Response) AND IF vehicle<br />
does not use electric/battery fuel<br />
National Centre for Social Research<br />
281<br />
(QVehInt.Fueltyp Electric) AND IF<br />
(year of registration was before 1984<br />
((QVMake.RegYear = RESPONSE)<br />
AND (QVMake.RegYear < 1984)) OR<br />
IF registration letter was refused or not<br />
known ((QVMake.Letter = REFUSAL)<br />
OR (QVMake.Letter = DONTKNOW))<br />
OR IF number in middle of registration<br />
number is refused or not known<br />
((QVMake.WhatNum = REFUSAL) OR<br />
(QVMake.WhatNum = DONTKNOW))<br />
OR IF Fuel tank size is over 99 or not<br />
given ((QVMake.FuelTank =<br />
RESPONSE) AND (QVMake.FuelTank<br />
>= 99)) OR (QVMake.FuelTank <br />
RESPONSE)) THEN:<br />
IntQust<br />
"^DMVEH[LVLoop]<br />
^LEngFTS1"<br />
1. "Amount given in litres"<br />
2. "Amount given in gallons"<br />
IF Amount is in litres (IntQust = Litres)<br />
THEN:TankLtr<br />
"^DMVEH[LVLoop]<br />
ENTER THE AMOUNT IN LITRES"<br />
IF Amount is in litres (IntQust =<br />
Gallons) THEN:<br />
TankGal<br />
"^DMVEH[LVLoop]<br />
ENTER THE AMOUNT IN GALLONS.<br />
GIVE ANSWER TO ONE DECIMAL<br />
PLACE"<br />
BPark / QPark.NTS<br />
Questions asked if:<br />
QVehNum.Numveh > 0<br />
AND<br />
QTVehTab.QVehTab[LVLoop].Whe<br />
nAcq Aftr<br />
Questions asked of :<br />
Respondent who best knows about<br />
vehicle (normally main driver but not<br />
necessarily)
IF Vehicle does not use electric/battery<br />
fuel (QVehInt.Fueltyp Electric)<br />
THEN:<br />
WherePk<br />
"^DMVEH[LVLoop]<br />
Where is the ^DMVEH[LVLoop]<br />
usually parked overnight?<br />
Is it ... READ OUT"<br />
1. "...in the garage (at this address),"<br />
2. "not garaged but still on the<br />
property of this address,"<br />
3. "on the street or public highway,"<br />
4. "or, elsewhere (at or near your<br />
home)? (SPECIFY)"<br />
5. "(DOES NOT USUALLY PARK<br />
AT/NEAR HOME)"<br />
Wherepk(QUESTION DELETED <strong>2004</strong><br />
ONWARDS)<br />
IF Respondent parks elsewhere at or<br />
near their home (WherePk = Other)<br />
THEN:<br />
XWherePk<br />
"Please specify other answer.<br />
Text should be no more than 60<br />
characters"<br />
XWherePk(QUESTION DELETED<br />
<strong>2004</strong> ONWARDS)<br />
IF Vehicle does not use electric/battery<br />
fuel (QVehInt.Fueltyp Electric) AND<br />
Respondent parks on the street or<br />
public highway or elsewhere, at or<br />
near, their home not on the property of<br />
the address (WherePk IN [Street,<br />
Other]) THEN:<br />
HowFar<br />
"^DMVEH[LVLoop]<br />
Approximately how far from the<br />
boundary of your property is the<br />
vehicle usually parked overnight? Is<br />
it... READ OUT<br />
(HELP )"<br />
1. "...right outside,"<br />
2. "not right outside but less than 10<br />
yards/metres away,"<br />
National Centre for Social Research<br />
282<br />
3. "10 yards but less than 100<br />
yards/metres away,"<br />
4. "or 100 yards/metres away or<br />
more?"<br />
5. "(Varies too much to say)"<br />
HowFar (QUESTION DELETED <strong>2004</strong><br />
ONWARDS)<br />
IF Vehicle does not use electric/battery<br />
fuel (QVehInt.Fueltyp Electric) AND<br />
Respondent parks on the street or<br />
public highway or elsewhere, at or<br />
near, their home not on the property of<br />
the address (WherePk IN [Street,<br />
Other]) AND IF Vehicle is parked<br />
between 10 and 100 yards/metres<br />
(HowFar = Less100) away THEN:<br />
HowFar2<br />
"^DMVEH[LVLoop]<br />
@ How many yards/metres away from<br />
the boundary of your property is the<br />
vehicle usually parked?<br />
BOUNDARY OF PROPERTY MEANS<br />
NEAREST ACCESS POINT TO<br />
ROAD<br />
E.G. GATE OR DOOR IF NO<br />
GARDEN<br />
A FORD ESCORT IS ABOUT 5<br />
YARDS LONG"<br />
HowFar2 (QUESTION DELETED<br />
<strong>2004</strong> ONWARDS)<br />
IF Vehicle does not use electric/battery<br />
fuel (QVehInt.Fueltyp Electric) AND<br />
Respondent parks on the street or<br />
public highway or elsewhere, at or<br />
near their home not on the property of<br />
the address (WherePk IN [Street,<br />
Other]) AND IF Vehicle is parked more<br />
than 100 yards/metres away (HowFar<br />
= More100) THEN:<br />
HowFrMin<br />
"^DMVEH[LVLoop]<br />
How long does it take you to walk<br />
from the boundary of your property to<br />
the place where the vehicle is usually<br />
parked?<br />
GIVE THE ANSWER TO THE<br />
NEAREST MINUTE"
HowFrMin(QUESTION DELETED<br />
<strong>2004</strong> ONWARDS)<br />
IF Vehicle does not use electric/battery<br />
fuel (QVehInt.Fueltyp Electric) AND<br />
Respondent parks on the street or<br />
public highway or elsewhere, at or<br />
near, their home not on the property of<br />
the address (WherePk IN [Street,<br />
Other]) THEN:<br />
IfPay<br />
"^DMVEH[LVLoop]<br />
Do you have to make any payment for<br />
parking the vehicle in this place?"<br />
1. "Yes"<br />
2. "No"<br />
IfPay(QUESTION DELETED <strong>2004</strong><br />
ONWARDS)<br />
IF Vehicle does not use electric/battery<br />
fuel (QVehInt.Fueltyp Electric) AND<br />
Respondent parks on the street or<br />
public highway or elsewhere, at or<br />
near, their home not on the property of<br />
the address (WherePk IN [Street,<br />
Other]) AND IF Payment for parking<br />
the vehicle is made (IfPay = Yes)<br />
THEN:<br />
TypePay<br />
"^DMVEH[LVLoop]<br />
What is the payment for?"<br />
1. "Residents parking permit"<br />
2. "Other non-residents parking<br />
permit"<br />
3. "A hired garage"<br />
4. "Something else (SPECIFY)"<br />
TypePay (QUESTION DELETED <strong>2004</strong><br />
ONWARDS)<br />
IF parking payment is for something<br />
else other than residents/other nonresidents<br />
parking permit or a hired<br />
garage (TypePay = Other) THEN:<br />
XTyppay<br />
"^DMVEH[LVLoop]<br />
National Centre for Social Research<br />
283<br />
INTERVIEWER: Describe the type of<br />
payment made for parking the vehicle"<br />
XTyppay (QUESTION DELETED <strong>2004</strong><br />
ONWARDS)<br />
IF Vehicle does not use electric/battery<br />
fuel (QVehInt.Fueltyp Electric) AND<br />
Respondent parks on the street or<br />
public highway or elsewhere, at or<br />
near, their home not on the property of<br />
the address (WherePk IN [Street,<br />
Other]) AND IF Payment for parking<br />
the vehicle is made (IfPay = Yes)<br />
THEN:<br />
Annfee<br />
"^DMVEH[LVLoop]<br />
How much is the @Iannual@I parking<br />
fee that you pay?<br />
INTERVIEWER: ENTER THE<br />
ANNUAL FEE TO THE NEAREST<br />
POUND. IF PAID MONTHLY, WORK<br />
OUT WHAT THIS WOULD BE<br />
ANNUALLY."<br />
Annfee(QUESTION DELETED <strong>2004</strong><br />
ONWARDS)<br />
BComCar / QComCar.NTS<br />
Questions asked if:<br />
QVehNum.Numveh > 0<br />
AND<br />
QTVehTab.QVehTab[LVLoop].Whe<br />
nAcq Aftr<br />
Questions asked of:<br />
Respondent who best knows about<br />
vehicle (normally main driver but not<br />
necessarily)<br />
IF the vehicle does not use<br />
electric/battery fuel (QVehInt.FuelType<br />
Electric) THEN:<br />
HHReg<br />
"^DMVEH[LVLoop]
May I just check, is the<br />
^DMVEH[LVLoop] registered in yours<br />
or another household member's<br />
name?<br />
INTERVIEWER: UNREGISTERED &<br />
YET-TO-BE REGISTERED<br />
VEHICLES SHOULD BE CODED TO<br />
THE APPROPRIATE OWNER."<br />
1. "Yes"<br />
2. "No"<br />
(CHANGED <strong>2004</strong> ONWARDS TO:)<br />
Is the ^DMVEH[LVLoop] registered in<br />
the name of a member of this<br />
household?<br />
INTERVIEWER: UNREGISTERED &<br />
YET-TO-BE REGISTERED<br />
VEHICLES SHOULD BE CODED TO<br />
THE APPROPRIATE OWNER."<br />
1. "Yes"<br />
2. "No"<br />
IF the vehicle does not use<br />
electric/battery fuel (QVehInt.FuelType<br />
Electric) AND IF the vehicle is not<br />
registered in a household member’s<br />
name (HHReg = No) THEN:<br />
OthReg<br />
"SHOW CARD V<br />
^DMVEH[LVLoop]<br />
(May I just check) In whose name is<br />
the ^DMVEH[LVLoop] registered?<br />
Please choose your answer from this<br />
card.<br />
INTERVIEWER: UNREGISTERED &<br />
YET-TO-BE REGISTERED<br />
VEHICLES SHOULD BE CODED TO<br />
THE APPROPRIATE OWNER."<br />
1. "Someone outside household"<br />
2. "Employer/firm for whom<br />
household member works"<br />
3. "Own business"<br />
4. "Other firm or organization"<br />
IF the vehicle does not use<br />
electric/battery fuel (QVehInt.FuelType<br />
Electric) AND IF the vehicle is<br />
registered by someone outside the<br />
household, or the person to whom the<br />
vehicle is registered is unknown<br />
(OthReg = outHH OR OthReg =<br />
National Centre for Social Research<br />
284<br />
DON’T KNOW OR HHReg = DON’T<br />
KNOW) THEN:<br />
WhoOwn<br />
"^DMVEH[LVLoop]<br />
Who owns the vehicle?"<br />
1. "Household member"<br />
2. "Someone outside household"<br />
3. "Employer/firm for whom<br />
household member works"<br />
4. "Own business"<br />
5. "Other firm or organization"<br />
IF the vehicle does not use<br />
electric/battery fuel (QVehInt.FuelType<br />
Electric) AND IF the vehicle is not<br />
registered in a household member’s<br />
name (HHReg = No) AND IF<br />
Someone outside the household owns<br />
the vehicle or the owner is unknown<br />
((WhoOwn = OutHH) OR (WhoOwn =<br />
DONTKNOW)) THEN:<br />
WhyUse<br />
"^DMVEH[LVLoop]<br />
Why do you have use of the vehicle?<br />
INTERVIEWER: INCLUDE AS<br />
'BORROWED', VEHICLES OWNED<br />
BY NON-HOUSEHOLD MEMBER<br />
BUT WHICH ARE AVAILABLE FOR<br />
USE FOR THE WHOLE OF THE<br />
TRAVEL WEEK."<br />
1. "Borrowed"<br />
2. "Other (SPECIFY"<br />
IF Respondent has use of vehicle for a<br />
reason other than the vehicle is<br />
borrowed (WhyUse = Other) THEN:<br />
XWhyUse<br />
"PLEASE SPECIFY OTHER<br />
ANSWER.<br />
TEXT SHOULD BE NO MORE THAN<br />
60 CHARACTERS"<br />
IF the vehicle does not use<br />
electric/battery fuel (QVehInt.FuelType<br />
Electric) AND IF the vehicle is<br />
registered/owned by an employer/firm<br />
for whom the household member<br />
works (OthReg IN [OthFirm} OR<br />
WhoOwn IN [OthFirm]) THEN:<br />
VehHire
"^DMVEH[LVLoop]<br />
Is the vehicle on hire or lease?<br />
IF 'NO' SPECIFY WHY NOT IN A<br />
NOTE"<br />
1. "Yes"<br />
2. "No"<br />
IF the vehicle does not use<br />
electric/battery fuel (QVehInt.FuelType<br />
Electric) AND IF the vehicle is<br />
registered/owned by an employer/firm<br />
for whom the household member<br />
works (OthReg IN [OthFirm} OR<br />
WhoOwn IN [OthFirm]) AND IF the<br />
vehicle is on hire or lease (VehHire =<br />
Yes) THEN:<br />
WhoHire<br />
"^DMVEH[LVLoop]<br />
Who has hired or leased the vehicle?"<br />
1. "Household member"<br />
2. "Employer/firm for whom<br />
household member works"<br />
3. "Own business"<br />
IF the vehicle does not use<br />
electric/battery fuel (QVehInt.FuelType<br />
Electric) AND IF the vehicle is<br />
private (DMPRIVCO = Private) AND<br />
the vehicle is hired/leased by a<br />
household member or it is unknown<br />
who hired/leased the vehicle (WhoHire<br />
= HHMem OR WhoHire = Don’t Know)<br />
THEN:<br />
CostHir<br />
"^DMVEH[LVLoop]<br />
Are any of the costs of hiring or<br />
leasing paid for by the employer of a<br />
member of your household?"<br />
1. "Yes"<br />
2. "No"<br />
IF the vehicle does not use<br />
electric/battery fuel (QVehInt.FuelType<br />
Electric) AND IF the vehicle is<br />
private (DMPRIVCO = Private) AND IF<br />
the vehicle is registered or owned by a<br />
household member (HHReg = Yes OR<br />
WhoOwn IN [Hhmem]) THEN:<br />
VehCost<br />
"^DMVEH[LVLoop]<br />
National Centre for Social Research<br />
285<br />
Were any of the purchase costs of the<br />
vehicle paid for by a firm or<br />
organization?"<br />
1. "Yes"<br />
2. "No"<br />
3. "(Costs paid for by Disability Living<br />
Allowance)"<br />
IF the vehicle does not use<br />
electric/battery fuel (QVehInt.FuelType<br />
Electric) AND IF the vehicle is<br />
private (DMPRIVCO = Private) AND IF<br />
the vehicle is registered or owned by a<br />
household member (HHReg = Yes OR<br />
IF WhoOwn IN [Hhmem]) AND IF the<br />
purchase costs of the vehicle were<br />
paid for by a firm or organisation<br />
(VehCost = Yes) THEN:<br />
ComTax95<br />
"^DMVEH[LVLoop]<br />
For some people, having a vehicle<br />
means that they have to pay company<br />
car tax. Do you have to pay company<br />
car tax?"<br />
1. "Yes"<br />
2. "No"<br />
IF the vehicle does not use<br />
electric/battery fuel (QVehInt.FuelType<br />
Electric) AND ((IF the vehicle is<br />
private (DMPRIVCO = Private) AND<br />
(IF vehicle is registered/owned/leased<br />
or hired by respondent’s own business<br />
(WhoOwn = OwnBus OR OthReg =<br />
OwnBus OR WhoHire = OwnBus)) OR<br />
((IF the purchase costs of the vehicle<br />
are not paid for by a firm or<br />
organisation (or costs paid by<br />
Disability Living Allownace) (VehCost<br />
Yes) OR IF the respondent does<br />
not have to pay company car tax<br />
(ComTax95 = No)) AND IF the<br />
respondent is self-employed (Stat =<br />
SelfEmp)) THEN:<br />
CapAll<br />
"^DMVEH[LVLoop]<br />
(May I check) Can you claim capital<br />
allowances for your vehicle and/or tax
efunds for costs of business<br />
mileage?"<br />
1. "Yes"<br />
2. "No"<br />
IF the vehicle does not use<br />
electric/battery fuel (QVehInt.FuelType<br />
Electric) AND (IF the vehicle is<br />
private (DMPRIVCO = Private) AND IF<br />
the vehicle is 4 wheeled car or a light<br />
van (DMVehType = 4wheel OR<br />
DMVehType = Lightvan) AND IF<br />
respondent is in paid employment<br />
(IchEmp = Yes) AND IF a household<br />
member registered/owns/leases or<br />
hires the vehicle (HHReg = Yes OR<br />
WhoOwn = HHMem OR WhoHire =<br />
HHMem) AND IF Respondent does<br />
not pay company car tax (ComTax95<br />
Yes) OR (IF vehicle is<br />
registered/owned/leased or hired by<br />
respondent’s own business (WhoOwn<br />
= OwnBus OR IF OthReg = OwnBus<br />
OR WhoHire = OwnBus) AND IF<br />
Respondent cannot claim capital<br />
allowances and/or tax refunds for<br />
costs of business mileage (CapAll =<br />
No))) THEN:<br />
CourWk95<br />
"^DMVEH[LVLoop]<br />
(May I check) Do 'you' use the vehicle<br />
in the course of your work?"<br />
1. "Yes"<br />
2. "No"<br />
IF the vehicle does not use<br />
electric/battery fuel (QVehInt.FuelType<br />
Electric) AND IF (the vehicle is<br />
private (DMPRIVCO = Private) AND IF<br />
Vehicle is a 4 wheeled car or a light<br />
van (DMVehType = 4wheel OR IF<br />
DMVehType = Lightvan) AND IF<br />
respondent is in paid employment<br />
(IchEmp = Yes) AND IF a household<br />
member registered/owns/leases or<br />
hires the vehicle (HHReg = Yes OR<br />
WhoOwn = HHMem OR WhoHire =<br />
HHMem) AND IF (the respondent<br />
does not pay company car tax<br />
(ComTax95 Yes) OR IF (vehicle is<br />
registered/owned/leased or hired by<br />
respondent’s own business (WhoOwn<br />
National Centre for Social Research<br />
286<br />
= OwnBus OR OthReg = OwnBus OR<br />
WhoHire = OwnBus) AND IF<br />
Respondent cannot claim capital<br />
allowances and/or tax refunds for<br />
costs of business mileage (CapAll =<br />
No))) AND IF Respondent uses<br />
vehicle in the course of their work<br />
(CourWk95 = Yes)) THEN:<br />
Allow95<br />
"^DMVEH[LVLoop]<br />
For the mileage that 'you' do in the<br />
course of work do 'you' receive...<br />
READ OUT<br />
...a mileage allowance only,<br />
a mileage allowance and some other<br />
allowance,<br />
or do you receive nothing and have to<br />
pay yourself?"<br />
1. "A mileage allowance only"<br />
2. "A mileage allowance and some<br />
other allowance"<br />
3. "Receive nothing and have to pay<br />
yourself?"<br />
4. "Other."<br />
IF Respondent receives another type<br />
of allowance other than a mileage<br />
allowance (Allow95 = OthAll OR<br />
Allow95 = Other) THEN:<br />
XAllow95<br />
"^DMVEH[LVLoop]<br />
INTERVIEWER: PLEASE DESCRIBE<br />
IN DETAIL EXACTLY WHAT KIND OF<br />
ASSISTANCE THE INFORMANT<br />
RECEIVES FOR MILEAGE DONE 'IN<br />
COURSE OF WORK'."<br />
IF the vehicle does not use<br />
electric/battery fuel (QVehInt.FuelType<br />
Electric) AND (IF the vehicle is a<br />
company vehicle (DMPRIVCO =<br />
Company) OR IF (the vehicle is<br />
owned/registered/hired or leased by<br />
the employer/firm for whom the<br />
household member works (WhoOwn =<br />
Firm OR OthReg = Firm OR WhoHire<br />
= Employ) OR IF the respondent pays<br />
company car tax (ComTax95 = Yes)<br />
OR IF (the vehicle is registered by<br />
someone outside the household, or<br />
the person to whom the vehicle is
egistered is unknown (OthReg =<br />
outHH OR OthReg = DON’T KNOW<br />
OR HHReg = DON’T KNOW) AND IF<br />
the vehicle is registered/owned by an<br />
employer/firm for whom the household<br />
member works (OthReg IN [OthFirm}<br />
OR WhoOwn IN [OthFirm]) AND the<br />
vehicle is hired/leased by a household<br />
member or it is unknown who<br />
hired/leased the vehicle (WhoHire =<br />
HHMem OR WhoHire = Don’t Know)<br />
AND IF the costs of hiring or leasing<br />
are paid for by the employer of a<br />
member of your household (CostHir =<br />
Yes)) AND IF the vehicle is a 4<br />
wheeled car or light van (DMVehType<br />
= wheel4 OR DMVehType =<br />
Lightvan))) THEN:<br />
PrivMi95<br />
"^DMVEH[LVLoop]<br />
(May I check) for your private<br />
mileage, including commuting mileage,<br />
do you receive any free fuel?"<br />
1. "Yes"<br />
2. "No"<br />
IF the vehicle does not use<br />
electric/battery fuel (QVehInt.FuelType<br />
Electric) AND (IF the vehicle is a<br />
company vehicle (DMPRIVCO =<br />
Company) OR IF (the vehicle is<br />
owned/registered/hired or leased by<br />
the employer/firm for whom the<br />
household member works (WhoOwn =<br />
Firm OR OthReg = Firm OR WhoHire<br />
= Employ) OR IF the respondent pays<br />
company car tax (ComTax95 = Yes)<br />
OR IF (the vehicle is registered by<br />
someone outside the household, or<br />
the person to whom the vehicle is<br />
registered is unknown (OthReg =<br />
outHH OR OthReg = DON’T KNOW<br />
OR HHReg = DON’T KNOW) AND IF<br />
the vehicle is registered/owned by an<br />
employer/firm for whom the household<br />
member works (OthReg IN [OthFirm}<br />
OR WhoOwn IN [OthFirm]) AND the<br />
vehicle is hired/leased by a household<br />
member or it is unknown who<br />
hired/leased the vehicle (WhoHire =<br />
HHMem OR WhoHire = Don’t Know)<br />
AND IF the costs of hiring or leasing<br />
are paid for by the employer of a<br />
National Centre for Social Research<br />
287<br />
member of your household (CostHir =<br />
Yes)) AND IF the vehicle is a 4<br />
wheeled car or light van (DMVehType<br />
= wheel4 OR DMVehType =<br />
Lightvan))) AND IF Respondent<br />
receives free fuel for their private<br />
mileage (PrivMi95 = Yes) THEN:<br />
FTax95<br />
"^DMVEH[LVLoop]<br />
(May I check) do you pay the tax on<br />
free fuel?"<br />
1. "Yes"<br />
2. "No"<br />
BMILEAG / QMileag.NTS<br />
Questions asked if:<br />
QVehNum.Numveh > 0<br />
AND<br />
QTVehTab.QVehTab[LVLoop].Whe<br />
nAcq Aftr<br />
Questions asked of :<br />
Respondent who best knows about<br />
vehicle (normally main driver but not<br />
necessarily)<br />
IF the vehicle does not use<br />
electric/battery fuel (QVehInt.FuelType<br />
Electric) THEN:<br />
AnMiles<br />
"^DMVEH[LVLoop]<br />
I would like to get a figure for the<br />
approximate annual mileage of the<br />
^DMVEH[LVLoop]. Can you please<br />
estimate for me the total miles the<br />
vehicle has been driven in the last 12<br />
months, (that is since ^DLYearTxt)?<br />
INTERVIEWER: IF DK ENCOURAGE<br />
ESTIMATE.<br />
IF NECESSARY OBTAIN TO<br />
NEAREST THOUSAND.<br />
OBTAIN EXPECTED MILEAGE IF<br />
VEHICLE ACQUIRED LESS THAN A<br />
YEAR AGO.<br />
IF NIL ENTER 0"
IF the vehicle does not use<br />
electric/battery fuel (QVehInt.FuelType<br />
Electric) AND IF Respondent does<br />
not know the total number of miles<br />
their vehicle has been driven in the<br />
last 12 months (AnMiles = Don’t<br />
Know) THEN:<br />
BAnMiles<br />
"SHOW CARD W<br />
^DMVEH[LVLoop]<br />
Taking your answer from this card,<br />
approximately how many<br />
MILES has this vehicle been driven in<br />
the last 12 months, (that is since<br />
^DLYearTxt)?<br />
INTERVIEWER: IF DK ENCOURAGE<br />
ESTIMATE. OBTAIN EXPECTED<br />
MILEAGE IF VEHICLE ACQUIRED<br />
LESS THAN A YEAR AGO."<br />
1. "0 - 499 miles"<br />
2. "500 - 999 miles"<br />
3. "1,000 - 1,999 miles"<br />
4. "2,000 - 2,999 miles"<br />
5. "3,000 - 3,999 miles"<br />
6. "4,000 - 4,999 miles"<br />
7. "5,000 - 6,999 miles"<br />
8. "7,000 - 8,999 miles"<br />
9. "9,000 - 11,999 miles"<br />
10. "12,000 - 14,999 miles"<br />
11. "15,000 - 17,999 miles"<br />
12. "18,000 - 20,999 miles"<br />
13. "21,000 - 29,999 miles"<br />
14. "30,000 miles and over"<br />
IF the vehicle does not use<br />
electric/battery fuel (QVehInt.FuelType<br />
Electric) AND IF Respondent has<br />
given the annual mileage of their<br />
vehicle (AnMiles = RESPONSE AND<br />
AnMiles > 0) THEN:<br />
KmOrMile<br />
"^DMVEH[LVLoop]<br />
INTERVIEWER ASK OR CODE:<br />
WAS THE ANSWER TO 'AnMiles' IN<br />
MILES OR KILOMETRES?"<br />
1. "Miles"<br />
2. "Kilometres"<br />
National Centre for Social Research<br />
288<br />
IF the vehicle does not use<br />
electric/battery fuel (QVehInt.FuelType<br />
Electric) AND IF Respondent is<br />
employed (QVehNum.IchEmp = Yes)<br />
and the Respondent has given the<br />
annual mileage of their vehicle<br />
(AnMiles = RESPONSE AND AnMiles<br />
> 0) and the respondent has given<br />
their annual mileage in miles OR IF<br />
(the Respondent has a 4 wheeled car<br />
or a light van and they have not given<br />
their annual mileage) (DMVEHTYPE =<br />
Wheel4 OR DMVEHTYPE = LightVan<br />
AND (AnMiles RESPONSE OR<br />
KMORMILE RESPONSE)) THEN:<br />
UsualWk<br />
"^DMVEH[LVLoop]<br />
Can you please estimate how many of<br />
the total annual miles, if any, are<br />
driven by anyone in the household in<br />
getting to or from a usual place of<br />
work, either all of the way or part of the<br />
way?<br />
IF NIL ENTER 0"<br />
IF the vehicle does not use<br />
electric/battery fuel (QVehInt.FuelType<br />
Electric) AND IF Respondent is<br />
employed (QVehNum.IchEmp = Yes)<br />
AND IF the respondent has given their<br />
annual mileage in kilometers<br />
(KmOrMile = Km) THEN:<br />
UsualKm<br />
"^DMVEH[LVLoop]<br />
Can you please estimate how many of<br />
the total annual kilometres, if any, are<br />
driven by anyone in the household in<br />
getting to or from a usual place of<br />
work, either all of the way or part of the<br />
way?<br />
IF NIL ENTER 0"
IF the vehicle does not use<br />
electric/battery fuel (QVehInt.FuelType<br />
Electric) AND IF Respondent is<br />
employed (QVehNum.IchEmp = Yes)<br />
and the Respondent has given the<br />
annual mileage of their vehicle<br />
(AnMiles = RESPONSE AND AnMiles<br />
> 0) and the respondent has given<br />
their annual mileage in miles OR IF<br />
(the Respondent has a 4 wheeled car<br />
or a light van and they have not given<br />
their annual mileage) (DMVEHTYPE =<br />
Wheel4 OR DMVEHTYPE = LightVan<br />
AND (AnMiles RESPONSE OR<br />
KMORMILE RESPONSE)) THEN:<br />
CoursWk<br />
"^DMVEH[LVLoop]<br />
Leaving aside these journeys, can<br />
you estimate how many of the total<br />
annual miles, if any, are driven by<br />
anyone in the household in the course<br />
of work?<br />
IF NIL ENTER 0"<br />
IF the vehicle does not use<br />
electric/battery fuel (QVehInt.FuelType<br />
Electric) AND IF Respondent is<br />
employed (QVehNum.IchEmp = Yes)<br />
AND IF the respondent has given their<br />
annual mileage in kilometers<br />
(KmOrMile = Km) THEN:<br />
CoursKm<br />
"^DMVEH[LVLoop]<br />
Leaving aside these journeys, can<br />
you estimate how many of the total<br />
annual kilometres, if any, are driven by<br />
anyone in the household in the course<br />
of work?<br />
IF NIL ENTER 0"<br />
IF the vehicle does not use<br />
electric/battery fuel (QVehInt.FuelType<br />
Electric) AND IF (Respondent is<br />
employed (QVehNum.IchEmp = Yes)<br />
and the Respondent has given the<br />
annual mileage of their vehicle<br />
(AnMiles = RESPONSE AND AnMiles<br />
> 0) and the respondent has given<br />
their annual mileage in miles OR IF<br />
(the Respondent has a 4 wheeled car<br />
National Centre for Social Research<br />
289<br />
or a light van and they have not given<br />
their annual mileage) (DMVEHTYPE =<br />
Wheel4 OR DMVEHTYPE = LightVan<br />
AND (AnMiles RESPONSE OR<br />
KMORMILE RESPONSE))) AND IF<br />
Respondent indicates that some of the<br />
annual mileage is driven in the course<br />
of work (CoursWk = RESPONSE AND<br />
(CoursWk > 0) THEN:<br />
GoodsWk<br />
"^DMVEH[LVLoop]<br />
And can you estimate how many of<br />
these ^CoursWk miles are driven by<br />
anyone in the household whilst<br />
carrying goods in the course of work?<br />
IF NIL ENTER 0"<br />
IF the vehicle does not use<br />
electric/battery fuel (QVehInt.FuelType<br />
Electric) AND IF Respondent is<br />
employed (QVehNum.IchEmp = Yes)<br />
AND IF the respondent has given their<br />
annual mileage in kilometers<br />
(KmOrMile = Km) AND Respondent<br />
indicates that some of the annual<br />
mileage is driven in the course of work<br />
(CoursKm = RESPONSE AND<br />
CoursKm > 0) THEN::<br />
GoodsKM<br />
"^DMVEH[LVLoop]<br />
And can you estimate how many of<br />
these ^Courskm kilometres are driven<br />
by anyone in the household whilst<br />
carrying goods in the course of work?<br />
IF NIL ENTER 0"<br />
IF the vehicle does not use<br />
electric/battery fuel (QVehInt.FuelType<br />
Electric) AND IF Respondent is<br />
employed (QVehNum.IchEmp = Yes)<br />
and the Respondent has given the<br />
annual mileage of their vehicle<br />
(AnMiles = RESPONSE AND AnMiles<br />
> 0) and the respondent has given<br />
their annual mileage in miles OR IF<br />
(the Respondent has a 4 wheeled car<br />
or a light van and they have not given<br />
their annual mileage) (DMVEHTYPE =<br />
Wheel4 OR DMVEHTYPE = LightVan<br />
AND (AnMiles RESPONSE OR<br />
KMORMILE RESPONSE)) AND (IF<br />
the respondent has given the annual
mileage of their vehicle (AnMile =<br />
RESPONSE) AND IF the respondent<br />
has given their vehicle’s annual<br />
mileage to and from work (UsualWk =<br />
RESPONSE) AND IF the respondent<br />
has given their annual mileage in the<br />
course of work (CoursWk =<br />
RESPONSE) AND IF their annual<br />
mileage is more than or equal to their<br />
annual mileage to and from work and<br />
in the course of work (AnMiles >=<br />
UsualWk + CoursWk)) THEN:<br />
OthMile<br />
"^DMVEH[LVLoop]<br />
So that means that the vehicle is<br />
driven about ^OtherM miles a year for<br />
all other journeys?<br />
PRESS IF THE NUMBER<br />
SHOWN IS CORRECT, OR CHANGE<br />
TO THE CORRECT NUMBER.<br />
INTERVIEWER: IF THE NUMBER IS<br />
CHANGED IT WILL BRING UP AN<br />
ERROR MESSAGE - YOU WILL<br />
NEED TO MODIFY PREVIOUS<br />
ANSWERS"<br />
IF the vehicle does not use<br />
electric/battery fuel (QVehInt.FuelType<br />
Electric) AND IF Respondent is<br />
employed (QVehNum.IchEmp = Yes)<br />
AND IF the respondent has given their<br />
annual mileage in kilometers<br />
(KmOrMile = Km) AND IF the<br />
respondent has given the annual<br />
mileage of their vehicle (AnMile =<br />
RESPONSE) AND IF the respondent<br />
has given their vehicle’s annual<br />
kilometres to and from work (UsualKm<br />
= RESPONSE) AND IF the<br />
respondent has given their annual<br />
kilometres in the course of work<br />
(CoursKm = RESPONSE) AND IF<br />
their annual mileage (in kilometres) is<br />
more than or equal to their annual<br />
kilometres to and from work and in the<br />
course of work (AnMiles >= UsualKm<br />
+ CoursKm) THEN:<br />
Othkm<br />
"^DMVEH[LVLoop]<br />
So that means that the vehicle is<br />
driven about ^otherkm kilometres a<br />
year for all other journeys.<br />
National Centre for Social Research<br />
290<br />
PRESS ENTER IF THE NUMBER<br />
SHOWN IS CORRECT OR CHANGE<br />
TO THE CORRECT NUMBER<br />
INTERVIEWER: IF THE ANSWER IS<br />
CHANGED IT WILL BRING UP AN<br />
ERROR MESSAGE - YOU WILL<br />
NEED TO MODIFY PREVIOUS<br />
ANSWERS."<br />
IF the vehicle does not use<br />
electric/battery fuel (QVehInt.FuelType<br />
Electric) THEN:<br />
Deliver<br />
"^DMVEH[LVLoop]<br />
May I check, is this vehicle ever used<br />
by anyone in the household to deliver<br />
goods in the course of work?<br />
INCLUDE VEHICLES WHOSE<br />
PRIMARY PURPOSE IS THE<br />
DELIVERY OF GOODS EG PARCEL,<br />
NEWSPAPER OR OTHER ROUNDS.<br />
INCLUDE VEHICLES USED<br />
OCCASIONALLY TO DELIVER<br />
GOODS TO CUSTOMERS AND/OR<br />
WORK COLLEAGUES EG<br />
DELIVERIES TO CUSTOMERS<br />
FROM SMALL BUSINESS,<br />
CARRYING<br />
EQUIPMENT TO A WORKSITE FOR<br />
OTHERS<br />
EXCLUDE TOOLS OR EQUIPMENT<br />
CARRIED BY THE DRIVER FOR<br />
THEIR OWN JOB EG PLUMBER OR<br />
GARDENER CARRYING TOOLS TO<br />
UNDERTAKE WORK AT<br />
CUSTOMER'S PREMISES"<br />
1. "Yes"<br />
2. "No"<br />
IF the vehicle does not use<br />
electric/battery fuel (QVehInt.FuelType<br />
Electric) AND IF Vehicle is used to<br />
deliver goods in the course of work<br />
(Deliver = Yes) THEN:<br />
HowOft<br />
"^DMVEH[LVLoop]<br />
How often is this vehicle used to<br />
deliver goods?"<br />
1. "3 or more times a week"<br />
2. "Once or twice a week"
3. "Less than that but more than<br />
twice a month"<br />
4. "Once or twice a month"<br />
5. "Less than that but more than<br />
twice a year"<br />
6. "Once or twice a year"<br />
7. "Less than that"<br />
IF the vehicle does not use<br />
electric/battery fuel (QVehInt.FuelType<br />
Electric) AND IF Vehicle is used to<br />
deliver goods in the course of work<br />
(Deliver = Yes) THEN:<br />
NumTrips<br />
"^DMVEH[LVLoop]<br />
How many times did the vehicle stop<br />
to deliver goods on the most recent<br />
day the vehicle was used for<br />
deliveries?<br />
WE ARE INTERESTED IN THE<br />
NUMBER OF DROP OFF POINTS<br />
NOT THE NUMBER OF TIMES THE<br />
VEHICLE WENT OUT<br />
INTERVIEWER: IF DK ENCOURAGE<br />
ESTIMATE."<br />
1. "1"<br />
2. "2 to 4 times"<br />
3. "5 to 9 times"<br />
4. "10 to 19 times"<br />
5. "20 or more times"<br />
Module A IF the vehicle does not use<br />
electric/battery fuel (QVehInt.FuelType<br />
Electric) THEN:<br />
OutGB<br />
"^DMVEH[LVLoop]<br />
Has the vehicle been driven<br />
OUTSIDE of Great Britain in the last<br />
year, (that is since ^DLYearTxt), by<br />
anyone in the household? (HELP<br />
)<br />
INCLUDE TRAVEL IN NORTHERN<br />
IRELAND, THE ISLE OF MAN &<br />
CHANNEL ISLANDS"<br />
1. "Yes"<br />
2. "No"<br />
Module A IF the vehicle does not use<br />
electric/battery fuel (QVehInt.FuelType<br />
National Centre for Social Research<br />
291<br />
Electric) AND IF respondent’s<br />
vehicle has been driven outside Great<br />
Britain in the last year (OutGB = Yes)<br />
THEN:<br />
MileGB<br />
"^DMVEH[LVLoop]<br />
What was the vehicle's total mileage<br />
OUTSIDE GB on the last trip that was<br />
made?<br />
INCLUDE MILEAGE REGARDLESS<br />
OF WHO WAS DRIVING, INCLUDE<br />
MILEAGE IN NORTHERN IRELAND,<br />
THE ISLE OF MAN & CHANNEL<br />
ISLANDS"<br />
Module A IF the vehicle does not use<br />
electric/battery fuel (QVehInt.FuelType<br />
Electric) AND IF respondent’s<br />
vehicle has been driven outside Great<br />
Britain in the last year (OutGB = Yes)<br />
THEN:<br />
PurpGB<br />
"^DMVEH[LVLoop]<br />
What was the main purpose of the<br />
trip?"<br />
1. "A holiday"<br />
2. "A business trip"<br />
3. "A shopping trip"<br />
4. "Visiting friends or relations"<br />
5. "Another reason"<br />
Module A IF there is another reason,<br />
other than holiday, business, shopping<br />
or visiting friends or relations, for the<br />
vehicle being driven outside Great<br />
Britain (PurpGB = Other) THEN:<br />
OthPurp<br />
"^DMVEH[LVLoop]<br />
What was the reason for the trip?"<br />
Module A IF the vehicle does not use<br />
electric/battery fuel (QVehInt.FuelType<br />
Electric) THEN:<br />
OutNI<br />
"^DMVEH[LVLoop]<br />
Has the vehicle been driven in<br />
Northern Ireland in the last year, (that<br />
is since ^DLYearTxt), by anyone in the<br />
household?"
1. "Yes"<br />
2. "No"<br />
Module A IF the vehicle does not use<br />
electric/battery fuel (QVehInt.FuelType<br />
Electric) AND the vehicle has been<br />
driven in Northern Ireland in the last<br />
year (OutNI = Yes) THEN:<br />
MileNI<br />
"^DMVEH[LVLoop]<br />
What was the vehicle's total mileage<br />
in Northern Ireland on the last trip that<br />
was made.<br />
INCLUDE MILEAGE REGARDLESS<br />
OF WHO WAS DRIVING"<br />
Moduel A IF the vehicle does not use<br />
electric/battery fuel (QVehInt.FuelType<br />
Electric) AND the vehicle has been<br />
driven in Northern Ireland in the last<br />
year (OutNI = Yes) THEN<br />
PurpNI<br />
"^DMVEH[LVLoop]<br />
What was the main purpose of the<br />
trip?"<br />
1. "A holiday"<br />
2. "A business trip"<br />
3. "A shopping trip"<br />
4. "Visiting friends or relations"<br />
5. "Another reason"<br />
Module A IF the vehicle does not use<br />
electric/battery fuel (QVehInt.FuelType<br />
Electric) AND IF respondent’s<br />
vehicle has been driven in Northern<br />
Ireland in the last year (OutNI = Yes)<br />
AND IF there is another reason, other<br />
than holiday, business, shopping or<br />
visiting friends or relations, for the<br />
vehicle being driven in Northern<br />
Ireland (PurpNI = Other) THEN:<br />
NIOther<br />
"^DMVEH[LVLoop]<br />
What was the reason for the trip?"<br />
IF the vehicle does not use<br />
electric/battery fuel (QVehInt.FuelType<br />
National Centre for Social Research<br />
292<br />
Electric) THEN<br />
SecCyc<br />
"^DMVEH[LVLoop]<br />
(May I just check) Is the milometer on<br />
its second cycle, in other words has it<br />
reached its maximum figure and been<br />
through zero again?"<br />
1. "Yes"<br />
2. "No"<br />
IF the vehicle does not use<br />
electric/battery fuel (QVehInt.FuelType<br />
Electric) THEN<br />
MiloRep<br />
"^DMVEH[LVLoop]<br />
Has the milometer been replaced<br />
since the vehicle was new?<br />
^LPUTxt"<br />
1. "Yes"<br />
2. "No"<br />
Vehicle Pick Up Interviw<br />
TVPickU / QTVPickU.NTS<br />
BVPickU<br />
Questions asked if:<br />
QSignIn.StatusQ = PickUp<br />
AND<br />
QTVehTab.QVehTab[LVLoop].Whe<br />
nAcq Aftr<br />
AND<br />
[QTVehtab.QVehTab[LTLooper].Wh<br />
enDIS Bfore<br />
OR<br />
QTVehtab.QVehTab[LTLooper].Still<br />
Got = Yes
ASK ALWAYS<br />
FuelNow<br />
"^DMVEH[LTLooper]<br />
INTERVIEWER: DO YOU WANT TO<br />
COMPLETE THE FUEL GAUGE<br />
DETAILS NOW OR LATER?<br />
IF THE FIRST OR LAST GAUGE<br />
READING WAS 'FULL' OR 'EMPTY',<br />
YOU MUST CODE 'NOW' AS YOU<br />
WILL NEED TO ASK SOME EXTRA<br />
QUESTIONS.<br />
^LFuelTxt"<br />
1. "Now"<br />
2. "Later"<br />
ASK ALWAYS<br />
VFuelNow<br />
"SECURITY COPY"<br />
1. "Now"<br />
2. "Later"<br />
IF Respondent would like to complete<br />
the fuel gauge details now (FuelNow =<br />
Now) THEN:<br />
AnyFuel<br />
"^DMVEH[LTLooper]<br />
INTERVIEWER: CHECK FUEL GRID<br />
IN FUEL AND MILEAGE CHART,<br />
AND CODE WHETHER ANY FUEL<br />
WAS PUT IN TANK IN TRAVEL<br />
WEEK"<br />
1. "Fuel put in"<br />
2. "No fuel put in"<br />
IF Respondent would like to complete<br />
the fuel gauge details now (FuelNow =<br />
Now) AND IF any fuel was put in the<br />
tank during the Travel Week (AnyFuel<br />
= FuelIn) THEN:<br />
IntQust1<br />
"^DMVEH[LTLooper]<br />
INTERVIEWER: IN THE NEXT<br />
QUESTIONS CODE THE TOTAL<br />
QUANTITY PUT IN AND CHECK<br />
TOTAL WITH RESPONDENT.<br />
FIRST CODE IF AMOUNT IN LITRES<br />
OR GALLONS"<br />
National Centre for Social Research<br />
293<br />
1. "Litres"<br />
2. "Gallons"<br />
IF Respondent would like to complete<br />
the fuel gauge details now (FuelNow =<br />
Now) AND IF any fuel was put in the<br />
tank during the Travel Week (AnyFuel<br />
= FuelIn) AND IF Fuel quantity is<br />
entered in litres (IntQust1 = Litres)<br />
THEN:<br />
FuelLtr<br />
"^DMVEH[LTLooper]<br />
QUANTITY OF FUEL PUT IN, IN<br />
LITRES (TO NEAREST WHOLE<br />
LITRE)"<br />
IF Respondent would like to complete<br />
the fuel gauge details now (FuelNow =<br />
Now) AND IF any fuel was put in the<br />
tank during the Travel Week (AnyFuel<br />
= FuelIn) AND IF Fuel quantity is<br />
entered in gallons (InQust1 = gallons)<br />
THEN:<br />
FuelGal<br />
"^DMVEH[LTLooper]<br />
QUANTITY OF FUEL PUT IN, IN<br />
GALLONS (TO ONE DECIMAL<br />
POINT)"<br />
IF Respondent would like to complete<br />
the fuel gauge details now (FuelNow =<br />
Now) AND IF any fuel was put in the<br />
tank during the Travel Week (AnyFuel<br />
= FuelIn) THEN:<br />
FuelPds<br />
"^DMVEH[LTLooper]<br />
ENTER AMOUNT HOUSEHOLD<br />
PAID IN POUNDS AND PENCE FOR<br />
THIS FUEL AND CHECK SUM WITH<br />
RESPONDENT"<br />
IF Respondent would like to complete<br />
the fuel gauge details now (FuelNow =<br />
Now) THEN:<br />
FGauge<br />
"^DMVEH[LTLooper]<br />
CHECK FIRST FUEL GAUGE<br />
READING ON FUEL AND MILEAGE<br />
CHART.
'FIRST' FUEL READING WAS:"<br />
1. "Recorded from fuel gauge"<br />
2. "Estimated (including when fuel<br />
gauge faulty or absent)"<br />
3. "Not Available"<br />
IF Respondent would like to complete<br />
the fuel gauge details now (FuelNow =<br />
Now) AND IF First fuel reading was<br />
recorded from fuel gauge or estimated<br />
(FGauge IN [Gauge..Estim]) THEN:<br />
FFGRead<br />
"^DMVEH[LTLooper]<br />
ENTER 'FIRST' FUEL GAUGE<br />
READING (enter box no.)"<br />
IF Respondent would like to complete<br />
the fuel gauge details now (FuelNow =<br />
Now) THEN:<br />
LGauge<br />
"^DMVEH[LTLooper]<br />
CHECK LAST FUEL GAUGE<br />
READING ON FUEL AND MILEAGE<br />
CHART. 'LAST' FUEL READING<br />
WAS:"<br />
1. "Recorded from fuel gauge"<br />
2. "Estimated (including when fuel<br />
gauge faulty or absent)"<br />
3. "Not Available"<br />
IF Respondent would like to complete<br />
the fuel gauge details now (FuelNow =<br />
Now) AND IF Last fuel reading was<br />
recorded from fuel gauge or estimated<br />
(LGauge IN [Gauge..Estim]) THEN:<br />
LFGRead<br />
"^DMVEH[LTLooper]<br />
ENTER LAST FUEL GAUGE<br />
READING (enter box no.)"<br />
IF Respondent would like to complete<br />
the fuel gauge details now (FuelNow =<br />
Now) AND IF First fuel reading was<br />
recorded from fuel gauge or estimated<br />
(LGauge IN [Gauge..Estim]) AND IF<br />
Fuel gauge reads ‘9’ (Full) (FFGRead<br />
= 9) THEN:<br />
StikFul<br />
National Centre for Social Research<br />
294<br />
"^DMVEH[LTLooper]<br />
(This may not apply to your vehicle<br />
but in some vehicles the fuel gauge<br />
indicator tends to stick for a while at<br />
'full').<br />
I notice that your fuel gauge reading<br />
shows that your fuel tank was 'full' or<br />
'nearly full' at the start of your Travel<br />
Week.<br />
Do you remember - had you driven for<br />
20 miles or more without the needle<br />
changing position?"<br />
1. "Yes"<br />
2. "No"<br />
3. "DK/Can't remember"<br />
IF Respondent would like to complete<br />
the fuel gauge details now (FuelNow =<br />
Now) AND IF Fuel gauge reads ‘1’<br />
(Empty) (FFGRead = 1) THEN:<br />
Stikem1<br />
"^DMVEH[LTLooper]<br />
(In some vehicles the fuel gauge<br />
indicator shows 'empty' when there is<br />
still quite a lot of fuel in the tank.)<br />
I notice that your tank was 'empty' or<br />
'nearly empty' at the start of your<br />
Travel Week. So far as you can<br />
remember, was there enough fuel left<br />
to do at least another 20 miles?"<br />
1. "Yes"<br />
2. "No"<br />
3. "DK/Can't remember"<br />
IF Respondent would like to complete<br />
the fuel gauge details now (FuelNow =<br />
Now) AND IF Fuel gauge reads ‘9’<br />
(Full) (LFGRead = 9) THEN:<br />
StikFu2<br />
"^DMVEH[LTLooper]<br />
(This may not apply to your vehicle<br />
but in some vehicles the fuel gauge<br />
indicator tends to stick for a while at<br />
'full').<br />
I notice that your fuel gauge reading<br />
shows that your fuel tank was 'full' or<br />
'nearly full' at the end of your Travel<br />
Week. Do you remember - had you<br />
driven for 20 miles or more without the<br />
needle changing position?"<br />
1. "Yes"
2. "No"<br />
3. "DK/Can't remember"<br />
IF Respondent would like to complete<br />
the fuel gauge details now (FuelNow =<br />
Now) AND IF Fuel gauge reads ‘1’<br />
(Empty) (LFGRead = 1) THEN:<br />
StikEm2<br />
"^DMVEH[LTLooper]<br />
(In some vehicles the fuel gauge<br />
indicator shows 'empty' when there is<br />
still quite a lot of fuel in the tank.)<br />
I notice that your tank was 'empty' or<br />
'nearly empty' at the end of your Travel<br />
Week. So far as you can remember,<br />
was there enough fuel left to do at<br />
least another 20 miles?"<br />
1. "Yes"<br />
2. "No"<br />
3. "DK/Can't remember"<br />
ASK ALWAYS<br />
FMilo<br />
"^DMVEH[LTLooper]<br />
CHECK MILOMETER READING IN<br />
FUEL AND MILEAGE CHART. 'FIRST'<br />
MILOMETER READING WAS:"<br />
1. "Recorded from milometer"<br />
2. "Estimated"<br />
3. "Not available"<br />
ASK ALWAYS<br />
IntQust2<br />
"^DMVEH[LTLooper]<br />
INTERVIEWER: FOR THE NEXT<br />
QUESTIONS YOU NEED TO CODE<br />
THE MILOMETER READING FROM<br />
THE FUEL AND MILEAGE CHART.<br />
ENTER WHETHER THE READING IS<br />
IN MILES OR KILOMETRES"<br />
1. "Miles"<br />
2. "kilometres"<br />
IF First milometer reading was<br />
recorded from milometer or estimated<br />
(FMilo IN [Recorded..Estimated]) AND<br />
IF Milometer reading is in miles<br />
(IntQust2 = Miles) THEN:<br />
National Centre for Social Research<br />
295<br />
MilesF<br />
"^DMVEH[LTLooper]<br />
ENTER THE 'FIRST' MILEAGE (TO<br />
THE NEAREST WHOLE MILE)"<br />
IF First milometer reading was<br />
recorded from milometer or estimated<br />
(FMilo IN [Recorded..Estimated]) AND<br />
IF Milometer reading is in kilometers<br />
(IntQust2 = Km) THEN:<br />
KmF<br />
"^DMVEH[LTLooper]<br />
ENTER THE 'FIRST' READING IN<br />
KILOMETRES (TO THE NEAREST<br />
WHOLE KILOMETRE)"<br />
ASK ALWAYS<br />
LMilo<br />
"^DMVEH[LTLooper]<br />
LAST MILOMETER READING WAS:"<br />
1. "Recorded from milometer"<br />
2. "Estimated"<br />
3. "Not available"<br />
IF Last milometer reading was<br />
recorded from milometer or estimated<br />
(LMilo IN [Recorded..Estimated]) AND<br />
IF Milometer reading is in miles<br />
(IntQust2 = Miles) THEN:<br />
MilesL<br />
"^DMVEH[LTLooper]<br />
ENTER THE 'LAST' MILEAGE (TO<br />
THE NEAREST WHOLE MILE)"<br />
IF Last milometer reading was<br />
recorded from milometer or estimated<br />
(LMilo IN [Recorded..Estimated]) AND<br />
IF Milometer reading is in kilometres<br />
(IntQust2 = kilometres) THEN:<br />
KmL<br />
"^DMVEH[LTLooper]<br />
ENTER THE 'LAST' READING IN<br />
KILOMETRES (TO THE NEAREST<br />
WHOLE KILOMETRE)"
IF Respondent gave first mileage<br />
reading AND IF the first mileage<br />
reading is equal to the last mileage<br />
reading (MilesF = RESPONSE AND<br />
MilesF = MilesL) OR IF Respondent<br />
gave first kilometre reading AND the<br />
first kilometer reading is equal to the<br />
last kilometre reading (KmF =<br />
RESPONSE AND KmF = KmL) THEN:<br />
WhyNUse<br />
"^DMVEH[LTLooper]<br />
Why was the vehicle not used during<br />
the Travel Week?<br />
CODE FIRST THAT APPLIES.<br />
ENTER THE RESPONSE AND<br />
PRESS TO GO TO THE<br />
NEXT PICK-UP QUESTION (OR THE<br />
END OF THE QUESTIONNIARE IF<br />
THERE ARE NO MORE VEHICLES)"<br />
1. "Vehicle not insured/not taxed"<br />
2. "Vehicle being repaired/serviced"<br />
3. "Driver sick/on holiday"<br />
4. "Driver disqualified"<br />
5. "Vehicle not in everyday use"<br />
97. "Other (SPECIFY)"<br />
IF ‘other’ reason is given for vehicle<br />
not being used during the Travel Week<br />
(WhyNUse = Other) THEN:<br />
XWhyNUse<br />
"^DMVEH[LTLooper]<br />
PLEASE SPECIFY OTHER ANSWER.<br />
TEXT SHOULD BE NO MORE THAN<br />
60 CHARACTERS"<br />
IF the last mileage reading is greater<br />
than the first mileage reading OR IF<br />
the last kilometre reading is greater<br />
than the first kilometre reading (MilesL<br />
> MilesF OR KmL > KmF) THEN:<br />
InElm1<br />
"^DMVEH[LTLooper]<br />
May I just check:<br />
Were any of the ^LVPickU1<br />
^LVPickU2 driven by someone outside<br />
the household?"<br />
1. "Yes"<br />
2. "No"<br />
National Centre for Social Research<br />
296<br />
IF the last mileage reading is greater<br />
than the first mileage reading OR IF<br />
the last kilometre reading is greater<br />
than the first kilometre reading (MilesL<br />
> MilesF OR KmL > KmF) AND IF the<br />
vehicle was driven by someone<br />
outside the household (InElm1 = Yes)<br />
THEN:<br />
InElmA1<br />
"^DMVEH[LTLooper]<br />
How many ^LVPickU2 were driven by<br />
someone outside the household?"<br />
IF the last mileage reading is greater<br />
than the first mileage reading OR IF<br />
the last kilometre reading is greater<br />
than the first kilometre reading (MilesL<br />
> MilesF OR KmL > KmF) THEN:<br />
InElm2<br />
"^DMVEH[LTLooper]<br />
(Were any of the ^LVPickU1<br />
^LVPickU2 driven in order) to carry<br />
goods in the course of work?"<br />
1. "Yes"<br />
2. "No"<br />
IF the last mileage reading is greater<br />
than the first mileage reading OR IF<br />
the last kilometre reading is greater<br />
than the first kilometre reading (MilesL<br />
> MilesF OR KmL > KmF) AND IF the<br />
vehicle was driven to carry goods in<br />
the course of work (InElm2 = Yes)<br />
THEN:<br />
InElmA2<br />
"^DMVEH[LTLooper]<br />
How many ^LVPickU2 were driven in<br />
order to carry goods in the course of<br />
work?"
IF the last mileage reading is greater<br />
than the first mileage reading OR IF<br />
the last kilometre reading is greater<br />
than the first kilometre reading (MilesL<br />
> MilesF OR KmL > KmF) THEN:<br />
InElm3<br />
"^DMVEH[LTLooper]<br />
(Were any of the ^LVPickU1<br />
^LVPickU2 driven) off the public<br />
road?"<br />
1. "Yes"<br />
2. "No"<br />
IF the last mileage reading is greater<br />
than the first mileage reading OR IF<br />
the last kilometre reading is greater<br />
than the first kilometre reading (MilesL<br />
> MilesF OR KmL > KmF) AND IF the<br />
vehicle was driven off the public road<br />
(InElm3 = Yes) THEN:<br />
InElmA3<br />
"^DMVEH[LTLooper]<br />
How many ^LVPickU2 were driven off<br />
the public road?"<br />
IF the last mileage reading is greater<br />
than the first mileage reading OR IF<br />
the last kilometre reading is greater<br />
than the first kilometre reading (MilesL<br />
> MilesF OR KmL > KmF) THEN:<br />
InElm4<br />
"^DMVEH[LTLooper]<br />
(Were any of the ^LVPickU1<br />
^LVPickU2 driven) outside Great<br />
Britain?"<br />
1. "Yes"<br />
2. "No"<br />
IF the last mileage reading is greater<br />
than the first mileage reading OR IF<br />
the last kilometre reading is greater<br />
than the first kilometre reading (MilesL<br />
> MilesF OR KmL > KmF) AND IF the<br />
vehicle was driven outside Great<br />
Britain (InElm4 = Yes) THEN:<br />
InElmA4<br />
"^DMVEH[LTLooper]<br />
How many ^LVPickU2 were driven<br />
outside Great Britain?"<br />
National Centre for Social Research<br />
297<br />
IF the last mileage reading is greater<br />
than the first mileage reading OR IF<br />
the last kilometre reading is greater<br />
than the first kilometre reading (MilesL<br />
> MilesF OR KmL > KmF) THEN:<br />
InElm5<br />
"^DMVEH[LTLooper]<br />
(Were any of the ^LVPickU1<br />
^LVPickU2 driven) using the vehicle<br />
as a taxi or hire car?"<br />
1. "Yes"<br />
2. "No"<br />
IF the last mileage reading is greater<br />
than the first mileage reading OR IF<br />
the last kilometre reading is greater<br />
than the first kilometre reading (MilesL<br />
> MilesF OR KmL > KmF) AND IF the<br />
vehicle was used as a taxi or hire car<br />
(InElm5 = Yes) THEN:<br />
InElmA5<br />
"^DMVEH[LTLooper]<br />
How many ^LVPickU2 were driven<br />
using the vehicle as a taxi or hire car?<br />
INTERVIEWER: PRESS TO<br />
GO TO NEXT PICK-UP QUESTION<br />
OR THE END OF THE<br />
QUESTIONNAIRE IF THERE ARE NO<br />
MORE VEHICLES"<br />
IF the last mileage reading is greater<br />
than the first mileage reading OR IF<br />
the last kilometre reading is greater<br />
than the first kilometre reading (MilesL<br />
> MilesF OR KmL > KmF) AND (the<br />
number of miles/kilometres the vehicle<br />
was driven by someone outside the<br />
household is given OR IF the number<br />
of miles/kilometres the vehicle was<br />
driven to carry goods in the course of<br />
work was given OR IF the number of<br />
miles/kilometres the vehicle was<br />
driven off the public road is given OR<br />
IF the number of miles/kilometres the<br />
vehicle was driven outside Great<br />
Britain was given OR IF the number of<br />
miles/kilometres the vehicle was<br />
driven as a taxi/hire car were given<br />
(InElmA1 = RESPONSE OR InElmA2
= RESPONSE or InElmA3 =<br />
RESPONSE OR InElmA3 =<br />
RESPONSE OR InElmA4 =<br />
RESPONSE OR InElmA5 =<br />
RESPONSE)) OR (IF the vehicle was<br />
not driven by someone outside the<br />
household (InElm1 = No) AND the<br />
vehicle was not driven to carry goods<br />
in the course of work (InElm2 = No)<br />
AND the vehicle was not driven off the<br />
public road (InElm3 = No) AND the<br />
vehicle was not driven outside Great<br />
Britain (InElm4 = No) AND the vehicle<br />
was not used as a taxi or hire car<br />
(InElm5 = No))<br />
TotInel<br />
"^DMVEH[LTLooper]<br />
TOTAL INELIGIBLE MILEAGE:<br />
^LVPickU3<br />
INTERVIEWER: PRESS ENTER TO<br />
CONFIRM OR GO BACK AND<br />
CHECK InElm QUESTIONS"<br />
TotElig<br />
"^DMVEH[LTLooper]<br />
TOTAL ELIGIBLE MILES"<br />
National Centre for Social Research<br />
298
Admin Block<br />
IF Placement Interview completed<br />
(QSignIn.StatusQ = Place) THEN:<br />
Thank<br />
"THIS IS THE END OF THE<br />
PLACEMENT INTERVIEW.<br />
Some interviews in a survey are<br />
checked to make sure that people like<br />
yourself are satisfied with the way that<br />
the interview was carried out. Just in<br />
case yours is one of the interviews that<br />
is checked, it would be helpful if we<br />
could have your telephone<br />
number.<br />
INTERVIEWER: WRITE NAME AND<br />
TELEPHONE NUMBER IF GIVEN ON<br />
THE FRONT PAGE OF THE ARF.<br />
THE NEXT SCREENS DISPLAY<br />
INFORMATION USEFUL FOR<br />
PREPARING DIARIES AND OTHER<br />
DOCUMEMTS."<br />
1. "Number given"<br />
2. "Number refused"<br />
3. "No phone"<br />
(CHANGED <strong>2004</strong> ONWARDS TO:)<br />
"THIS IS THE END OF THE<br />
PLACEMENT INTERVIEW.<br />
Some interviews in a survey are<br />
checked to make sure that people like<br />
yourself are satisfied with the way that<br />
the interview was carried out. Just in<br />
case yours is one of the interviews that<br />
is checked, it would be helpful if we<br />
could have your telephone<br />
number.<br />
INTERVIEWER: WRITE CONTACT<br />
NAME AND TELEPHONE NUMBER<br />
IF GIVEN ON THE FRONT PAGE OF<br />
THE ARF. THE NEXT SCREENS<br />
DISPLAY INFORMATION USEFUL<br />
FOR PREPARING DIARIES AND<br />
OTHER DOCUMEMTS."<br />
1. "Number given"<br />
2. "Number refused"<br />
3. "No phone"<br />
RECORD ALWAYS<br />
Penult<br />
"^pentxt1 ^pentxt2 ^pentxt2a<br />
National Centre for Social Research<br />
299<br />
Diary start day is @I^QSignIn.TWDay,<br />
^QSignIn.TravDate@I and end day is<br />
@I^TWEDay, ^TWEDate@I<br />
^pentxt3"<br />
1. "Press 1 and to continue."<br />
(QUESTION ADDED <strong>2004</strong><br />
ONWARDS:)<br />
IF Placement Interview completed<br />
(QSignIn.StatusQ = Place) THEN<br />
AnyCom<br />
"INTERVIEWER: THE FOLLOWING<br />
OPEN QUESTION IS OPTIONAL<br />
AND IS FOR USE AT YOUR OWN<br />
DISCRETION. IT ASKS ABOUT<br />
GENERAL TRAVEL ISSUES.<br />
Would you like to ask the respondent a<br />
general open question?"<br />
1. "Yes"<br />
2. "No"<br />
(QUESTION ADDED <strong>2004</strong><br />
ONWARDS:)<br />
IF Interviewer asks general open<br />
question (Anycom= Yes) THEN<br />
AnyComX<br />
"Are there any travel related issues<br />
you would like to raise that we have<br />
not already talked about."<br />
IF Placement Interview completed and<br />
the date is before the Travel Week<br />
date (QSignIn.StatusQ = Place) AND<br />
(QSignIn.StartDat <<br />
QSignIn.TravDate) THEN:<br />
Penult2<br />
"NOW PLACE LONG DISTANCE<br />
JOURNEY RECORDS IF ANY<br />
RESPONDENTS ARE LIKELY TO<br />
MAKE ANY JOURNEYS OF 50 MILES<br />
OR MORE WITHIN GREAT BRITAIN<br />
BETWEEN NOW AND THE START<br />
OF THE TRAVEL WEEK. DON'T<br />
FORGET TO FILL IN:<br />
Placement interview date:<br />
^QSignIn.StartDat Date Diary begins:<br />
^QSignIn.TravDate
Respondent names, serial number and<br />
person numbers.<br />
^pentxt2"<br />
1. "Press 1 and to continue."<br />
(CHANGED <strong>2003</strong> ONWARDS TO:)<br />
"NOW PLACE LONG DISTANCE<br />
JOURNEY RECORDS IF ANY<br />
RESPONDENTS ARE LIKELY TO<br />
MAKE ANY JOURNEYS OF 50 MILES<br />
OR MORE WITHIN GREAT BRITAIN<br />
BETWEEN @INOW AND THE DAY<br />
BEFORE THE TRAVEL WEEK<br />
BEGINS. DON'T FORGET TO FILL<br />
IN:<br />
Placement interview date:<br />
^QSignIn.StartDat Date Diary begins:<br />
^QSignIn.TravDate<br />
Respondent names, serial number and<br />
person numbers.<br />
^pentxt2"<br />
1. "Press 1 and to continue."<br />
IF Placment Interview completed and<br />
respondent has a vehicle<br />
(QSignIn.StatusQ = Place) AND<br />
(DMNOVEH > 0) THEN:<br />
Penult3<br />
"NOW PLACE A FUEL AND MILEAGE<br />
CHART FOR EACH VEHICLE. DON'T<br />
FORGET TO FILL IN READING<br />
DATES AND VEHICLE NUMBERS:<br />
Reading dates are before first use on<br />
@I^QSignIn.TWDay,<br />
^QSignIn.TravDate@I and after last<br />
use on @I^TWEDay, ^TWEDate@I<br />
^pentxt2"<br />
1. "Press 1 and to continue."<br />
RECORD ALWAYS<br />
Penult4<br />
"INTERVIEWER: HOW LONG DID IT<br />
TAKE TO PLACE AND EXPLAIN THE<br />
DIARY AND OTHER DOCUMENTS?<br />
RECORD TO NEAREST MINUTE"<br />
(CHANGED <strong>2003</strong> ONWARDS TO:)<br />
"INTERVIEWER: HOW LONG DID IT<br />
TAKE TO PLACE AND EXPLAIN THE<br />
DIARY AND OTHER DOCUMENTS?<br />
National Centre for Social Research<br />
300<br />
INCLUDE ANY TIME SPENT<br />
PREPARING THE DIARIES<br />
BEFOREHAND (E.G. FILLING IN THE<br />
FRONT).<br />
RECORD TO NEAREST MINUTE"<br />
Penult5<br />
"INTERVIEWER: HOW LONG DID IT<br />
TAKE TO PICK UP AND CHECK THE<br />
DIARY(IES)?<br />
RECORD TO NEAREST MINUTE"<br />
SOC2000<br />
"@T@BStandard Occupational<br />
Classification (SOC2000)@B<br />
Person@|@|@|: ^PName<br />
Job Title @|@|: ^PJobTitle<br />
Job Description @|: ^PJobDescr<br />
Responsibilty @|@|: ^PSvDesc<br />
Industry @|@|: ^PIndustry<br />
Summary @|@|: ^ESSummary @T<br />
XSOC2000<br />
"Standard Occupational Classification<br />
- SOC2000 - WITHOUT DOTS."<br />
IndexNo<br />
"Index number of SOC2000 entry<br />
selected in coding index"<br />
ES2000<br />
"Full employment status - derived from<br />
Job block questions and SOC2000"<br />
1. "Self-employed : large<br />
establishment (25+ employees)"<br />
2. "Self-employed : small<br />
establishment (1-24 employees)"<br />
3. "Self-employed : no employees"<br />
4. "Manager : large establishment<br />
(25+ employees)"<br />
5. "Manager : small establishment (1-<br />
24 employees)"<br />
6. "Foreman or supervisor"<br />
7. "Employee (not elsewhere<br />
classified)"<br />
8. "No employment status info given -<br />
for use in this program only"
NSSEC<br />
"NS-SEC Socio-economic Class (full<br />
classification)- derived variable"<br />
SECFlag<br />
"Indicator for status of SEC<br />
0 - valid combination of SEC and<br />
ES2000 1 - invalid combination 2 - no<br />
employment status info - simplified<br />
SEC used"<br />
SEG<br />
"Socio-economic Group (old scheme)"<br />
Status<br />
"Current Interview Status<br />
UPDATE THIS BEFORE EACH<br />
TRANSMISSION TO HEAD OFFICE."<br />
0. "No work done yet"<br />
1. "Calls made but no contact"<br />
2. "Contact made"<br />
3. "Interview started/Any interviewing<br />
done."<br />
4. "Other - no interviewing required<br />
(eg. ineligible, refusal)"<br />
MENUNOTE<br />
"REMINDER/NOTE FOR THE<br />
OPENING MENU (OPTIONAL)<br />
IF NOTHING TO SAY, JUST PRESS<br />
.<br />
ENTER IN HERE ANY USEFUL<br />
DETAILS YOU WISH TO APPEAR<br />
ON THE ADDRESS MENU>"<br />
Choice<br />
"INTERVIEWER: DO YOU NOW<br />
WANT TO...<br />
INTERVIEWER: DON'T SELECT<br />
CODE 5 UNTIL ALL OTHER WORK<br />
ON THIS HOUSEHOLD IS<br />
COMPLETED."<br />
1. "LEAVE THIS QUESTIONNAIRE -<br />
without filling in the admin details?"<br />
National Centre for Social Research<br />
301<br />
5. "FILL IN THE ADMIN DETAILS -<br />
and prepare this household for<br />
transmission to Head Office?"<br />
(QUESTION ADDED <strong>2003</strong><br />
ONWARDS:)<br />
IF (Choice = Admin) AND (Penult =<br />
RESPONSE) AND (QSignin.StatusQ =<br />
Place) THEN<br />
NoPU<br />
"Please explain why you did not<br />
conduct the pick up interview".<br />
CallTot<br />
"INTERVIEWER: Enter the @Itotal<br />
number of calls@I made."<br />
IF Household number equals 1<br />
(QID.HHold = 1) THEN:<br />
FindHH<br />
"How many households did you find at<br />
this address?<br />
INTERVIEWER: TAKE THE ANSWER<br />
AS RECORDED AT Q6a ON THE<br />
A.R.F. FOR THIS ADDRESS.<br />
IF ADDRESS IS INELIGIBLE, OR<br />
NUMBER OF HOUSEHOLDS NOT<br />
ESTABLISHED, ENTER '0'"<br />
IF More than one household at<br />
address (FindHH > 1) THEN:<br />
HHSel<br />
"And how many households did you<br />
SELECT for interview? (May not be<br />
the same as the number actually<br />
interviewed)<br />
ENTER THE NUMBER<br />
@ISELECTED@I FOR INTERVIEW"<br />
RECORD ALWAYS<br />
PIOut<br />
"Placement interview outcome"<br />
1. "Full"<br />
2. "Started"<br />
3. "NoInt"
Diary<br />
"Did you collect a completed diary for<br />
^QNames.QBNames[PND].Name?<br />
^DiaTxt PLACEMENT INTERVIEW<br />
FULLY COMPLETED = FILLED IN<br />
FOR ALL 7 DAYS (DAYS WHEN NO<br />
JOURNEYS MADE COUNT AS<br />
FILLED IN).<br />
PARTIALLY COMPLETED = AT<br />
LEAST ONE JOURNEY RECORDED<br />
BUT ONE OR MORE DAYS NOT<br />
FILLED IN.<br />
NO DIARY = NO JOURNEYS<br />
COMPLETED AT ALL. (EXTRA INT.<br />
INSTRUCTION ADDED <strong>2003</strong><br />
ONWARDS)"<br />
1. "Yes - fully completed diary"<br />
2. "Yes - partially completed diary"<br />
3. "No - no diary completed for this<br />
person"<br />
IF fully/partially completed diary for<br />
respondent aged under 15 (Diary IN<br />
[YesFull_YesPart] AND (XAge
"Did you complete and leave behind<br />
the promissory note for the incentive<br />
vouchers?"<br />
1. "Yes"<br />
2. "No"<br />
IF Each household member has<br />
completed a full diary and the<br />
household is entitled to the incentive<br />
vouchers(Area >= 20701) AND<br />
Address IN<br />
[1,2,3,5,6,8,9,11,12,14,15,17,18,20,21,<br />
22]) AND IF Promissory note not left<br />
(Promise = No) THEN:<br />
NoProm<br />
"Please explain why you did not leave<br />
the promissory note?"<br />
RECORD ALWAYS<br />
Outcome<br />
"FINAL OUTCOME FOR<br />
HOUSEHOLD INTERVIEW, =<br />
Computed OR UnOut"<br />
UnOut<br />
"ENTER OUTCOME CODE FROM<br />
ARF."<br />
(IF Unout IN [64, 65])<br />
ARFQ3<br />
"Was the information refused ?<br />
INTERVIEWER - QUESTION 3 IN<br />
UNKNOWN ELIGIBILITY SECTION<br />
ON ARF"<br />
1. "REFUSED"<br />
2. "DID NOT MAKE CONTACT"<br />
(IF Unout IN [43])<br />
ARFQ11<br />
"Was the refusal by the desired person<br />
or by proxy?<br />
INTERVIEWER - QUESTION 11 IN<br />
UNPRODUCTIVE SECTION ON ARF"<br />
1. "REFUSAL BY THE DESIRED<br />
PERSON"<br />
2. "REFUSAL BY PROXY"<br />
National Centre for Social Research<br />
303<br />
ALWAYS RECORD<br />
CallPlac<br />
"@ITHE OUTCOME CODE IS<br />
^Outcome.@I<br />
INTERVIEWER: Enter the total<br />
number of calls up to Diary<br />
placement."<br />
(CHANGED <strong>2003</strong> ONWARDS TO:)<br />
"@ITHE OUTCOME CODE IS<br />
^Outcome.@I<br />
INTERVIEWER: Enter the @Itotal<br />
number of calls@I up to (but NOT<br />
including) Diary placement."<br />
(QUESTION ADDED <strong>2004</strong><br />
ONWARDS:)<br />
ConName<br />
"INTERVIEWER:RECORD CONTACT<br />
NAME FROM FRONT OF ARF IF<br />
NOT AVAILABLE PRESS THE<br />
KEY"<br />
TelNo<br />
"INTERVIEWER:<br />
RECORD TELEPHONE NUMBER<br />
FROM FRONT OF ARF<br />
(**** must be STD code and number<br />
****) IF NOT AVAILABLE PRESS THE<br />
KEY"<br />
IF (Outcome IN<br />
[31,33,42,45,51,56,64,65] AND<br />
(QID.HHold = 1)<br />
ObsDone<br />
"Have you filled in the Observation<br />
form details on Page 7 of the ARF ?"<br />
1. "Yes"<br />
2. "No"<br />
IF (Outcome IN [11, 13, 21, 31, 33, 43,<br />
45, 51, 54, 56]<br />
NRDone<br />
"Have you filled in the Non-Response<br />
form details on Page 7 of the ARF ?"<br />
1. "Non response form completed"<br />
2. "Left postal version"
3. "No"<br />
IF (Outcome IN<br />
[31,33,42,45,51,56,64,65] AND<br />
(QID.HHold = 1) AND IF Observation<br />
details have been completed on ARF<br />
(ObsDone = Yes) THEN:<br />
Obs1<br />
"What kind of accommodation is it?"<br />
1. "House or bungalow : detached"<br />
2. "House or bungalow : semidetached"<br />
3. "House or bungalow : terraced /<br />
end of terrace"<br />
4. "Flat or maisonette : in a purposebuilt<br />
block"<br />
5. "Flat or maisonette : part of a<br />
converted house/other kind of<br />
building"<br />
6. "Room or rooms"<br />
7. "A caravan or mobile home"<br />
8. "Houseboat"<br />
9. "Some other kind of<br />
accommodation"<br />
(QUESTION AND ROUTING<br />
CHANGED <strong>2004</strong> ONWARDS TO:)<br />
IF (Outcome IN<br />
[31,33,42,45,51,56,64,65] AND<br />
(QID.HHold = 1)THEN:<br />
Obs1<br />
" Please enter the Observation form<br />
details from Page 7 of the ARF ?<br />
What kind of accommodation is it?"<br />
1. "House or bungalow : detached"<br />
2. "House or bungalow : semidetached"<br />
3. "House or bungalow : terraced /<br />
end of terrace"<br />
4. "Flat or maisonette : in a purposebuilt<br />
block"<br />
5. "Flat or maisonette : part of a<br />
converted house/other kind of<br />
building"<br />
6. "Room or rooms"<br />
7. "A caravan or mobile home"<br />
8. "Houseboat"<br />
9. "Some other kind of<br />
accommodation"<br />
National Centre for Social Research<br />
304<br />
IF (Outcome IN<br />
[31,33,42,45,51,56,64,65] AND<br />
(QID.HHold = 1) AND IF Observation<br />
details have been completed on ARF<br />
(ObsDone = Yes) AND IF Observed<br />
accommodation is a house or<br />
bungalow (IF Obs1 IN<br />
[housed..houset] THEN:<br />
Obs2<br />
"Did you - at any visit - observe a car<br />
in the drive?"<br />
1. "Yes, car in driveway"<br />
2. "No car in driveway"<br />
3. "No driveway"<br />
(QUESTION AND ROUTING<br />
CHANGED <strong>2004</strong> ONWARDS TO:)<br />
IF (Outcome IN<br />
[31,33,42,45,51,56,64,65] AND<br />
(QID.HHold = 1)AND IF Observed<br />
accommodation is a house or<br />
bungalow (IF Obs1 IN<br />
[housed..houset] THEN:<br />
Obs2<br />
"Did you - at any visit - observe a car<br />
in the drive?"<br />
1. "Yes, car in driveway"<br />
2. "No car in driveway"<br />
3. "No driveway"<br />
Obs3<br />
"Does the house/bungalow have a<br />
garage or car port?"<br />
1. "Yes"<br />
2. "No"<br />
3. "Not sure"<br />
(ROUTING CHANGED <strong>2004</strong><br />
ONWARDS TO:)<br />
IF (Outcome IN<br />
[31,33,42,45,51,56,64,65] AND<br />
(QID.HHold = 1)AND IF Observed<br />
accommodation is a house or<br />
bungalow (IF Obs1 IN<br />
[housed..houset] THEN:<br />
Obs3<br />
"Does the house/bungalow have a<br />
garage or car port?"<br />
1. "Yes"<br />
2. "No"<br />
3. "Not sure"
IF (Outcome IN [11, 13, 21, 31, 33, 43,<br />
45, 51, 54, 56] AND Non-Response<br />
details on ARF have been completed<br />
(NRDone = Yes) THEN:<br />
NR1<br />
"How many cars or vans are owned, or<br />
available for use, by one or more<br />
members of your household, including<br />
yourself?<br />
INCLUDE ANY COMPANY CAR OR<br />
VAN IF AVAILABLE FOR PRIVATE<br />
USE"<br />
0. "None"<br />
1. "One"<br />
2. "Two"<br />
3. "Three or more"<br />
NR2<br />
"Did the main householder do any paid<br />
work in the 7 days ending yesterday,<br />
either as an employee or as selfemployed?"<br />
1. "Yes"<br />
2. "No"<br />
IF (Outcome IN [11, 13, 21, 31, 33, 43,<br />
45, 51, 54, 56] AND Non-Response<br />
details on ARF have been completed<br />
(NRDone = Yes) AND the main<br />
householder is employed (NR2 = Yes)<br />
THEN:<br />
NR3<br />
"How does the main householder<br />
usually travel to work?<br />
THIS QUESTION APPLIES TO THE<br />
JOB IN WHICH THE MAIN<br />
HOUSEHOLDER USUALLY WORKS<br />
THE MOST HOURS.<br />
CODE ONE ONLY FOR THE<br />
LONGEST PART, BY DISTANCE, OF<br />
THE MAIN HOUSEHOLDER'S<br />
@IUSUAL@I JOURNEY TO WORK."<br />
1. "Works mainly at or from home"<br />
2. "Underground, metro, light rail,<br />
tram"<br />
3. "Train"<br />
4. "Bus, minibus or coach"<br />
5. "Motor cycle, scooter or moped"<br />
National Centre for Social Research<br />
305<br />
6. "Car or van"<br />
7. "Taxi/minicab"<br />
8. "Bicycle"<br />
9. "On foot"<br />
10. "Other"<br />
IF (Outcome IN [11, 13, 21, 31, 33, 43,<br />
45, 51, 54, 56] AND Non-Response<br />
details on ARF have been completed<br />
(NRDone = Yes) THEN:<br />
NR4<br />
"And now thinking about yourself, did<br />
you leave the house at all yesterday,<br />
including for any walks of more than<br />
50 yards?"<br />
1. "Yes"<br />
2. "No"<br />
IF (Outcome IN [11, 13, 21, 31, 33, 43,<br />
45, 51, 54, 56] AND Non-Response<br />
details on ARF have been completed<br />
(NRDone = Yes) AND IF Respondent<br />
left house yesterday (NR4 = Yes)<br />
THEN:<br />
NR5<br />
"How many times did you leave the<br />
house yesterday?<br />
INCLUDE ALL OUTINGS BY ANY<br />
METHOD OF TRANSPORT,<br />
INCLUDING WALKS IF THEY ARE<br />
MORE THAN 50 YARDS"<br />
NR6<br />
"RECORD DAY OF WEEK FOR<br />
YESTERDAY"<br />
1. "Monday"<br />
2. "Tueday"<br />
3. "Wednesday"<br />
4. "Thursday"<br />
5. "Friday"<br />
6. "Saturday"<br />
7. "Sunday"
IF (Outcome IN [11, 13, 21, 31, 33, 43,<br />
45, 51, 54, 56] AND Non-Response<br />
details on ARF have been completed<br />
(NRDone = Yes) THEN:<br />
NR7<br />
"Could you just tell me how many<br />
people there are altogether in your<br />
household - including any children or<br />
babies?"<br />
NR8<br />
"ASK OR RECORD: And how many of<br />
these people are aged 17 or over?"<br />
NR9m<br />
"ASK OR RECORD: And of those<br />
aged 17 or over, how many are<br />
@Imen@I and how many are<br />
@Iwomen@I?<br />
ENTER NUMBER OF MEN AGED 17+<br />
AT THIS QUESTION<br />
ENTER NUMBER OF WOMEN AT<br />
THE NEXT QUESTION"<br />
NR9w<br />
"ENTER NUMBER OF WOMEN<br />
AGED 17+ IN THE HOUSEHOLD"<br />
NR10<br />
"RECORD SEX OF RESPONDENT"<br />
1. "Male"<br />
2. "Female"<br />
NR11<br />
"What is your relationship to the main<br />
householder?<br />
CODE ONE ONLY"<br />
1. "I am main householder"<br />
2. "Husband, wife or partner"<br />
3. "Son, daughter, step-child, or<br />
foster child"<br />
4. "Brother or sister"<br />
5. "Mother, father, step-mother or<br />
step-father"<br />
6. "Other related"<br />
7. "Unrelated"<br />
National Centre for Social Research<br />
306<br />
IF (Outcome IN [11, 13, 21, 31, 33, 43,<br />
45, 51, 54, 56] AND Non-Response<br />
details on ARF have been completed<br />
(NRDone = Yes) AND IF Respondent<br />
is not main householder (NR11 IN<br />
[hwpart..unrel]) THEN:<br />
NR12<br />
"ASK OR RECORD: What is the main<br />
householder's sex?"<br />
1. "Male"<br />
2. "Female"<br />
IF (Outcome IN [11…13, 21…23])<br />
THEN:<br />
RemCall<br />
"Did you make a Reminder Call<br />
between placing the diaries and the<br />
start of the Travel Week?<br />
SEE FRONT PAGE OF ARF -<br />
Purpose* COLUMN OF CALLS<br />
RECORD"<br />
1. "Yes"<br />
2. "No"<br />
(CHANGED <strong>2003</strong> ONWARDS TO:)<br />
"Did you make a reminder call or send<br />
a reminder card between placing the<br />
diaries and the start of the Travel<br />
Week?<br />
SEE FRONT PAGE OF ARF -<br />
Purpose* COLUMN OF CALLS<br />
RECORD"<br />
1. "Yes, reminder call"<br />
2. "Yes, reminder card"<br />
"No reminder call or card"<br />
IF (Outcome IN [11…13, 21…23])<br />
AND IF A reminder call was made<br />
between placing the diaries and the<br />
start of the Travel Week (RemCall =<br />
YesCall) THEN:<br />
RemTime<br />
"How long did this reminder call take?<br />
RECORD TO NEAREST MINUTE"
IF (Outcome IN [11…13,<br />
21…23])THEN:<br />
MidWeek<br />
"Did you make a mid-week check-call<br />
during the Travel Week ?<br />
SEE FRONT PAGE OF ARF -<br />
Purpose* COLUMN OF CALLS<br />
RECORD"<br />
1. "Yes - by phone"<br />
2. "Yes - in person"<br />
3. "No"<br />
IF (Outcome IN [11…13, 21…23])<br />
AND A Mid-week call has been made<br />
either by phone or in person (MidWeek<br />
= Phone OR MidWeek = Person)<br />
THEN:<br />
MidTime<br />
"How long did this mid-week check-call<br />
take?<br />
RECORD TO NEAREST MINUTE"<br />
RECORD ALWAYS<br />
FeeType<br />
"Pay fee items"<br />
IntDone<br />
"@IOUTCOME CODE: ^Outcome@I<br />
HAVE YOU COMPLETED ALL PICK<br />
UP INTERVIEWING, CHECKING AND<br />
NOTES?<br />
CODE 1 (Yes) SIGNALS THAT THIS<br />
INTERVIEW IS READY FOR<br />
RETURN OF WORK TO HEAD<br />
OFFICE"<br />
1. "Yes, completed all coding etc."<br />
2. "Not yet"<br />
IntStatus<br />
"Interview status"<br />
1. "Interview not started"<br />
2. "Started interview"<br />
3. "Partial interview"<br />
4. "Full interview"<br />
"No interview required (Nonproductive/deadwood)"<br />
National Centre for Social Research<br />
307<br />
Diary Entry System<br />
Journey level<br />
Record always<br />
SerNo<br />
Household Serial Number<br />
Record always<br />
JpersNo<br />
Person number<br />
1..10<br />
Ask for every journey<br />
TravDay<br />
Travel day<br />
1..7<br />
Ask for every journey<br />
Journum<br />
Journey number<br />
1..30<br />
Ask for every journey<br />
PurFrom<br />
Purpose from (i.e. purpose of<br />
previous journey)<br />
1 Home<br />
2 Work<br />
3 In course of work<br />
4 Education<br />
5 Food/grocery shopping<br />
6 All other types of shopping<br />
7 Personal business – medical<br />
8 Personal business – other<br />
9 Eat/drink – alone or at work<br />
10 Eat/drink – other occasions<br />
11 Visit friends/relatives at home<br />
12 Other social<br />
13 Entertainment/public social<br />
activities<br />
14 Sport – participate<br />
15 Holiday base<br />
16 (Day) journey/just walk<br />
17 Other non-escort
18 Escort home (not own)<br />
19 Escort work<br />
20 Escort in course of work<br />
21 Escort education<br />
22 Escort shopping/personal<br />
business<br />
Ask for every journey<br />
PurTo<br />
Purpose to<br />
1 Home<br />
2 Work<br />
3 In course of work<br />
4 Education<br />
5 Food/grocery shopping<br />
6 All other types of shopping<br />
7 Personal business – medical<br />
8 Personal business – other<br />
9 Eat/drink – alone or at work<br />
10 Eat/drink – other occasions<br />
11 Visit friends/relatives at home<br />
12 Other social<br />
13 Entertainment/public social<br />
activities<br />
14 Sport – participate<br />
15 Holiday base<br />
16 (Day) journey/just walk<br />
17 Other non-escort<br />
18 Escort home (not own)<br />
19 Escort work<br />
20 Escort in course of work<br />
21 Escort education<br />
22 Escort shopping/personal<br />
business<br />
23 Escort other<br />
Ask for every journey<br />
Timeleft<br />
Time left (12 hour clock)<br />
0..12<br />
Ask for every journey<br />
LeftMin<br />
Time left (minutes)<br />
00..59<br />
National Centre for Social Research<br />
308<br />
Ask for every journey<br />
TimeArr<br />
Time arrived (12 hour clock)<br />
0..12<br />
Ask for every journey<br />
Arrmin<br />
Time arrived (minutes)<br />
00..59<br />
Ask for every journey<br />
OrigCnty<br />
County code for journey origin<br />
Ask for every journey<br />
OriginUa<br />
Unitary authority code for journey<br />
origin<br />
Ask for every journey<br />
OriginUr<br />
Urban rural code for journey origin<br />
Ask for every journey<br />
DestCnty<br />
County code for journey destination<br />
Ask for every journey<br />
DestinUa<br />
Unitary authority code for journey<br />
destination<br />
Ask for every journey<br />
DestinUR<br />
Urban rural code for journey<br />
destination<br />
Ask for every journey<br />
Series<br />
Was the journey a series of calls?<br />
0 Not a series of calls (default<br />
setting)<br />
1 Journey was a series of calls
Ask for every journey<br />
NextDay<br />
Was the arrival time after midnight on<br />
the next day?<br />
0 Arrival time before midnight (default<br />
setting)<br />
1 Arrival time past midnight<br />
Ask for every journey<br />
NumStag<br />
Number of stages in journey<br />
1..10<br />
Ask for every journey<br />
Idiscov<br />
Interviewer discovered journey<br />
Interviewer did not discover journey<br />
(default setting)<br />
Interviewer discovered journey<br />
Ask for every journey<br />
Inelig<br />
Is the journey ineligible?<br />
Eligible journey (default setting)<br />
Ineligible journey (but journey is<br />
included for information, e.g. to link<br />
two eligible journeys)<br />
Ask if diary day is blank<br />
Blank<br />
Why is day blank?<br />
1 No journeys made<br />
2 Day not filled in<br />
Rjday<br />
Repeat journey (same person,<br />
same/different day)<br />
Enter travel day of original journey<br />
1..7<br />
Rjjnum<br />
Repeat journey number (same person,<br />
same/different journey number)<br />
National Centre for Social Research<br />
309<br />
Enter journey number of original<br />
journey<br />
1..29<br />
Djpnum<br />
Duplicate journey (another person)<br />
Enter journey number of original<br />
journey<br />
1..29<br />
Djjnum<br />
Duplicate journey (another person,<br />
same/different journey number)<br />
Enter person number of original<br />
journey<br />
1..9<br />
IF travday = 7<br />
Origpnam<br />
Origin placename<br />
IF travday = 7<br />
Destpnam<br />
Destination placename<br />
IF travday = 7<br />
Origad1<br />
First line of origin address<br />
IF travday = 7<br />
Origad2<br />
Second line of origin address<br />
IF travday = 7<br />
Origad3<br />
Third line of origin address<br />
IF travday = 7<br />
Origpc<br />
Post code of origin
IF travday = 7<br />
Destad1<br />
First line of destination address<br />
IF travday = 7<br />
Destad2<br />
Second line of destination address<br />
IF travday = 7<br />
Destad3<br />
Third line of destination address<br />
IF travday = 7<br />
Destpc<br />
Post code of destination<br />
Stages<br />
Ask for each stage<br />
Stagenum<br />
Number of journey stage<br />
1.. 10<br />
Ask for each stage<br />
Method<br />
Method of travel<br />
1 Walk<br />
2 Bicycle<br />
3 Private (hire) Bus<br />
4 Car<br />
5 Motorcycle combination<br />
6 Van or lorry<br />
7 Other private transport<br />
8 Ordinary Bus (London)<br />
9 Ordinary Bus (Elsewhere)<br />
10 Coach/Express Bus<br />
11 Excursion/Tour Bus<br />
12 LT underground<br />
13 Train (formerly BR)<br />
14 Light rail<br />
15 Aircraft (public)<br />
16 Taxi<br />
17 Minicab/private hire vehicle<br />
18 Other public transport<br />
National Centre for Social Research<br />
310<br />
19 Unspecified (private)<br />
20 Unspecified (public)<br />
Ask for each stage<br />
Dunits<br />
Distance in miles<br />
0.25..500<br />
Ask for each stage<br />
Dtenths<br />
Distance in tenths of miles<br />
Ask for each stage in young person’s<br />
diary<br />
PartyNoa<br />
Number of adults in party<br />
1..30<br />
Ask for each stage in young person’s<br />
diary<br />
PartyNoc<br />
Number of children in party<br />
1..30<br />
Ask for each stage in adult diary<br />
Partynum<br />
Number of people in party<br />
1..30<br />
Ask for each stage<br />
Travmins<br />
Time travelling in minutes<br />
1..600<br />
Ask for each stage involving ordinary<br />
bus London OR ordinary bus<br />
elsewhere OR coach/express bus, OR<br />
excursion/tour bus, OR LT<br />
underground OR train OR light rail OR<br />
aircraft public OR other public OR<br />
unspecified public<br />
Ticktype<br />
Type of ticket (Season ticket<br />
information gathered during the CAPI<br />
placement and pick up interviewers<br />
are coded 1-6).
7 Ordinary ticket – adult<br />
8 Ordinary ticket – child<br />
9 Reduced (Off-peak) - adult<br />
10 Reduced (Off-peak) – child<br />
11 Special category reduced<br />
12 Other<br />
(ROUTING CHANGED <strong>2004</strong><br />
ONWARDS TO:<br />
Computed by TickTyp2<br />
Ticktype<br />
TickType 1 = TickTyp2 1<br />
TickType 2 = TickTyp2 2<br />
TickType 3 = TickTyp2 3<br />
TickType 4 = TickTyp2 4<br />
TickType 5 = TickTyp2 5<br />
TickType 6 = TickTyp2 6<br />
TickType 7 = TickTyp2 7 + 13<br />
TickType 8 = TickTyp2 8 + 14<br />
TickType 9 = TickTyp2 9<br />
TickType 10 = TickTyp2 10<br />
TickType 11 = TickTyp2 11<br />
TickType 12 = TickTyp2 12<br />
(QUESTION ADDED <strong>2004</strong><br />
ONWARDS:)<br />
Ask for each stage involving ordinary<br />
bus London OR ordinary bus<br />
elsewhere OR coach/express bus, OR<br />
excursion/tour bus, OR LT<br />
underground OR train OR light rail OR<br />
aircraft public OR other public OR<br />
unspecified public<br />
TickTyp2<br />
1 Special ticket 1<br />
2 Special ticket 2<br />
3 Special ticket 3<br />
4 Special ticket 4<br />
5 Special ticket 5<br />
6 Special Ticket 6<br />
7 Ordinary adult excl 1 day<br />
TCard<br />
8 Ordinary child excl 1 day<br />
Tcard<br />
9 Reduced off peak adult<br />
10 Reduced off peak child<br />
11 Reduced special category<br />
12 Other special category<br />
13 Adult one day travelcard<br />
National Centre for Social Research<br />
311<br />
14 Child one day travelcard<br />
Ask for each stage involving public<br />
transport (Method = ordinary bus<br />
London OR ordinary bus elsewhere<br />
OR coach/express bus, OR<br />
excursion/tour bus, OR LT<br />
underground OR train OR light rail OR<br />
aircraft public OR Taxi OR minicab OR<br />
other public OR unspecified public)<br />
CostPds<br />
Stage cost in pounds<br />
0.. 300<br />
Ask for each stage involving public<br />
transport (Method = ordinary bus<br />
London OR ordinary bus elsewhere<br />
OR coach/express bus, OR<br />
excursion/tour bus, OR LT<br />
underground OR train OR light rail OR<br />
aircraft public OR Taxi OR minicab OR<br />
other public OR unspecified public)<br />
CostPen<br />
Stage cost in pence<br />
0.. 99<br />
Ask for each stage involving public<br />
transport (Method = ordinary bus<br />
London OR ordinary bus elsewhere<br />
OR coach/express bus, OR<br />
excursion/tour bus, OR LT<br />
underground OR train OR light rail OR<br />
aircraft public OR Taxi OR minicab OR<br />
other public OR unspecified public)<br />
Numboard<br />
Number of boardings<br />
1..10<br />
Ask for each stage involving car OR<br />
motorcycle combination OR van/lorry<br />
WhichVeh<br />
Household vehicle number<br />
1..10
Ask for each stage involving car OR<br />
motorcycle combination OR van/lorry<br />
Dripas<br />
Whether driver or passenger<br />
1 Driver (only if adult diary)<br />
Front passenger<br />
Rear passenger<br />
Passenger position unknown<br />
Ask for each stage involving car OR<br />
motorcycle combination OR van/lorry<br />
Wherepk<br />
1 On own/friends premises<br />
Firm/work car park<br />
Other private car park<br />
Park and ride car park<br />
Other public car park<br />
Street<br />
Not parked<br />
Other<br />
Wherepk (QUESTION DELETED <strong>2004</strong><br />
ONWARDS)<br />
Ask for each stage involving car OR<br />
motorcycle combination OR van/lorry<br />
Parkpds<br />
Parking cost in pounds<br />
0..50<br />
Ask for each stage involving car OR<br />
motorcycle combination OR van/lorry<br />
Parkpen<br />
Parking cost in pence<br />
0.. 99<br />
(QUESTION ADDED <strong>2003</strong><br />
ONWARDS:)<br />
National Centre for Social Research<br />
312<br />
Ask for each stage involving car OR<br />
motorcycle combination OR van/lorry<br />
Cong<br />
Congestion charge cost in pounds:<br />
00.00 (appears by default if outside of<br />
zone or in zone by method other than<br />
car)<br />
00.50 (London resident)<br />
02.00 (Durham charge)<br />
02.50<br />
05.00<br />
07.00<br />
10.00<br />
12.00<br />
95.00 (queries)<br />
96.00 (exempt)<br />
98.00 (don't know)<br />
99.00 (missing)
National Centre for Social Research<br />
APPENDIX B <strong>2003</strong> AND <strong>2004</strong> ALLOCATION OF PSUS TO QUOTA MONTHS<br />
Major<br />
Stratum<br />
Jan Feb Mar Apr May Jun Jul Aug Sep Oct Nov Dec Total<br />
1 2 2 3 3 2 2 2 2 2 3 3 2 28<br />
2 2 2 0 0 2 2 1 1 3 1 1 1 16<br />
3 1 1 3 3 1 1 2 2 0 2 2 2 20<br />
4 2 2 0 0 2 2 1 1 2 1 1 1 15<br />
5 1 1 3 3 1 1 2 2 1 2 2 2 21<br />
6 3 2 1 0 2 2 1 1 3 1 1 1 18<br />
7 0 1 2 3 2 1 2 2 0 2 2 2 19<br />
8 3 2 2 1 1 2 2 2 3 1 1 1 21<br />
9 1 2 1 2 3 2 2 2 1 2 2 3 23<br />
10 2 1 2 1 1 2 2 2 2 3 2 0 20<br />
11 1 2 1 2 2 2 1 1 2 0 2 3 19<br />
12 2 1 2 1 1 1 2 2 1 3 1 1 18<br />
13 1 2 1 2 1 1 1 1 0 0 1 1 12<br />
14 2 1 2 1 2 2 1 1 3 1 1 1 18<br />
15 2 3 1 2 2 2 2 2 2 2 3 3 26<br />
16 1 0 3 2 1 1 2 2 1 3 1 1 18<br />
17 3 3 1 1 2 2 2 2 3 1 2 2 24<br />
18 0 0 2 2 1 1 1 1 0 2 2 2 14<br />
19 3 3 2 2 3 3 3 3 3 2 2 1 30<br />
20 1 2 1 2 1 1 1 1 1 1 1 3 16<br />
21 2 1 3 2 2 2 2 2 2 3 2 1 24<br />
22 1 2 0 1 1 1 1 1 0 0 1 2 11<br />
23 2 1 2 1 2 2 1 1 3 1 1 0 17<br />
24 2 3 2 2 2 2 2 2 3 3 3 3 29<br />
25 2 2 2 3 2 2 2 2 0 2 2 2 23<br />
26 2 1 1 0 1 1 1 2 3 1 1 1 15<br />
27 1 2 2 3 2 2 3 2 1 2 2 2 24<br />
28 2 1 2 1 2 2 1 1 2 2 2 1 19<br />
29 1 2 1 2 1 1 2 2 0 1 1 3 17<br />
30 2 1 1 0 1 1 1 1 3 1 1 0 13<br />
31 0 0 1 1 1 1 1 1 0 2 1 1 10<br />
32 0 1 1 2 1 1 0 0 0 0 1 1 8<br />
33 1 1 0 0 0 1 1 1 1 0 0 1 7<br />
34 2 1 1 0 1 0 0 0 2 1 1 0 9<br />
35 0 0 1 1 1 1 2 2 0 1 1 0 10<br />
36 1 2 1 2 1 1 0 1 0 1 1 2 13<br />
37 1 1 0 0 1 1 1 0 3 1 1 1 11<br />
38 1 0 2 1 1 1 1 1 0 1 1 0 10<br />
39 0 1 1 2 1 1 1 1 0 1 1 2 12<br />
40 1 1 0 0 0 0 1 1 1 0 0 1 6<br />
Total 57 57 57 57 57 57 57 57 57 57 57 57 684<br />
313
National Centre for Social Research<br />
314
National Centre for Social Research<br />
APPENDIX C ALLOCATION OF PSUS TO QUOTA MONTHS<br />
Major<br />
Stratum<br />
Jan Feb Mar Apr May Jun Jul Aug Sep Oct Nov Dec Total<br />
1 1 3 3 3 2 2 2 2 3 2 3 2 28<br />
2 3 0 1 1 2 1 1 2 1 3 0 1 16<br />
3 0 3 2 2 1 2 2 1 2 0 3 2 20<br />
4 3 0 1 1 1 1 1 2 1 2 0 1 14<br />
5 0 3 2 2 2 2 2 1 2 1 3 2 22<br />
6 3 1 1 1 2 1 1 2 2 3 0 1 18<br />
7 0 2 2 2 1 2 3 1 1 0 3 2 19<br />
8 3 1 2 1 3 1 1 2 2 3 1 1 21<br />
9 3 2 1 2 1 3 2 2 1 1 2 3 23<br />
10 0 1 3 1 2 2 2 2 2 2 1 2 20<br />
11 3 2 0 2 1 1 1 2 1 2 2 1 18<br />
12 0 2 3 1 2 2 2 0 2 1 1 2 18<br />
13 1 1 0 2 1 0 1 2 1 0 2 1 12<br />
14 2 1 2 1 2 2 1 1 2 3 1 1 19<br />
15 3 2 2 3 1 2 2 3 1 2 2 2 25<br />
16 0 2 2 1 2 2 2 1 2 1 1 2 18<br />
17 3 2 1 2 3 1 1 2 3 3 3 1 25<br />
18 0 2 2 1 0 2 2 1 1 0 1 2 14<br />
19 3 1 3 2 3 3 3 2 2 3 2 3 30<br />
20 2 2 0 2 1 1 1 2 1 1 2 1 16<br />
21 1 2 3 1 2 2 2 2 2 2 2 2 23<br />
22 2 1 0 2 1 0 1 1 1 0 1 1 11<br />
23 1 1 2 1 2 2 1 1 2 3 1 0 17<br />
24 3 2 2 3 2 2 2 3 2 3 2 3 29<br />
25 1 3 2 2 1 2 3 1 2 0 3 3 23<br />
26 2 1 1 1 2 1 0 2 2 3 0 0 15<br />
27 1 2 2 2 2 2 3 2 1 0 3 3 23<br />
28 2 1 3 1 2 2 1 1 2 3 1 1 20<br />
29 2 2 0 2 1 1 2 1 1 0 2 2 16<br />
30 1 1 1 1 1 1 0 2 2 3 1 0 14<br />
31 0 1 2 0 1 2 2 0 0 0 0 2 10<br />
32 1 1 0 2 0 0 0 1 1 0 2 0 8<br />
33 1 0 0 0 1 0 1 1 0 1 0 1 6<br />
34 1 1 1 1 1 1 0 1 1 2 0 0 10<br />
35 0 0 2 0 1 2 2 0 1 0 1 1 10<br />
36 1 2 0 2 0 0 1 1 1 0 2 2 12<br />
37 2 0 1 1 2 1 0 2 1 2 0 0 12<br />
38 0 1 2 0 1 1 2 0 1 1 1 1 11<br />
39 1 2 0 2 0 1 1 1 1 0 2 1 12<br />
40 1 0 0 0 1 1 0 1 0 1 0 1 6<br />
Total 57 57 57 57 57 57 57 57 57 57 57 57 684<br />
315
National Centre for Social Research<br />
316
APPENDIX D ADVANCE LETTERS<br />
Dear Sir/Madam,<br />
National Travel Survey<br />
National Centre for Social Research<br />
317<br />
Your interviewer on this study will be<br />
______________________________<br />
Your address has been selected for this study and we are writing to ask for your help.<br />
It is about your daily experience of travelling and is used by the Department for<br />
Transport to shape travel policy.<br />
Most people who take part find it interesting and are pleased to have their views and<br />
experience taken into account by the Government. We rely on the voluntary<br />
cooperation of everyone we approach. To show our appreciation, if everyone in<br />
your household completes the study, each person will receive a £5 gift voucher<br />
exchangeable at many High Street stores.<br />
The research is being carried out by an independent research organisation, the<br />
National Centre for Social Research. One of our interviewers will visit you in the next<br />
few days to arrange a convenient time for an interview. They will show you their<br />
official identification card which includes their photograph and the NatCen logo<br />
shown at the top of this letter.<br />
Your answers will be treated in strict confidence in accordance with the Data<br />
Protection Act, and the information will only be used for statistical purposes.<br />
In the meantime, and as a gesture of good will, we are enclosing a book of first class<br />
stamps for you to keep.<br />
You can find more information on the back of this letter but if you have any questions<br />
please call Joanne Day or Neil Barton at NatCen on 01277 690043. We thank you in<br />
advance for your help.<br />
Yours faithfully,<br />
Joanne Day,<br />
Project Controller, NatCen<br />
Dorothy Salathiel,<br />
Survey Manager, Department for Transport<br />
Please turn over for more information…
?<br />
?<br />
?<br />
?<br />
National Centre for Social Research<br />
How was I chosen?<br />
We have selected a sample of addresses from a list kept by the Post<br />
Office of all addresses in Great Britain. This ensures that the people<br />
invited to take part in the survey are representative of the whole<br />
country.<br />
The findings will not identify you or your family because your name and<br />
address will not be passed to anyone outside NatCen.<br />
I do not travel very often - do you want to interview me?<br />
We are interested in everybody’s day-to-day experience of travel,<br />
however much or little they do. The results are used to look at how<br />
travelling changes over time, and to make decisions about the future.<br />
We need information from a wide range of people including those in or<br />
out of work, children and the elderly. Otherwise we will not get a true<br />
picture of travel in Great Britain.<br />
The study provides up to date information about travel which cannot be<br />
collected in any other way.<br />
What kinds of travel are covered by the survey?<br />
We are interested in all the different kinds of journeys that people make<br />
in Great Britain, as well as how often they make them. This includes<br />
journeys to school or work, shopping trips and journeys for leisure or<br />
social purposes. Both local and long distance travel are covered, as<br />
are all forms of transport (such as cars, public transport, cycling and<br />
walking).<br />
What is the survey used for?<br />
The National Travel Survey is used to build up a picture of how and<br />
why different kinds of people travel. The information is used by policymakers<br />
in Government, as well as by consultants, academics, pressure<br />
groups and charities amongst others.<br />
Some of the specific uses of the survey include studying school<br />
children's travel, monitoring road accidents, predicting future traffic<br />
levels and finding out the transport needs of minority groups.<br />
318
National Centre for Social Research<br />
APPENDIX E QUESTIONS DELETED FROM THE NTS IN <strong>2003</strong> AND <strong>2004</strong><br />
<strong>2003</strong><br />
There were no questions deleted from the questionnaire in <strong>2003</strong>.<br />
<strong>2004</strong><br />
Household Questionnaire<br />
A series of questions about the type of a vehicle (and specifically whether they are 3<br />
or 4 wheeled vehicles for vans and cars, or a motor cycle or moped for motorcycles)<br />
have been condensed into one question which codes the vehicle type.<br />
Individual Questionnaire<br />
Questions concerning travel benefits (bus passes, tickets etc.) for employees.<br />
A question about whether the household owns or has regular use of the vehicle a<br />
respondent uses to travel to work.<br />
Questions about difficulties travelling to work if the respondent did not have use of<br />
their vehicle.<br />
Questions about why a household vehicle is left unused when the respondent goes<br />
to work.<br />
Questions about difficulties travelling to do the main food shopping if the respondent<br />
did not have use of their vehicle.<br />
Questions about why a household vehicle is left unused when the respondent goes<br />
to do their main food shopping.<br />
Vehicle questionnaire<br />
A question about the type of petrol used in a vehicle.<br />
Questions about where a vehicle is usually parked overnight and the cost (and type<br />
of payment) for any such parking.<br />
Diary Entry System<br />
From <strong>2004</strong>, no details about where a vehicle is parked were available in the DES<br />
system for coders to use.<br />
319
National Centre for Social Research<br />
320
APPENDIX F SURVEY LEAFLET<br />
National Centre for Social Research<br />
321
National Centre for Social Research<br />
322
APPENDIX G ADULT AND YOUNG PERSONS TRAVEL RECORDS<br />
National Centre for Social Research<br />
323
National Centre for Social Research<br />
324
National Centre for Social Research<br />
325
National Centre for Social Research<br />
326
National Centre for Social Research<br />
327
National Centre for Social Research<br />
328
APPENDIX H MEMORY JOGGER<br />
National Centre for Social Research<br />
329
National Centre for Social Research<br />
330
National Centre for Social Research<br />
331
APPENDIX I LONG DISTANCE JOURNEY RECORD<br />
Long Distance Travel Record of<br />
National Centre for Social Research<br />
Between today’s date ( / / ) and the day before you begin your Travel Record ( / / ), please keep a note of any journeys you<br />
make of 50 miles or longer. Our interviewer will be asking a few more questions on these long distance journeys when he/she returns to<br />
collect your travel record. Thank you.<br />
Date<br />
Village/town where journey began<br />
Purpose of journey (e.g. from home to work, from home<br />
to visit relatives)<br />
Village/town where journey ended<br />
Distance travelled<br />
(miles or km)<br />
Long Distance<br />
Journey 1<br />
332<br />
Long Distance<br />
Journey 2<br />
Long Distance<br />
Journey 3
Main method of travel (i.e. method used for the longest<br />
distance)<br />
If by car, motorcycle, van, lorry or other private vehicle,<br />
were you the driver or passenger? Driver<br />
National Centre for Social Research<br />
Passenger<br />
333<br />
Driver<br />
Passenger<br />
Driver<br />
Passenger
Date<br />
Village/town where journey began<br />
Purpose of journey (e.g. from home to work, from home<br />
to visit relatives)<br />
Village/town where journey ended<br />
Distance travelled<br />
(miles or km)<br />
Main method of travel (i.e. method used for the longest<br />
distance)<br />
If by car, motorcycle, van, lorry or other private vehicle,<br />
were you the driver or passenger? Driver<br />
National Centre for Social Research<br />
Long Distance<br />
Journey 4<br />
Passenger<br />
335<br />
Driver<br />
Passenger<br />
Long Distance<br />
Journey 5<br />
Driver<br />
Passenger<br />
Long Distance<br />
Journey 6
National Centre for Social Research<br />
336
National Centre for Social Research<br />
APPENDIX J FUEL AND MILEAGE CHART<br />
337
National Centre for Social Research<br />
338
356
APPENDIX K ADDRESS RECORD FORM<br />
National Centre for Social Research<br />
357
Travel Week Start Date: / /<br />
P.2320<br />
Call<br />
No.<br />
Householder<br />
name:<br />
NATIONAL TRAVEL SURVEY<br />
ADDRESS RECORD FORM (ARF)<br />
Telephone<br />
number:<br />
National Centre for Social Research<br />
358<br />
ASSIGNMENT/SLOT<br />
NAME:<br />
TRIP/RETURN NO: A<br />
FINAL OUTCOME:<br />
NAME & ADDRESS DETAILS HOUSEHOLD SELECTION LABEL<br />
Title & Surname<br />
No Tel: 2 No. refused / ex-directory 3<br />
Date<br />
DD/MM<br />
Day<br />
of<br />
week<br />
Call Start<br />
Time<br />
24hr<br />
Clock<br />
1 / :<br />
2 / :<br />
3 / :<br />
4 / :<br />
5 / :<br />
6 / :<br />
7 / :<br />
8 / :<br />
9 / :<br />
Interviewer<br />
name:<br />
Interviewer<br />
number:<br />
Total No.<br />
of calls:<br />
CALLS RECORD<br />
(Note all calls, including telephone calls, even<br />
if no reply)<br />
Productives: Calls<br />
to Diary Placement<br />
*Call Status<br />
(Enter<br />
codes only)<br />
HH<br />
No:<br />
1<br />
Call End Purpose**<br />
Time 24hr<br />
Clock<br />
10 / :<br />
:<br />
*Call Status Codes: 1=No Reply, 2=Contact Made, 3=Appointment made, 4=Interviewing done, 5=Any Other Outcome (describe in<br />
calls record)<br />
** Record whether the call was placement (PL), reminder (R), mid-week check tel (MT) or F2F (MF), or pick-up (PU).<br />
:<br />
:<br />
:<br />
:<br />
:<br />
:<br />
:<br />
:<br />
:
1<br />
2.<br />
National Centre for Social Research<br />
RE-ALLOCATED ADDRESS/HOUSEHOLD : If this address/household is being reallocated to another interviewer before<br />
you have completed it, code here 90 END *<br />
DO NOT FORGET TO COMPLETE OBSERVATION & NON-RESPONSE FORMS<br />
Establish whether to interview at address<br />
IS THIS ADDRESS TRACEABLE, RESIDENTIAL, and<br />
OCCUPIED AS A MAIN RESIDENCE?<br />
CODE OUTCOME :<br />
Unknown eligibility<br />
359<br />
Yes A Go to Q6<br />
Unsure B Go to Q2<br />
OFFICE APPROVAL ONLY – Not attempted 61<br />
No C Go to Q4<br />
Office<br />
Refusal<br />
41 END *<br />
OFFICE APPROVAL ONLY – Inaccessible 62 END<br />
OFFICE APPROVAL ONLY – Unable to locate address 63<br />
Unknown whether address contains residential housing 64 Go to *<br />
Residential address – unknown whether occupied by eligible h'hold 65 Q3<br />
3. WAS THE INFORMATION ...<br />
Other unknown eligibility 67 Go to Q5<br />
...REFUSED 1<br />
or … DID YOU NOT MAKE CONTACT? 2<br />
Obs & END
4. CODE OUTCOME :<br />
National Centre for Social Research<br />
Deadwood<br />
OFFICE APPROVAL ONLY – Unable to locate / address doesn't exist 70<br />
Not yet built/under construction 71<br />
360<br />
Demolished/derelict 72<br />
Vacant/empty 73<br />
Non-residential address e.g. business, school, office, factory etc 74 END<br />
Address occupied, no resident household e.g.<br />
holiday/weekend homes<br />
Communal Establishment/Institution (no private dwellings) 76<br />
Residential, but no eligible respondent (no one aged 16+) 77<br />
5. RECORD REASONS FOR USING Code 67 or Code 79<br />
75<br />
Address out of sample 78<br />
Other Ineligible 79 Go to Q5<br />
Establish number of occupied households at address Select 3 if necessary<br />
6a. ESTABLISH NUMBER OF Households AT ADDRESS: WRITE IN HERE Go to b<br />
b. INTERVIEWER SUMMARY : No. of Households<br />
OR CODE: NON-CONTACT or INFORMATION REFUSED A<br />
Go to Q10<br />
1 household only A Go to Q8<br />
2-3 households B<br />
END<br />
Enter details at<br />
Q7b<br />
4-12 households C Go to Q7a<br />
13+ households: select THREE using look-up chart on p. 5 D Enter details at<br />
Q7b<br />
7a. IF 4-12 households, complete Q7a and Q7b<br />
List all households at address, in systematic order, e.g.<br />
• In flat/room number order<br />
• OR From bottom to top of building, left to right, front to back<br />
*
Description Selection<br />
Code<br />
National Centre for Social Research<br />
361<br />
Description Selection<br />
Code<br />
01 07<br />
02 08<br />
03 09<br />
04 10<br />
05 11<br />
06 12<br />
• Refer to the Household Selection label on front of the ARF, and select three households.<br />
• Ring the three households selected, in the grid above, and repeat their details at 7b. below.<br />
7b. ENTER DETAILS OF SELECTED HOUSEHOLDS:<br />
House<br />
hold<br />
1<br />
House<br />
hold<br />
2<br />
House<br />
hold<br />
3<br />
Selection<br />
Code<br />
(from Q7a)<br />
DETAILS/DESCRIPTION<br />
Is the address on the ARF label correct and complete for this household?<br />
If not, make necessary changes to the front of the ARF.<br />
Continue on this ARF (HH no. = 1)<br />
Complete ‘Additional Household’ ARF (HH no. = 2)<br />
Complete ‘Additional Household’ ARF (HH no. = 3)
National Centre for Social Research<br />
Seek contact with Householder and introduce survey<br />
Householder is an adult legally responsible for the accommodation, or their spouse/partner<br />
8.<br />
INTERVIEWER: Use grid on page 6 of ARF to keep track of information needed for pick-up:<br />
persons interviewed,<br />
diaries placed,<br />
diaries returned,<br />
vehicle questionnaires,<br />
362<br />
driving licences,<br />
special tickets or passes .<br />
SUMMARY: Any interview(s) achieved A Go to Q9<br />
No interview B Go to Q10<br />
Productive outcome- record details<br />
9. PLEASE CIRCLE OUTCOME CODE COMPUTED IN ADMIN BLOCK<br />
'Fully productive' cases MUST include a fully completed DIARY for EVERY household member, of all ages<br />
Fully productive : ALL desired respondent(s) in person<br />
Fully productive : partly by desired respondent(s), partly by proxy<br />
11<br />
12<br />
Go to Q13a<br />
Fully productive : by proxy 13<br />
Partial productive : desired respondent(s) 21<br />
Partial productive : partly by desired respondent(s), partly by proxy 22<br />
Partial productive : by proxy 23<br />
For all other outcomes, not computed in Admin Block, go to Q.10.<br />
END *
National Centre for Social Research<br />
Eligible address – unproductive outcome: CODE ONE ONLY<br />
10. NON-CONTACT:<br />
No contact with anyone at address 31<br />
REFUSAL:<br />
Contact made at address, but not with member of selected h'hold (MULTI-HH<br />
ONLY)<br />
Contact made at selected household, but not with any responsible member 33<br />
Information refused before selection complete (ie. no. of h'holds) (MULTI-HH<br />
ONLY)<br />
363<br />
32<br />
Obs,<br />
NR (postal),<br />
& END<br />
42 Obs & END<br />
DISCUSS WITH TRAVEL MANAGER - Refusal at introduction/ before interview 43 Go to Q11<br />
Refusal during interview (unproductive partial) 44<br />
Broken appointment – No recontact 45<br />
OTHER UNPRODUCTIVE:<br />
11. WAS THE REFUSAL BY ... CODE ONE ONLY<br />
Illness at home during survey period 51<br />
Absence from home / in hospital all survey period 52<br />
Physical or mental incapacity 53<br />
Obs, NR,<br />
& END<br />
Obs, NR,<br />
& END<br />
Language difficulties 54 Go to Q12<br />
OFFICE APPROVAL ONLY - Lost productive 55 END<br />
OFFICE APPROVAL ONLY - Other Unproductive 56 Go to Q12<br />
... THE DESIRED PERSON (Householder or spouse/partner) ? 1<br />
or BY PROXY (someone else) ? 2<br />
Go to Q12<br />
12. RECORD REASON FOR REFUSAL (CODE 43) OR USING LANGUAGE SPOKEN (Code 54) OR OTHER<br />
UNPRODUCTIVE (Code 56):<br />
Obs, NR<br />
& END<br />
*<br />
*<br />
*
Look-Up Chart for 13+ Households<br />
National Centre for Social Research<br />
If there are: 13 Households Select 8, 11, 13<br />
14 7, 6, 5<br />
15 8, 9, 5<br />
16 9, 16, 11<br />
17 11, 9, 16<br />
If there are: 18 Households Select 11, 6, 18<br />
19 13, 18, 7<br />
20 17, 1, 4<br />
21 16, 10, 2<br />
22 16, 4, 22<br />
23 19, 3, 22<br />
If there are: 24 Households Select 10, 19, 14<br />
25 23, 15, 4<br />
26 22, 20, 17<br />
27 14, 24, 25<br />
28 2, 17, 25<br />
29 19, 18, 4<br />
30 28, 7, 20<br />
PROMISSORY NOTE<br />
13a Did you complete and leave behind the promissory note for the incentive vouchers?<br />
13b Please explain why you did not leave the promissory note<br />
364<br />
Yes A END<br />
No B Go To<br />
Q13b<br />
END
National Centre for Social Research<br />
365
Observation Form<br />
National Centre for Social Research<br />
DO NOT RETURN THIS PAGE – ENTER IN ADMIN<br />
THEN DETACH BEFORE RETURNING ARF<br />
1. What kind of accommodation is it? 2. Did you - at any visit - observe a<br />
car in the drive?<br />
House or bungalow: Yes, car in driveway 1<br />
Detached 1 Go to<br />
No car in driveway 2<br />
Semi-detached 2 Q.2<br />
No driveway 3<br />
Terraced/End of terrace 3<br />
Flat or maisonette:<br />
In a purpose-built block 4<br />
Part of a converted house/other<br />
kind of building 5<br />
END 3. Does the house/bungalow have a<br />
garage or car-port?<br />
366<br />
Go to<br />
Q.3<br />
Room or rooms 6 END Yes 1<br />
Other: No 2 END<br />
A caravan or mobile home<br />
Houseboat<br />
7<br />
8<br />
END<br />
Not sure 3<br />
Some other kind of accommodation 9<br />
Non-Response Form for Refusals<br />
(if non-contact, leave postal version)
National Centre for Social Research<br />
1. How many cars or vans are owned, or available for use, by one or more<br />
members of your household, including yourself?<br />
Include any company car or van if available for private use.<br />
None 0<br />
367<br />
One 1<br />
Two 2<br />
Three or more 3<br />
2. Did the main householder do any paid work in the 7 days ending yesterday,<br />
either as an employee or as self-employed?<br />
Yes GO<br />
TO Q3<br />
1<br />
TO Q4<br />
3. How does the main householder usually travel to work?<br />
No GO<br />
This question applies to the job in which main householder usually works the most<br />
hours.<br />
Tick one box only for the longest part, by distance, of the main householder’s usual<br />
journey to work.<br />
01<br />
02<br />
03<br />
04<br />
05<br />
06<br />
07<br />
08<br />
09<br />
10<br />
Works mainly at or from home<br />
Underground, metro, light rail, tram<br />
Train<br />
Bus, minibus or coach<br />
Motor cycle, scooter or moped<br />
Car or van<br />
Taxi/Minicab<br />
Bicycle<br />
On foot<br />
Other<br />
2<br />
Please turn over
National Centre for Social Research<br />
DO NOT RETURN THIS PAGE – ENTER IN ADMIN<br />
THEN DETACH BEFORE RETURNING ARF<br />
Non-Response Form (continued)<br />
4. And now thinking about yourself, did you leave the house at all yesterday,<br />
including for any walks of more than 50 yards?<br />
GO TO Q5<br />
GO TO Q6<br />
5. How many times did you leave the house yesterday?<br />
Include all outings by any method of transport, including walks if they are more than<br />
50 yards.<br />
NUMBER OF TIMES LEFT HOME<br />
6. RECORD DAY OF THE WEEK FOR YESTERDAY.<br />
Mon Tue Wed Thur Fri Sat Sun<br />
1 2 3 4 5 6 7<br />
7. Could you just tell me how many people there are altogether in your<br />
household – including any children or babies?<br />
368<br />
Yes<br />
No<br />
TOTAL NUMBER IN HOUSEHOLD<br />
8. ASK OR RECORD: And how many of these people are aged 17 or over?<br />
NUMBER OF ADULTS AGED 17+<br />
9. ASK OR RECORD: And of those aged 17 or over, how many are men and how<br />
many are women?<br />
10. RECORD SEX OF RESPONDENT<br />
NUMBER OF MEN AGED 17+<br />
NUMBER OF WOMEN AGED 17+<br />
Male 1<br />
Female 2<br />
1<br />
2
National Centre for Social Research<br />
11. What is your relationship to the main householder?<br />
Tick one box only.<br />
369<br />
I am main householder END<br />
Husband, wife or partner 2<br />
Son, daughter, step-child, or foster child 3<br />
Brother or sister 4<br />
Mother, father, step-mother or step-father 5<br />
12. ASK OR RECORD: What is the main householder’s sex?<br />
Other related 6<br />
Unrelated 7<br />
Male 1<br />
Female 2<br />
1<br />
GO TO Q12<br />
END
National Centre for Social Research<br />
370
National Centre for Social Research<br />
APPENDIX L EXAMPLE TRAVEL WEEK ALLOCATION CARD<br />
NATIONAL TRAVEL SURVEY <strong>2003</strong> TRAVEL WEEK ALLOCATION CARD<br />
Point number: 30001 Postal sector: NG2 7<br />
Allocation period: 12 January to 11 February.<br />
Allocation Travel Week Allocated Target pick-up Notes<br />
period Start date End date Address dates<br />
(Day 1) (Day 7) Number<br />
(write in)<br />
1 Sat 12 Jan to Fri 18 Jan ...………. Sat 19 - Thu 24 .......……………….<br />
1 Sun 13 Jan to Sat 19 Jan ...………. Sun 20 - Fri 25 .......……………….<br />
1 Mon 14 Jan to Sun 20 Jan ...………. Mon 21 - Sat 26 .......……………….<br />
1 Wed 16 Jan to Tue 22 Jan ...………. Wed 23 - Mon 28 .......……………….<br />
1 Thu 17 Jan to Wed 23 Jan ...………. Thu 24 - Tue 29 .......……………….<br />
1 Fri 18 Jan to Thu 24 Jan ...………. Fri 25 - Wed 30 .......……………….<br />
2 Sat 19 Jan to Fri 25 Jan ...………. Sat 26 - Thu 31 .......……………….<br />
2 Sun 20 Jan to Sat 26 Jan ...………. Sun 27 - Fri 1 .......……………….<br />
2 Tue 22 Jan to Mon 28 Jan ...………. Tue 29 - Sun 3 .......……………….<br />
2 Weds 23 Jan to Tue 29 Jan ...………. Wed 30 - Mon 4 .......……………….<br />
2 Thu 24 Jan to Wed 30 Jan …………. Thu 31 - Tue 5 .......……………….<br />
2 Fri 25 Jan to Thu 31 Jan ...………. Fri 1 - Wed 6 .......……………….<br />
3 Sun 27 Jan to Sat 2 Feb ...………. Sun 3 - Fri 8 .......……………….<br />
3 Tue 29 Jan to Mon 4 Feb ...………. Tue 5 - Sun 10 .......……………….<br />
3 Wed 30 Jan to Tue 5 Feb ...………. Wed 6 - Mon 11 .......……………….<br />
3 Thu 31 Jan to Wed 6 Feb ...………. Thu 7 - Tue 12 .......……………….<br />
3 Fri 1 Feb to Thu 7 Feb ...………. Fri 8 - Wed 13 .......……………… .<br />
4 Sun 3 Feb to Sat 9 Feb ...………. Sun 10 - Fri 15 .......……………….<br />
4 Mon 4 Feb to Sun 10 Feb ...………. Mon 11 - Sat 16 .......……………….<br />
4 Wed 6 Feb to Tue 12 Feb ...………. Wed 13 - Mon 18 .......……………….<br />
4 Fri 8 Feb to Thu 14 Nov ...………. Fri 15 - Wed 20 .......……………….<br />
4 Sun 10 Feb to Sat 16 Feb ...………. Sun 17 - Fri 22 .......……………….<br />
Multi-households : Try to assign the same Travel Week to all households at the address. If this is not<br />
possible, then assign a Travel Week starting on the same day of the week as the other households. If<br />
you wish, record additional household Travel Weeks here:<br />
Travel Week Address Household Target pick-up Notes<br />
Start date End date Number Number dates<br />
………… …………. ……….. .. ……… ………………… ……………………..<br />
………… …………. ……….. .. ……… ………………… ……………………..<br />
IF YOU RUN OUT OF TRAVEL WEEKS,<br />
CALL THE NTS FIELD UNIT FOR ADVICE ON 01277 69013<br />
371
National Centre for Social Research<br />
372
APPENDIX M PROMISSORY NOTE<br />
National Centre for Social Research<br />
National Travel Survey <strong>2003</strong><br />
As a way of saying thank you to everyone in your household for completing the<br />
National Travel Survey, NatCen promises to send you _____ £5 gift vouchers.<br />
You do not have to do anything to claim your gift vouchers. They will be sent to you<br />
automatically and you should receive them within 4 weeks. If you do not receive the<br />
vouchers, please contact Marian Bolden or Sue Hobbs at NatCen on 01277 690043.<br />
Once again, thank you for taking part in the National Travel Survey <strong>2003</strong>. The<br />
information collected from you will be used to produce statistics on travelling in Great<br />
Britain and will help with future transport plans and policies.<br />
________________________________ (Interviewer) _ _ /_ _ /_ _<br />
(Date)<br />
P2320<br />
373