

Hawkesbury-Nepean River Environmental Monitoring Program
Hawkesbury-Nepean River Environmental Monitoring Program
Hawkesbury-Nepean River Environmental Monitoring Program

Create successful ePaper yourself
Turn your PDF publications into a flip-book with our unique Google optimized e-Paper software.
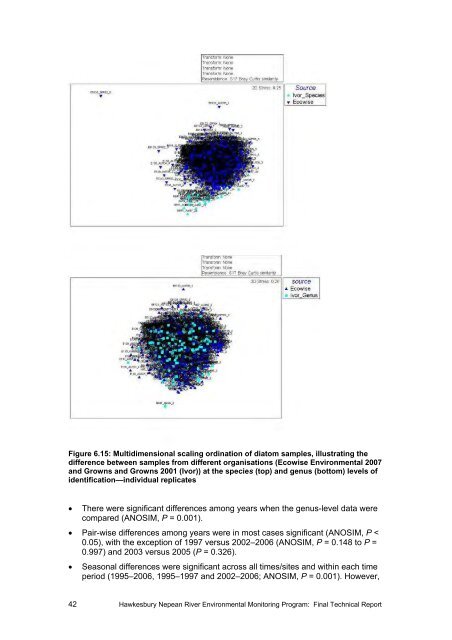
Figure 6.15: Multidimensional scaling ordination of diatom samples, illustrating the<br />
difference between samples from different organisations (Ecowise <strong>Environmental</strong> 2007<br />
and Growns and Growns 2001 (Ivor)) at the species (top) and genus (bottom) levels of<br />
identification—individual replicates<br />
• There were significant differences among years when the genus-level data were<br />
compared (ANOSIM, P = 0.001).<br />
• Pair-wise differences among years were in most cases significant (ANOSIM, P <<br />
0.05), with the exception of 1997 versus 2002–2006 (ANOSIM, P = 0.148 to P =<br />
0.997) and 2003 versus 2005 (P = 0.326).<br />
• Seasonal differences were significant across all times/sites and within each time<br />
period (1995–2006, 1995–1997 and 2002–2006; ANOSIM, P = 0.001). However,<br />
42 <strong>Hawkesbury</strong> <strong>Nepean</strong> <strong>River</strong> <strong>Environmental</strong> <strong>Monitoring</strong> <strong>Program</strong>: Final Technical Report


