ANTENNA AMPLIFIER 88-108MHz - EIT
ANTENNA AMPLIFIER 88-108MHz - EIT
ANTENNA AMPLIFIER 88-108MHz - EIT

You also want an ePaper? Increase the reach of your titles
YUMPU automatically turns print PDFs into web optimized ePapers that Google loves.
<strong>ANTENNA</strong> <strong>AMPLIFIER</strong> <strong>88</strong>-<strong>108MHz</strong><br />
<strong>ANTENNA</strong> <strong>AMPLIFIER</strong> <strong>88</strong>-<strong>108MHz</strong><br />
Radio Project 2011<br />
Department of Electrical and Information Technology, Lund University<br />
Supervisor: Göran Jönsson<br />
Submitted<br />
By<br />
VINOTH KANNAN ILAMURUGAN<br />
SREEJITH PALLEEKUVEEDU RAGHAVAN<br />
1
<strong>ANTENNA</strong> <strong>AMPLIFIER</strong> <strong>88</strong>-<strong>108MHz</strong><br />
Acknowledgements<br />
We would like to thank Göran Jönsson, Dept. of Electrical and Information<br />
Technology, Lund University, for his guidance during this project. We would<br />
also like to thank Lars Hedenstjerna, Dept. of Electrical and Information<br />
Technology, Lund University, for the construction of the PCB.<br />
2
<strong>ANTENNA</strong> <strong>AMPLIFIER</strong> <strong>88</strong>-<strong>108MHz</strong><br />
Abstract<br />
The project describes the design work of a low noise amplifier with image<br />
rejection filter. The amplifier is designed to be used as an input stage of a<br />
superhetrodyne receiver for the FM radio (<strong>88</strong>‐108 MHz).The report describes<br />
the approach and result from MATLAB and the practical measurements are<br />
presented and analyzed. The practical measurement such as Gain, Noise<br />
Figure and Image rejections from the analyzer are compared with the design<br />
specification of low noise amplifier and it was almost fulfilled with the design<br />
specifications.<br />
3
<strong>ANTENNA</strong> <strong>AMPLIFIER</strong> <strong>88</strong>-<strong>108MHz</strong><br />
Contents<br />
1. Introduction………………………………………………......................................5<br />
2. Design Specification……………………………………………………………….5<br />
3. Theory……………………………………………………………………………...5<br />
3.1 Image Rejection………………………………………………………………5<br />
3.2 Design procedure……………………………………………………………..5<br />
3.3 Choice of transistor…………………………………………………………..6<br />
3.4 Stability, Gain and Noise Behaviour………………………………………....8<br />
3.5 Image rejection……………………………………………………………….8<br />
3.6 Transistor Biasing……………………………………………………………9<br />
4. Circuit diagram………………………………………………………………… 10<br />
5. PCB Layout………………………………………………………………….......10<br />
6. Measurement and Results…………………………………………………........11<br />
6.1 S-parameter measurement…………………………………………………12<br />
6.2 Compression point measurement………………………………………….12<br />
6.3 Noise figure measurement………………………………………………….13<br />
6.4 Bandwidth…………………………………………………………………...14<br />
6.5 Image Rejection……………………………………………………………..14<br />
7. Conclusions………………………………………………………………………15<br />
8. Reference…………………………………………………………………………15<br />
4
1. Introduction<br />
<strong>ANTENNA</strong> <strong>AMPLIFIER</strong> <strong>88</strong>-<strong>108MHz</strong><br />
The Low Noise Amplifier is the first building block in a FM receiver. The<br />
characteristics of amplifier are its low noise figure and high gain. A high gain<br />
and low noise minimizes the impact of noise in subsequent stages and<br />
therefore determines the total noise factor according to the Friss formula. It<br />
was designed to be an input stage for a superhetrodyne FM receiver and<br />
should be able to work within the specified frequency band <strong>88</strong>‐108 MHz.<br />
Except for the LNA itself it contains several filters to fulfill the specifications<br />
of pre‐selection and image rejection. For the construction procedure the<br />
MATLAB deslib toolbox was used, the layout was created in a PCB tool<br />
Eagle and measurements was performed with the Network and Spectrum<br />
Analyzer.<br />
2. Design Specification<br />
Operating frequency: <strong>88</strong>-<strong>108MHz</strong>.<br />
Noise figure: F ≤ Fmin + 2dB.<br />
Gain: G ≥ |S21| 2 .<br />
Source impedance: 50Ω.<br />
Load impedance: 50Ω.<br />
Image rejection ≥ 20 dB.<br />
VCC= 12V.<br />
3.Theory<br />
3.1 Image Rejection:<br />
When the modulated signal shall be converted from the carrier frequency to the<br />
intermediate frequency the signal can be mixed with a signal from the Local<br />
Oscillator. The output frequency from the mixer consists of fmixer=(fsignal+fLO)<br />
and (fsignal-fLO). The last term is the down converted signal. The problem is that<br />
there is another frequency that also will be down transformed and will overlap<br />
with the wanted signal. This frequency is called image frequency and must be<br />
filtered out before the mixing stage. If high‐side injection is used the image<br />
frequency is located at fsignal + 2 (fLO-fsignal). In the FM receiver this frequency is<br />
fsignal+ 2*10.7 MHz.<br />
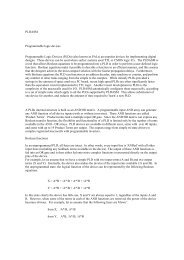
3.2 Design Procedure:<br />
The design of amplifiers with respect to gain using lossless matching networks<br />
to obtain the desired result. Typically, the source and the load that we want to<br />
connect to the two-port are fixed and if we are connecting directly to the twoport<br />
we will not get the desired gain and noise figure. So a matching network<br />
5
<strong>ANTENNA</strong> <strong>AMPLIFIER</strong> <strong>88</strong>-<strong>108MHz</strong><br />
is connected between the source and the two-port and between the load and<br />
the two-port respectively. In our design there is no need for the input matching<br />
network. So the Low Noise Amplifier contain a transistor, output matching<br />
network between the transistor and the output for the next stage and a filter<br />
circuit for selecting the frequency band and removing the image frequency.<br />
Figure 1 shows the block diagram of low noise amplifier.<br />
3.3 Choice of transistor:<br />
Figure 1: Block diagram of LNA<br />
The first step in the design is to choose a proper transistor. We selected<br />
BFG520X because of its high power gain, low noise figure, and high<br />
transition frequency and all the design specification of LNA are fulfilled with<br />
this transistor.<br />
Figure 2-Gain Vs Collector Current Figure 3- Gain Vs Frequency<br />
6
Figure 4-Intermodulation distortion<br />
Vs collector current<br />
Figure 6-Minimum Noise figure and gain<br />
as a function of collector current<br />
<strong>ANTENNA</strong> <strong>AMPLIFIER</strong> <strong>88</strong>-<strong>108MHz</strong><br />
The choice of bias point was made with help of the transistor data sheet. The<br />
bias point VCE= 6V and IC= 10mA was chosen. This was a good compromise<br />
between the added noise and the transistor gain. We selected to choose the<br />
7<br />
Figure 5 - 2 nd order Intermodulation<br />
distortion Vs collector current<br />
Figure 7-Minimum Noise figure and gain<br />
as a function of Frequency
<strong>ANTENNA</strong> <strong>AMPLIFIER</strong> <strong>88</strong>-<strong>108MHz</strong><br />
transistor in Common Emitter (CE) configuration which gives gain in both<br />
current and voltage.<br />
3.4 Stability, Gain and Noise Behavior:<br />
To see if the specifications of the LNA are fulfilled, we have plotted the<br />
output stability circle, input stability circle, gain circle and noise circle for a<br />
chosen bias point with measured S-parameters and the transistor was<br />
conditionally stable and could be stable if S and OUT are chosen in the stable<br />
regions. Different input reflection coefficients was tested and S (ZS=50-j50Ω)<br />
which give L=OUT* (ZL=) was finally chosen.OUT* was located close to the<br />
output stability circle. Figure 8 shows the plot.<br />
Red-Input Stability Circle, Blue-Output Stability Circle, Magenta-Noise Circle, Green-Gain Circle<br />
3.5 Image Rejection Filter<br />
Figure 8<br />
The image rejection filter was used at the output of the amplifier to filter out<br />
the image signals. The constructed filter consists of three components. One<br />
capacitor and two inductors. During the signal frequency the parallel circuits<br />
has maximum impedance and consist of L2 and C2.At the image frequency the<br />
series circuit consisting of L1 and C2 has minimum impedance and forces the<br />
8
<strong>ANTENNA</strong> <strong>AMPLIFIER</strong> <strong>88</strong>-<strong>108MHz</strong><br />
frequency directly to ground. The designing of inductors and capacitors as<br />
follows.<br />
F01=<br />
F02=<br />
=98MHZ C2=10pF, L2=263nF<br />
=fsignal+2*fIF =119.4MHz C2=10pF and L1 =177.5nF.<br />
The capacitor C2 used will be a variable capacitor and the value of the<br />
capacitor is adjusted in such a way that the output will have maximum gain.<br />
3.6 Transistor Biasing:<br />
The biasing circuitry forces a device into a desired operating point in terms of<br />
DC terminal voltages and currents. Once the parameter set has been chosen<br />
matching networks can be designed to obtain the desired gain and noise figure<br />
etc and after that the biasing circuitry is designed to obtain the desired<br />
voltages and currents associated with the parameter set chosen. The biasing<br />
circuitry must be designed in such a way that it does not change gain, noise<br />
figure and stability of the design.<br />
Let VCC=12V and VCE=6V and IC=10mA from the data sheet.<br />
0=120 for BFG520X<br />
VBE=0.7V;<br />
ID=IC/ ; where ID is the current through RB2 and VD is the voltage across<br />
RB2.<br />
IB=ID/ ;<br />
RC= (VCC-VCE)/(IC+ID+IB);<br />
RC=560Ω<br />
VD=2*VBE; Two times voltage drop across the pn junction<br />
RB1= (VCE-VD)/ (ID+IB);<br />
RB1=4.7K<br />
RB3= (VD-VBE)/IB;<br />
RB3=8.2K<br />
RB2=VD/ID;<br />
RB2=1.5K<br />
9
4. Circuit Diagram:<br />
5. PCB Layout:<br />
<strong>ANTENNA</strong> <strong>AMPLIFIER</strong> <strong>88</strong>-<strong>108MHz</strong><br />
Figure 9-Antenna Amplifier<br />
Figure 10-Layout of Antenna Amplifier<br />
10
<strong>ANTENNA</strong> <strong>AMPLIFIER</strong> <strong>88</strong>-<strong>108MHz</strong><br />
6. Measurement and Results:<br />
The S-parameters are used for the calculations of stability of the transistor in<br />
the operating condition, using these S-parameters measured for the frequency<br />
100MHz with the help of MATLAB on the Smith chart stability, gain and<br />
noise circles are calculated. The setup for the measurement of S-parameters is<br />
shown in figure 11[4].<br />
Figure 11-Setup for measuring S-Parameter<br />
11
<strong>ANTENNA</strong> <strong>AMPLIFIER</strong> <strong>88</strong>-<strong>108MHz</strong><br />
6.1. S-parameter measurement:<br />
Figure 12<br />
From the S21 measurement the gain of the amplifier is found as 23.8dB.<br />
6.2 Compression point measurement:<br />
The compression point shows the amplifier to have high performance and a<br />
wide dynamic range. 1 dB compression point of the amplifier is measured by<br />
applying the signal at 103MHz and by varying the RF input power,CP1 was<br />
measured as -23dBm.OIP3 of the amplifier is measured by applying a two<br />
tone at 102MHz and 103MHz.The third order intermodulation tones were<br />
observed at 101MHz and 104MHz.OIP3 was found as -9dBm.<br />
12
<strong>ANTENNA</strong> <strong>AMPLIFIER</strong> <strong>88</strong>-<strong>108MHz</strong><br />
6.3 Noise figure measurement:<br />
The noise figure was measured to be 1.6dB. It is almost constant for the entire<br />
frequency range. Figure 13 shows a Peak in Noise figure at 107.5MHz due to<br />
the interference from the broadcasting station. So the noise measurements was<br />
performed in the shielded room and the results obtained is shown in figure 14<br />
Figure 13<br />
Figure 15-Noise Figure measured in shielded room<br />
Figure 14-Noise figure measured in shielded room<br />
13
6.4 Bandwidth:<br />
<strong>ANTENNA</strong> <strong>AMPLIFIER</strong> <strong>88</strong>-<strong>108MHz</strong><br />
Figure 16-Bandwidth of the Amplifier<br />
We observed that amplifier provides wide bandwidth; it may cause problems<br />
for the out of band signals. But we have a good image rejection filter; it will<br />
filter out the image signals.<br />
6.5 Image Rejection:<br />
Image rejection capability of the amplifier is measured as 19.61dB. For the<br />
input RF signal at <strong>88</strong>MHz, Image signal is observed at 109.5MHz.Measured<br />
result is shown in figure 17.<br />
Figure 17-Image Rejection<br />
14
7. Conclusion:<br />
<strong>ANTENNA</strong> <strong>AMPLIFIER</strong> <strong>88</strong>-<strong>108MHz</strong><br />
The designed circuit fulfilled the design specification but there are some<br />
improvements for the output matching circuit should be performed. The<br />
choice of bias point should be selected more carefully to avoid problems with<br />
stability. The image rejection filter is designed for rejecting the image<br />
frequency, which fulfilled the design requirement of 20dB.<br />
8. References:<br />
1. L. Sundström, G. Jönsson and H. Börjeson, “Radio Electronics”.<br />
2. http://www.nxp.com<br />
3. Youtube lectures about Eagle Software<br />
4. http://www.eit.lth.se/fileadmin/eit/courses/eti041/VT2010/01a.pdf<br />
15