PDF format (503 kB) - ECN
PDF format (503 kB) - ECN
PDF format (503 kB) - ECN

Create successful ePaper yourself
Turn your PDF publications into a flip-book with our unique Google optimized e-Paper software.
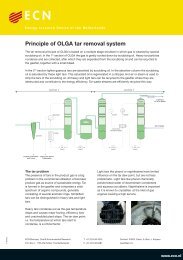
MARKAL represents all activities that are necessary to provide a fixed set of products and services. Products<br />
and services can be generated through a number of alternative (sets of) processes. The model contains a database<br />
of several hundred processes, covering the whole life cycle for both energy and materials. The model calculates<br />
the least-cost system configuration.<br />
The database of processes and the constraints for individual processes and for the whole region are defined by<br />
the model user. Constraints are determined by the demand for products and services, the maximum introduction<br />
rate of new processes, the availability of resources, environmental policy goals for energy use and for emissions<br />
etcetera. All environmental impacts are endogenised into the process costs and into the costs of energy<br />
and matter flows between processes.<br />
MARKAL is a dynamic model. The time span to be modeled is divided into seven periods of equal length,<br />
covering the period 1990-2050. Changing technology is modeled through changing parameters in time for<br />
individual processes. The future availability of new alternative processes is modeled separately. The model is<br />
used to calculate the least-cost system configuration for the whole time period, meeting exogenously defined<br />
product and service demands and meeting emission reduction targets. This optimization is based on a so-called<br />
‘perfect foresight’ approach, where all time periods are simultaneously optimized. Future constraints are taken<br />
into account in current investment decisions.<br />
The model contains approximately 50 energy carriers, 125 materials, 100 product service categories and 32<br />
types of waste materials. The whole system consists of several hundred processes. A detailed description of the<br />
model input parameters for processes, materials and products can be found in separate reports.<br />
[8,9,10,11,12,13,14,15,16,17]<br />
Different GHG emission penalties have been analyzed. These penalties are shown in Figure 5. The base case is<br />
run without penalties. In the emission reduction cases, the penalties increase from zero in the year 2000 to their<br />
maximum level in 2020 and stabilize afterwards.<br />
[ECU/T CO2]<br />
200<br />
150<br />
100<br />
50<br />
"200 ECU/T CO2"<br />
"100 ECU/T CO2"<br />
"50 ECU/T CO2"<br />
"20 ECU/T CO2"<br />
0<br />
1990 2000 2010 2020<br />
[YEAR]<br />
2030 2040 2050<br />
Figure 5 GHG emission penalty scenarios