PDF format (503 kB) - ECN
PDF format (503 kB) - ECN
PDF format (503 kB) - ECN

Create successful ePaper yourself
Turn your PDF publications into a flip-book with our unique Google optimized e-Paper software.
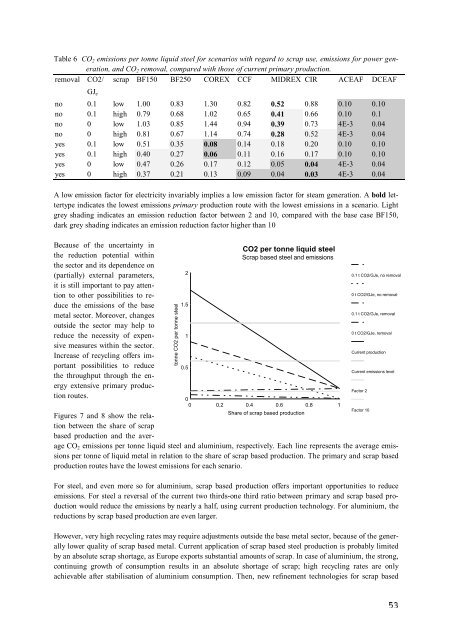
Table 6 CO2 emissions per tonne liquid steel for scenarios with regard to scrap use, emissions for power generation,<br />
and CO2 removal, compared with those of current primary production.<br />
removal CO2/ scrap BF150 BF250 COREX CCF MIDREX CIR ACEAF DCEAF<br />
no<br />
GJe<br />
0.1 low 1.00 0.83 1.30 0.82 0.52 0.88 0.10 0.10<br />
no 0.1 high 0.79 0.68 1.02 0.65 0.41 0.66 0.10 0.1<br />
no 0 low 1.03 0.85 1.44 0.94 0.39 0.73 4E-3 0.04<br />
no 0 high 0.81 0.67 1.14 0.74 0.28 0.52 4E-3 0.04<br />
yes 0.1 low 0.51 0.35 0.08 0.14 0.18 0.20 0.10 0.10<br />
yes 0.1 high 0.40 0.27 0.06 0.11 0.16 0.17 0.10 0.10<br />
yes 0 low 0.47 0.26 0.17 0.12 0.05 0.04 4E-3 0.04<br />
yes 0 high 0.37 0.21 0.13 0.09 0.04 0.03 4E-3 0.04<br />
A low emission factor for electricity invariably implies a low emission factor for steam generation. A bold lettertype<br />
indicates the lowest emissions primary production route with the lowest emissions in a scenario. Light<br />
grey shading indicates an emission reduction factor between 2 and 10, compared with the base case BF150,<br />
dark grey shading indicates an emission reduction factor higher than 10<br />
Because of the uncertainty in<br />
the reduction potential within<br />
the sector and its dependence on<br />
(partially) external parameters,<br />
it is still important to pay attention<br />
to other possibilities to reduce<br />
the emissions of the base<br />
metal sector. Moreover, changes<br />
outside the sector may help to<br />
reduce the necessity of expensive<br />
measures within the sector.<br />
Increase of recycling offers important<br />
possibilities to reduce<br />
the throughput through the energy<br />
extensive primary production<br />
routes.<br />
tonne CO2 per tonne steel<br />
2<br />
1.5<br />
1<br />
0.5<br />
CO2 per tonne liquid steel<br />
Scrap based steel and emissions<br />
0<br />
0 0.2 0.4 0.6 0.8 1<br />
Share of scrap based production<br />
0.1 t CO2/GJe, no removal<br />
0 t CO2/GJe, no removal<br />
0.1 t CO2/GJe, removal<br />
0 t CO2/GJe, removal<br />
Current production<br />
Current emissions level<br />
Figures 7 and 8 show the relation<br />
between the share of scrap<br />
based production and the average<br />
CO2 emissions per tonne liquid steel and aluminium, respectively. Each line represents the average emissions<br />
per tonne of liquid metal in relation to the share of scrap based production. The primary and scrap based<br />
production routes have the lowest emissions for each senario.<br />
For steel, and even more so for aluminium, scrap based production offers important opportunities to reduce<br />
emissions. For steel a reversal of the current two thirds-one third ratio between primary and scrap based production<br />
would reduce the emissions by nearly a half, using current production technology. For aluminium, the<br />
reductions by scrap based production are even larger.<br />
However, very high recycling rates may require adjustments outside the base metal sector, because of the generally<br />
lower quality of scrap based metal. Current application of scrap based steel production is probably limited<br />
by an absolute scrap shortage, as Europe exports substantial amounts of scrap. In case of aluminium, the strong,<br />
continuing growth of consumption results in an absolute shortage of scrap; high recycling rates are only<br />
achievable after stabilisation of aluminium consumption. Then, new refinement technologies for scrap based<br />
Factor 2<br />
Factor 10