PDF format (503 kB) - ECN
PDF format (503 kB) - ECN
PDF format (503 kB) - ECN

You also want an ePaper? Increase the reach of your titles
YUMPU automatically turns print PDFs into web optimized ePapers that Google loves.
Table 1 gives an overview of improvement options which might be relevant for the reduction of the total energy<br />
use and emissions from passenger transport. The division in four categories gives some indication of the difficulties<br />
that may occur in implementing these options. This paper will not analyse thoroughly these implementation<br />
barriers, nor the costs associated with them.<br />
Calculation of the reduction potential<br />
The in<strong>format</strong>ion presented in table 1 can be used to calculate the energy reduction potential of passenger transport.<br />
Our goal is to calculate values for 2020 and 2050. To calculate the 2020 reduction potential, the 2015 values<br />
are used. For the calculation of the 2050 reduction potential, only limited in<strong>format</strong>ion is available. The values<br />
presented in (Ybema et al., 1995) have 2030 as a time horizon. For these options, no extra assumptions are<br />
made on extra saving potentials, which means that the 2030 value is used if no 2050 reduction potential is<br />
given. The total reduction potential can be calculated by multiplying the efficiencies of the various techniques.<br />
In case of a 850 kg passenger car with a modified frame, the efficiency results for 2000 in (1-0.14)*(1-0.15) =<br />
0.73. This means that the combination of these two options results in a 27 % reduction of the energy use.<br />
This section presents the reduction potential per category of improvement options. Reduction percentages are<br />
based calculated compared to the 2.3 MJ per passenger kilometre of the standard 1990 petrol passenger car.<br />
Implementing category 1 improvement options.<br />
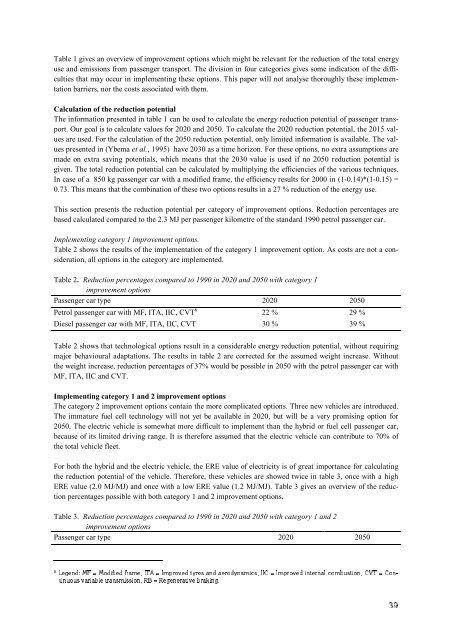
Table 2 shows the results of the implementation of the category 1 improvement option. As costs are not a consideration,<br />
all options in the category are implemented.<br />
Table 2. Reduction percentages compared to 1990 in 2020 and 2050 with category 1<br />
improvement options<br />
Passenger car type 2020 2050<br />
Petrol passenger car with MF, ITA, IIC, CVT 6<br />
22 % 29 %<br />
Diesel passenger car with MF, ITA, IIC, CVT 30 % 39 %<br />
Table 2 shows that technological options result in a considerable energy reduction potential, without requiring<br />
major behavioural adaptations. The results in table 2 are corrected for the assumed weight increase. Without<br />
the weight increase, reduction percentages of 37% would be possible in 2050 with the petrol passenger car with<br />
MF, ITA, IIC and CVT.<br />
Implementing category 1 and 2 improvement options<br />
The category 2 improvement options contain the more complicated options. Three new vehicles are introduced.<br />
The immature fuel cell technology will not yet be available in 2020, but will be a very promising option for<br />
2050. The electric vehicle is somewhat more difficult to implement than the hybrid or fuel cell passenger car,<br />
because of its limited driving range. It is therefore assumed that the electric vehicle can contribute to 70% of<br />
the total vehicle fleet.<br />
For both the hybrid and the electric vehicle, the ERE value of electricity is of great importance for calculating<br />
the reduction potential of the vehicle. Therefore, these vehicles are showed twice in table 3, once with a high<br />
ERE value (2.0 MJ/MJ) and once with a low ERE value (1.2 MJ/MJ). Table 3 gives an overview of the reduction<br />
percentages possible with both category 1 and 2 improvement options.<br />
Table 3. Reduction percentages compared to 1990 in 2020 and 2050 with category 1 and 2<br />
improvement options<br />
Passenger car type 2020 2050