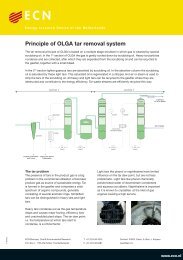
PDF format (503 kB) - ECN
PDF format (503 kB) - ECN
PDF format (503 kB) - ECN

Create successful ePaper yourself
Turn your PDF publications into a flip-book with our unique Google optimized e-Paper software.
A decrease of the vehicle size may also contribute to energy savings, because lighter cars have a higher fuel<br />
economy, especially for frequent stop and drive situations. Introducing small passenger cars requires large<br />
behavioural adaptations, as this counteracts the current trends in the development of vehicle weight (see<br />
figure 2). Driving a 850 kg passenger car in stead of the standard 1000 kg passenger car increases the fuel<br />
economy with 9 per cent (Bouwman and Moll, 1997). For this small vehicle, no weight increases are assumed.<br />
As the weight difference in vehicle size between the standard and the 850 kg passenger cars increases<br />
over time, the advantage in fuel economy also increases over time.<br />
Another method to decrease the energy use per passenger kilometre is to increase the occupancy rate of a<br />
vehicle. By a doubling of the occupancy rate, the energy use per passenger kilometre halves. Since this option<br />
requires large adaptations from the individual user, this option will be hard to realise. Implementing<br />
this option should probably be accompanied by an increased share for public transport, to cover the individual<br />
trips which cannot be combined with other individual trips by passenger car.<br />
4. Mobility reducing options<br />
Next to the options mentioned above, which do not influence the total demand of passenger kilometres,<br />
measures can be taken to reduce the individual mobility demand. A higher population density may reduce<br />
commuter travel and the construction of new roads may result in shorter routings. An increase of the use of<br />
soft modes may also be used as such an improvement option. Since the absolute reduction potential is calculated<br />
per passenger kilometre, the reduction of the number of kilometres is irrelevant. The changes in individual<br />
mobility demand are considered as scenario parameters and will be used for the final calculation of<br />
the absolute reduction potential for the passenger transport sector. Table 1 gives an overview of the expected<br />
energy efficiencies. Only the effect of individual options is shown. Various options may be combined,<br />
to improve the total reduction.<br />
Table 1. Energy reduction of various improvement options<br />
Improvement option 2000 2015 2030 2050<br />
Improve internal combustion Otto 5 % 17 % 23 %<br />
engine a<br />
Improve internal combustion diesel engine a 5 % 20 % 30 %<br />
Improve tyres and aerodynamics a<br />
3 % 4 % 5 %<br />
Introduce continuous variable<br />
3 % 5 % 7 %<br />
transmission a<br />
Introduce modified frame b<br />
3 a<br />
Introduce the electric vehicle<br />
Introduce regenerative braking a<br />
4 a<br />
Introduce the hybrid passenger car<br />
Introduce the fuel cell passenger car a<br />
Change modal split c<br />
Increase vehicle lifetime b<br />
b, c<br />
Drive 850 kg vehicles<br />
Double occupancy rate c<br />
Source: ( a Ybema et al., 1995; b Bouwman and Moll, 1997; and c calculations described in text)<br />
14 % 16 % 17 % 19 %<br />
47 % 59 % 67 % 70 %<br />
0 % 3 % 5 %<br />
3 % 33 % 35 %<br />
NA NA 60 %<br />
61 % 5<br />
73 %<br />
2 % 2 % 2 % 2 %<br />
15 % 20 % 21 % 22 %<br />
50 % 50 % 50 % 50 %