PDF format (503 kB) - ECN
PDF format (503 kB) - ECN
PDF format (503 kB) - ECN

Create successful ePaper yourself
Turn your PDF publications into a flip-book with our unique Google optimized e-Paper software.
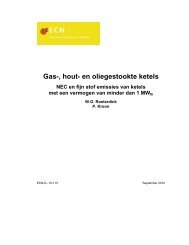
[MT CO2 EQUIV./YEAR]<br />
5,000<br />
4,000<br />
3,000<br />
2,000<br />
1,000<br />
NOT COVERED<br />
0<br />
1990 2000 2010 2020<br />
[YEAR]<br />
2030 2040 2050<br />
Figure 6 Base case GHG emissions for the energy system and the integrated energy and materials system<br />
(E+M)<br />
The emission reduction for the integrated energy and materials system (E+M) is shown in Figure 7. The figure<br />
shows that a reduction of the total GHG emissions from 4500 Mt to less than 1000 Mt in 2030 is achieved if a<br />
(high) penalty of 500 ECU/t CO2 equivalent is introduced. This is a reduction of more than 75%. This result<br />
shows that a factor 4 emission reduction is possible, even in a situation with growing demand. The emission<br />
penalty may seem unlikely high, but the factor 4 emission reduction is an ultimate goal for industrialized countries<br />
in order to minimize the risk for major climate change.<br />
Note the high contribution of CO2 to the total GHG emissions in the base case. Autonomous developments reduce<br />
emissions of other GHGs (e.g. the closure of the German and UK coal mines and the reduction of waste<br />
disposal).<br />
[MT CO2 EQUIV./YEAR]<br />
5,000<br />
4,000<br />
3,000<br />
2,000<br />
1,000<br />
0<br />
BC<br />
50 ECU/T CO2 200 ECU/T CO2<br />
20 ECU/T CO2 100 ECU/T CO2 500 ECU/T CO2<br />
Figure 7 Changing GHG emissions with increasing emission penalties, 2030<br />
IMPORTS<br />
PFC<br />
N2O<br />
CH4<br />
CO2<br />
E+M<br />
E