Chemical Assay of Urea for Automated Sensing in Milk - ctahr
Chemical Assay of Urea for Automated Sensing in Milk - ctahr
Chemical Assay of Urea for Automated Sensing in Milk - ctahr
Create successful ePaper yourself
Turn your PDF publications into a flip-book with our unique Google optimized e-Paper software.
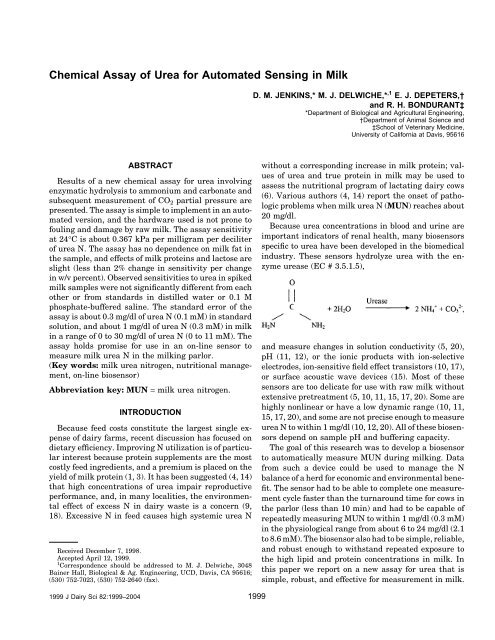
<strong>Chemical</strong> <strong>Assay</strong> <strong>of</strong> <strong>Urea</strong> <strong>for</strong> <strong>Automated</strong> <strong>Sens<strong>in</strong>g</strong> <strong>in</strong> <strong>Milk</strong><br />
ABSTRACT<br />
Results <strong>of</strong> a new chemical assay <strong>for</strong> urea <strong>in</strong>volv<strong>in</strong>g<br />
enzymatic hydrolysis to ammonium and carbonate and<br />
subsequent measurement <strong>of</strong> CO 2 partial pressure are<br />
presented. The assay is simple to implement <strong>in</strong> an automated<br />
version, and the hardware used is not prone to<br />
foul<strong>in</strong>g and damage by raw milk. The assay sensitivity<br />
at 24°C is about 0.367 kPa per milligram per deciliter<br />
<strong>of</strong> urea N. The assay has no dependence on milk fat <strong>in</strong><br />
the sample, and effects <strong>of</strong> milk prote<strong>in</strong>s and lactose are<br />
slight (less than 2% change <strong>in</strong> sensitivity per change<br />
<strong>in</strong> w/v percent). Observed sensitivities to urea <strong>in</strong> spiked<br />
milk samples were not significantly different from each<br />
other or from standards <strong>in</strong> distilled water or 0.1 M<br />
phosphate-buffered sal<strong>in</strong>e. The standard error <strong>of</strong> the<br />
assay is about 0.3 mg/dl <strong>of</strong> urea N (0.1 mM) <strong>in</strong> standard<br />
solution, and about 1 mg/dl <strong>of</strong> urea N (0.3 mM) <strong>in</strong> milk<br />
<strong>in</strong> a range <strong>of</strong> 0 to 30 mg/dl <strong>of</strong> urea N (0 to 11 mM). The<br />
assay holds promise <strong>for</strong> use <strong>in</strong> an on-l<strong>in</strong>e sensor to<br />
measure milk urea N <strong>in</strong> the milk<strong>in</strong>g parlor.<br />
(Key words: milk urea nitrogen, nutritional management,<br />
on-l<strong>in</strong>e biosensor)<br />
Abbreviation key: MUN = milk urea nitrogen.<br />
INTRODUCTION<br />
Because feed costs constitute the largest s<strong>in</strong>gle expense<br />
<strong>of</strong> dairy farms, recent discussion has focused on<br />
dietary efficiency. Improv<strong>in</strong>g N utilization is <strong>of</strong> particular<br />
<strong>in</strong>terest because prote<strong>in</strong> supplements are the most<br />
costly feed <strong>in</strong>gredients, and a premium is placed on the<br />
yield <strong>of</strong> milk prote<strong>in</strong> (1, 3). It has been suggested (4, 14)<br />
that high concentrations <strong>of</strong> urea impair reproductive<br />
per<strong>for</strong>mance, and, <strong>in</strong> many localities, the environmental<br />
effect <strong>of</strong> excess N <strong>in</strong> dairy waste is a concern (9,<br />
18). Excessive N <strong>in</strong> feed causes high systemic urea N<br />
Received December 7, 1998.<br />
Accepted April 12, 1999.<br />
1 Correspondence should be addressed to M. J. Delwiche, 3048<br />
Ba<strong>in</strong>er Hall, Biological & Ag. Eng<strong>in</strong>eer<strong>in</strong>g, UCD, Davis, CA 95616;<br />
(530) 752-7023, (530) 752-2640 (fax).<br />
1999 J Dairy Sci 82:1999–2004 1999<br />
D. M. JENKINS,* M. J. DELWICHE,* ,1 E. J. DEPETERS,†<br />
and R. H. BONDURANT‡<br />
*Department <strong>of</strong> Biological and Agricultural Eng<strong>in</strong>eer<strong>in</strong>g,<br />
†Department <strong>of</strong> Animal Science and<br />
‡School <strong>of</strong> Veter<strong>in</strong>ary Medic<strong>in</strong>e,<br />
University <strong>of</strong> Cali<strong>for</strong>nia at Davis, 95616<br />
without a correspond<strong>in</strong>g <strong>in</strong>crease <strong>in</strong> milk prote<strong>in</strong>; values<br />
<strong>of</strong> urea and true prote<strong>in</strong> <strong>in</strong> milk may be used to<br />
assess the nutritional program <strong>of</strong> lactat<strong>in</strong>g dairy cows<br />
(6). Various authors (4, 14) report the onset <strong>of</strong> pathologic<br />
problems when milk urea N (MUN) reaches about<br />
20 mg/dl.<br />
Because urea concentrations <strong>in</strong> blood and ur<strong>in</strong>e are<br />
important <strong>in</strong>dicators <strong>of</strong> renal health, many biosensors<br />
specific to urea have been developed <strong>in</strong> the biomedical<br />
<strong>in</strong>dustry. These sensors hydrolyze urea with the enzyme<br />
urease (EC # 3.5.1.5),<br />
and measure changes <strong>in</strong> solution conductivity (5, 20),<br />
pH (11, 12), or the ionic products with ion-selective<br />
electrodes, ion-sensitive field effect transistors (10, 17),<br />
or surface acoustic wave devices (15). Most <strong>of</strong> these<br />
sensors are too delicate <strong>for</strong> use with raw milk without<br />
extensive pretreatment (5, 10, 11, 15, 17, 20). Some are<br />
highly nonl<strong>in</strong>ear or have a low dynamic range (10, 11,<br />
15, 17, 20), and some are not precise enough to measure<br />
urea N to with<strong>in</strong> 1 mg/dl (10, 12, 20). All <strong>of</strong> these biosensors<br />
depend on sample pH and buffer<strong>in</strong>g capacity.<br />
The goal <strong>of</strong> this research was to develop a biosensor<br />
to automatically measure MUN dur<strong>in</strong>g milk<strong>in</strong>g. Data<br />
from such a device could be used to manage the N<br />
balance <strong>of</strong> a herd <strong>for</strong> economic and environmental benefit.<br />
The sensor had to be able to complete one measurement<br />
cycle faster than the turnaround time <strong>for</strong> cows <strong>in</strong><br />
the parlor (less than 10 m<strong>in</strong>) and had to be capable <strong>of</strong><br />
repeatedly measur<strong>in</strong>g MUN to with<strong>in</strong> 1 mg/dl (0.3 mM)<br />
<strong>in</strong> the physiological range from about 6 to 24 mg/dl (2.1<br />
to 8.6 mM). The biosensor also had to be simple, reliable,<br />
and robust enough to withstand repeated exposure to<br />
the high lipid and prote<strong>in</strong> concentrations <strong>in</strong> milk. In<br />
this paper we report on a new assay <strong>for</strong> urea that is<br />
simple, robust, and effective <strong>for</strong> measurement <strong>in</strong> milk.
2000<br />
<strong>Assay</strong> Development<br />
MATERIALS AND METHODS<br />
Device pr<strong>in</strong>ciple and theoretical sensitivity. The<br />
new assay <strong>in</strong>volves the measurement <strong>of</strong> partial pressure<br />
<strong>of</strong> carbon dioxide <strong>in</strong> the sample. Under acidic conditions,<br />
the carbonate generated from the hydrolysis <strong>of</strong><br />
urea exists primarily as dissolved CO2. A sealed gaseous<br />
cavity <strong>in</strong> contact with the solution will pressurize to an<br />
extent proportional to the amount <strong>of</strong> urea orig<strong>in</strong>ally<br />
<strong>in</strong> the sample as dissolved CO 2 is released <strong>in</strong>to the<br />
gaseous phase.<br />
The partial pressure, P, <strong>of</strong> a dissolved gas is given<br />
by Henry’s law,<br />
P = xgk p, [1]<br />
where k p is Henry’s constant and x g is the mole fraction,<br />
or the ratio <strong>of</strong> the dissolved gas molecules <strong>in</strong> solution<br />
to the sum <strong>of</strong> all molecules <strong>in</strong> the solution. When xg is<br />
small, the partial pressure <strong>of</strong> CO 2 can be approximated<br />
as<br />
P CO2 = [CO2] (aq)<br />
[H2O] k p. [2]<br />
An empirical expression <strong>for</strong> the solubility <strong>of</strong> CO 2 <strong>in</strong><br />
water (7, p. 242) may be used to derive<br />
k p = E(e A+ B/T + DT T C ) −1 , [3]<br />
where A =−159.854, B = 8741.68 K, C = 21.6694, D =<br />
−1.10261 × 10 −3 K −1 , and E = 101.325 kPa. With these<br />
values, the partial pressure <strong>of</strong> CO2 generated by hydrolysis<br />
<strong>of</strong> urea <strong>in</strong> water is 1.03 kPa per mg/dl <strong>of</strong> urea N<br />
at 24°C.<br />
In a closed system with no <strong>in</strong>itial gaseous CO2, the<br />
f<strong>in</strong>al value <strong>of</strong> the partial pressure <strong>in</strong> the enclosed cell<br />
must be adjusted <strong>for</strong> mass load<strong>in</strong>g because CO 2 is depleted<br />
<strong>in</strong> the aqueous phase. If α is the ratio <strong>of</strong> partial<br />
pressure with mass load<strong>in</strong>g to the partial pressure with<br />
no mass load<strong>in</strong>g, then α can also be def<strong>in</strong>ed as the ratio<br />
<strong>of</strong> CO 2 <strong>in</strong> solution at equilibrium to the total CO 2 <strong>in</strong><br />
the system,<br />
[CO<br />
α =<br />
2] aqVf , [4]<br />
[CO2]aqVf + CO2(g)<br />
where Vf is the volume <strong>of</strong> liquid <strong>in</strong> the system and CO2(g)<br />
is the mole count <strong>of</strong> gaseous CO2. We can solve <strong>for</strong> CO2(g)<br />
<strong>in</strong> terms <strong>of</strong> [CO 2] aq by relat<strong>in</strong>g the partial pressure described<br />
by the ideal gas law to that described by equation<br />
[2],<br />
Journal <strong>of</strong> Dairy Science Vol. 82, No. 9, 1999<br />
JENKINS ET AL.<br />
CO 2(g) =<br />
V gk p<br />
R T[H2O] [CO 2] aq, [5]<br />
where Vg is the gaseous volume <strong>of</strong> the system, R is the<br />
universal gas constant, and T is absolute temperature.<br />
Substitut<strong>in</strong>g equation [5] <strong>in</strong>to equation [4] yields<br />
α = ( 1 +<br />
kp Vg R T[H2O] Vf) −1<br />
. [6]<br />
We can predict the sensitivity <strong>of</strong> the device to urea by<br />
us<strong>in</strong>g the def<strong>in</strong>ition <strong>of</strong> α and the fact that 1 mol <strong>of</strong> urea<br />
is hydrolyzed to 1 mol <strong>of</strong> carbonate:<br />
kp RTVf Ptheory = (<br />
[urea]. [7]<br />
kp Vg + R T[H2O]Vf) Influence <strong>of</strong> physical and chemical conditions.<br />
To operate the sensor with<strong>in</strong> the given time constra<strong>in</strong>ts,<br />
the equilibrium between various carbonate ions and<br />
CO2 must be considered:<br />
The ratio <strong>of</strong> dissolved CO 2 to carbonate is dependent<br />
on pH. If the solution is alkal<strong>in</strong>e, the carbonate <strong>in</strong> the<br />
system is effectively ionized <strong>in</strong> solution. There<strong>for</strong>e, the<br />
system must be acidified <strong>in</strong> order to generate a pressure<br />
signal <strong>in</strong> real time. Based on weak acid chemistry, lower<strong>in</strong>g<br />
the pH to 4.1 drives 99% <strong>of</strong> the carbonate to dissolved<br />
CO 2.<br />
A number <strong>of</strong> different parameters have a strong effect<br />
on the system and must be corrected or controlled <strong>for</strong>.<br />
Perhaps the most important <strong>of</strong> these is temperature.<br />
The solubility constant is highly temperature dependent;<br />
kp <strong>in</strong>creases with temperature, caus<strong>in</strong>g the ideal<br />
sensitivity (equation [2]) and the load<strong>in</strong>g correction factor<br />
(equation [6]) to change. Partial temperature compensation<br />
may be achieved by prudent design <strong>of</strong> the<br />
ratio <strong>of</strong> liquid to gaseous volumes <strong>in</strong> the cell (decreas<strong>in</strong>g<br />
α <strong>of</strong>fsets an <strong>in</strong>crease <strong>in</strong> k p), thereby reduc<strong>in</strong>g the scale<br />
<strong>of</strong> errors possible from s<strong>of</strong>tware compensation.<br />
Temperature also has a strong <strong>in</strong>fluence on water<br />
vapor pressure, which may be compensated <strong>for</strong> by<br />
blank<strong>in</strong>g the hydrolyzed sample aga<strong>in</strong>st the untreated<br />
sample. This practice also corrects <strong>for</strong> the effects <strong>of</strong><br />
background dissolved gases, ambient CO 2, and humidity<br />
levels.<br />
The premature loss <strong>of</strong> CO 2 from the solution <strong>in</strong>to the<br />
atmosphere or <strong>in</strong>to the cell be<strong>for</strong>e it is sealed represents<br />
a significant source <strong>of</strong> sensitivity loss and possible error.<br />
Consequently, the acidified sample must be handled
eproducibly and sealed <strong>in</strong> the cell as quickly as<br />
possible.<br />
Another possible source <strong>of</strong> error is the variation <strong>in</strong><br />
CO 2 solubility that is caused by other components <strong>in</strong><br />
solution. <strong>Milk</strong> is comprised ma<strong>in</strong>ly <strong>of</strong> water (87.2%),<br />
lactose (4.7%), milk fat (4%), and prote<strong>in</strong> (3.4%). Dissolved<br />
solids such as lactose decrease the solubility <strong>of</strong><br />
CO2. There<strong>for</strong>e, the presence <strong>of</strong> lactose should make<br />
the new assay more sensitive to the presence <strong>of</strong> urea<br />
<strong>in</strong> milk. Likewise colloidal prote<strong>in</strong>s <strong>in</strong> solution should<br />
<strong>in</strong>crease the sensitivity <strong>of</strong> the assay by displac<strong>in</strong>g water.<br />
The presence <strong>of</strong> fat <strong>in</strong> milk would be expected to lower<br />
the sensitivity <strong>of</strong> the assay because CO2 is reported to<br />
be about twice as soluble <strong>in</strong> butterfat as <strong>in</strong> water (derived<br />
from 8, p. 367). The effect <strong>of</strong> each <strong>of</strong> these components<br />
was determ<strong>in</strong>ed experimentally.<br />
<strong>Assay</strong> Protocols and Sample Preparations<br />
A manual assay <strong>of</strong> the type described above was carried<br />
out <strong>in</strong> a 3.8-ml volume section <strong>of</strong> plastic tub<strong>in</strong>g<br />
attached to the positive port <strong>of</strong> a 50-kPa pressure transducer<br />
(Motorola MPX 2050D, Phoenix, AZ). Standards<br />
were prepared by dissolv<strong>in</strong>g urea or the stoichiometrically<br />
equivalent amount <strong>of</strong> Na2CO3 <strong>in</strong> PBS (0.1 M phosphate,<br />
0.15 M NaCl, pH 7.0) or distilled water. We<br />
hydrolyzed the urea by add<strong>in</strong>g 1 mg <strong>of</strong> lyophilized urease<br />
(EC # 3.5.1.5, Sigma Aldrich <strong>Chemical</strong> Corporation,<br />
St. Louis, MO) to each 10 ml <strong>of</strong> standard and <strong>in</strong>cubat<strong>in</strong>g<br />
the samples at room temperature <strong>for</strong> 5 m<strong>in</strong>. For the<br />
standard assay, a volume <strong>of</strong> 2.0 ml <strong>of</strong> the sample was<br />
added <strong>in</strong>to the tub<strong>in</strong>g, followed by 0.4 ml <strong>of</strong> 1.0 M citric<br />
acid to br<strong>in</strong>g the pH below 4.0. The tub<strong>in</strong>g was then<br />
sealed and shaken by a small DC motor. The signal from<br />
the transducer was recorded after 1 m<strong>in</strong> <strong>of</strong> shak<strong>in</strong>g.<br />
We tested the effects <strong>of</strong> milk fat, case<strong>in</strong>, and lactose<br />
by assay<strong>in</strong>g standards <strong>of</strong> equal urea N concentrations<br />
(30 mg/dl) and tak<strong>in</strong>g the regression aga<strong>in</strong>st vary<strong>in</strong>g<br />
component concentrations. Stock solutions <strong>of</strong> the different<br />
components were prepared <strong>in</strong> PBS by addition <strong>of</strong><br />
α-lactose (# L5-500, Fisher Scientific, Pittsburgh, PA),<br />
commercial heavy cream (assumed 40% milk fat), or<br />
case<strong>in</strong> (# 7078, Sigma Aldrich <strong>Chemical</strong>). <strong>Urea</strong> was<br />
added to the stock solutions to give 30 mg/dl <strong>of</strong> urea N.<br />
Samples were prepared by blend<strong>in</strong>g the stock solutions<br />
with solutions <strong>of</strong> 30 mg/dl <strong>of</strong> urea N <strong>in</strong> PBS. These<br />
samples were assayed by the method prescribed above.<br />
We also tested the sensitivity <strong>of</strong> the assay <strong>in</strong> eight<br />
milk samples and compared it to the sensitivity <strong>for</strong><br />
standards <strong>in</strong> water and PBS. Each milk sample was<br />
divided <strong>in</strong>to two 10-ml volumes. One 10-ml volume from<br />
each sample was spiked with 100 µl <strong>of</strong> a stock solution<br />
<strong>of</strong> 3.03 g/dl <strong>of</strong> urea N <strong>in</strong> water. The other 10-ml volume<br />
from each sample was adulterated with 100 µl <strong>of</strong> water.<br />
MILK UREA ASSAY 2001<br />
These separate volumes were assayed as described<br />
above and the assay sensitivity <strong>in</strong> each milk sample<br />
was estimated based on the difference <strong>in</strong> observed pressure<br />
<strong>for</strong> the spiked and adulterated solutions. We then<br />
assayed 30 mg/dl <strong>of</strong> urea N solutions <strong>in</strong> PBS and distilled<br />
water, as well as the stoichiometrically equivalent<br />
amount <strong>of</strong> Na2CO3 <strong>in</strong> PBS and distilled water. Three<br />
replications were assayed <strong>for</strong> the sensitivities <strong>in</strong> each<br />
standard and sample <strong>in</strong> order to per<strong>for</strong>m s<strong>in</strong>gle-factor<br />
analysis <strong>of</strong> variance (ANOVA) and Fisher’s least significant<br />
difference (LSD) tests.<br />
RESULTS AND DISCUSSION<br />
The time response <strong>of</strong> an automated version <strong>of</strong> the<br />
assay is shown <strong>in</strong> Figure 1. The response can be approximated<br />
as first order with a time constant <strong>of</strong> about 3 s,<br />
reach<strong>in</strong>g effective equilibrium with<strong>in</strong> 20 s. The background<br />
pressure developed <strong>in</strong> the untreated sample is<br />
not negligible and must be used as a blank when samples<br />
have unknown amounts <strong>of</strong> dissolved gas or when<br />
ambient conditions are not carefully controlled.<br />
A comparison <strong>of</strong> the standard curve <strong>for</strong> hydrolyzed<br />
urea <strong>in</strong> PBS with the pressure predicted by equation<br />
[7] is shown <strong>in</strong> Figure 2. The assay is l<strong>in</strong>ear over the<br />
range <strong>of</strong> <strong>in</strong>terest with a standard error <strong>of</strong> 0.3 mg/dl.<br />
The predicted sensitivity is almost 37% higher than<br />
that observed, even account<strong>in</strong>g <strong>for</strong> dilution <strong>of</strong> the standard<br />
with acid and mass load<strong>in</strong>g <strong>in</strong> the cell. Relat<strong>in</strong>g<br />
the observed sensitivity to the expression <strong>for</strong> sensitivity<br />
<strong>in</strong> equation [7], we f<strong>in</strong>d that the observed value <strong>for</strong> the<br />
constant k p is 96,700 kPa, compared to 161,000 kPa<br />
calculated from equation [3]. The reasons <strong>for</strong> this differ-<br />
Figure 1. Pressure recorded versus time dur<strong>in</strong>g shak<strong>in</strong>g <strong>of</strong> an<br />
automated version <strong>of</strong> the new assay: enzymatically hydrolyzed sample<br />
[; —; Y= 6.46 (1 − e −X/2.9 ); r 2 = 0.99], untreated sample ().<br />
Journal <strong>of</strong> Dairy Science Vol. 82, No. 9, 1999
2002<br />
Figure 2. Standard curve <strong>of</strong> pressure aga<strong>in</strong>st urea N <strong>in</strong> PBS at<br />
24°C: predicted by equation [7] us<strong>in</strong>g k p value from equation 3 (—;<br />
k p = 161,000 kPa; Y = 0.501 X), observed [; –––;k p = 96,700 kPa;<br />
Y = 0.367 X (r 2 = 0.999, SE = 0.3 mg/dl)].<br />
ence may <strong>in</strong>clude premature volatilization <strong>of</strong> CO 2, deviation<br />
from ideal gas behavior, and a true difference <strong>of</strong><br />
CO 2 solubility from that described by equation [3]. The<br />
last explanation is quite plausible given observations<br />
that CO 2 solubility is <strong>in</strong>versely related to pH (13, p. 82).<br />
We can verify the effect <strong>of</strong> mass load<strong>in</strong>g <strong>in</strong> the system<br />
by show<strong>in</strong>g the sensitivity <strong>of</strong> the sensor <strong>for</strong> vary<strong>in</strong>g<br />
values <strong>of</strong> fluid volume loaded <strong>in</strong>to the cell. Standards<br />
<strong>of</strong> Na 2CO 3 <strong>in</strong> PBS equivalent to 30 mg/dl <strong>of</strong> urea N<br />
were acidified with 1 part 1 M citric acid per 5 parts<br />
<strong>of</strong> standard. Various volumes <strong>of</strong> these mixtures were<br />
assayed <strong>in</strong> the cell to determ<strong>in</strong>e the dependence <strong>of</strong> pressure<br />
on the ratio <strong>of</strong> liquid to gas volume. The observed<br />
data (Figure 3) correlate well with equation [7] if the<br />
value <strong>of</strong> k p used <strong>in</strong> the equation is the same as the value<br />
fit <strong>in</strong> the standard curve (96,700 kPa). Although there<br />
is a discrepancy between the observed k p value and<br />
that reported <strong>for</strong> pure water, the observed value is still<br />
effectively constant <strong>for</strong> a given temperature. Consequently,<br />
the system is l<strong>in</strong>ear and the sensor may be<br />
easily calibrated <strong>for</strong> dissolved CO 2 levels <strong>in</strong> milk.<br />
The stability <strong>of</strong> the carbonate ion is <strong>of</strong> great importance<br />
to the handl<strong>in</strong>g <strong>of</strong> samples. Stor<strong>in</strong>g hydrolyzed<br />
samples too long at too low a pH leads to a loss <strong>of</strong><br />
carbonate from solution, particularly if the samples are<br />
agitated or heated. Figure 4 shows the pr<strong>of</strong>iles <strong>of</strong> carbonate<br />
rema<strong>in</strong><strong>in</strong>g <strong>in</strong> solution aga<strong>in</strong>st pH <strong>for</strong> samples<br />
stored at 24°C <strong>for</strong> 1 and 16 h. The pH dependence <strong>of</strong><br />
dissolved CO 2 is also shown; the rate <strong>of</strong> carbonate loss is<br />
clearly related to dissolved CO 2. At neutral and alkal<strong>in</strong>e<br />
pH, the loss <strong>of</strong> carbonate after 1 h is <strong>in</strong>significant. Samples<br />
below this pH should be adjusted to higher pH<br />
Journal <strong>of</strong> Dairy Science Vol. 82, No. 9, 1999<br />
JENKINS ET AL.<br />
Figure 3. Pressure recorded <strong>in</strong> sensor <strong>for</strong> 30 mg/dl urea N standard<br />
versus ratio <strong>of</strong> liquid to gas volume <strong>in</strong> the reaction cell at 24°C:<br />
predicted by equation [7] us<strong>in</strong>g k p value from equation [3] (—), observed<br />
(), predicted by equation 7 us<strong>in</strong>g k p = 96,700 kPa (– ––).<br />
be<strong>for</strong>e hydrolysis and, <strong>in</strong> any case, hydrolyzed samples<br />
should be assayed with<strong>in</strong> 30 m<strong>in</strong> to prevent losses.<br />
Given that most milk samples range <strong>in</strong> pH from 6.5 to<br />
6.7 (21, p. 404), no significant losses <strong>in</strong> signal should<br />
occur if samples are assayed immediately after hydrolysis.<br />
A comparison <strong>of</strong> MUN values measured by the new<br />
method with those assayed by an autoanalyzer (Technicon<br />
Corporation Series 2 Autoanalyzer, Tarrytown,<br />
NY) demonstrates reasonable agreement between the<br />
Figure 4. Time and pH dependence <strong>of</strong> normalized carbonate <strong>in</strong><br />
solution: ratio <strong>of</strong> dissolved CO 2 to total dissolved carbonate species<br />
(—), normalized total amount <strong>of</strong> carbonate rema<strong>in</strong><strong>in</strong>g <strong>in</strong> solution after<br />
1h(; –––), normalized total amount <strong>of</strong> carbonate rema<strong>in</strong><strong>in</strong>g <strong>in</strong><br />
solution after 16 h (; –––).
Figure 5. Comparison <strong>of</strong> milk urea N (MUN) values recorded by<br />
CO 2 partial pressure method with those recorded by autoanalyzer<br />
us<strong>in</strong>g reaction <strong>of</strong> urea with diacetyl monoxime [Y = 0.942 X − 1.66<br />
(r 2 = 0.964)].<br />
new assay and established methods. The comparison<br />
is shown <strong>in</strong> Figure 5. The milk used <strong>for</strong> these tests was<br />
preserved with bronopol and natamyc<strong>in</strong> (Broad Spectrum<br />
Microtabs II, D&F Control Systems, San Ramon,<br />
CA). Because the true concentrations <strong>of</strong> urea <strong>in</strong> the<br />
milk samples are unknown, it is unclear which technique<br />
more accurately estimates MUN. The auto-analyzer<br />
screens molecules through a dialysis membrane<br />
and photometrically assays <strong>for</strong> a p<strong>in</strong>k complex result<strong>in</strong>g<br />
from the reaction <strong>of</strong> urea with diacetyl mon-oxime (16,<br />
19). Although this reaction is reported to give falsely<br />
high read<strong>in</strong>gs because <strong>of</strong> reactions with peptides, other<br />
molecules with amide bonds, substituted ureas, and<br />
some am<strong>in</strong>o acids (2), we have seen that the dialyzer<br />
effectively elim<strong>in</strong>ates any <strong>in</strong>terferences <strong>in</strong> milk. Work<br />
is cont<strong>in</strong>u<strong>in</strong>g to determ<strong>in</strong>e and better quantify the cause<br />
<strong>of</strong> the discrepancies between the two measurement systems.<br />
Prelim<strong>in</strong>ary data suggest that the negative <strong>in</strong>tercept<br />
evident <strong>in</strong> Figure 5 occurs when the preservative<br />
is used, whereas no <strong>of</strong>fset occurs when the milk is fresh<br />
MILK UREA ASSAY 2003<br />
and unadulterated. In light <strong>of</strong> this, on-l<strong>in</strong>e measurements<br />
us<strong>in</strong>g the new sensor may be an accurate reflection<br />
<strong>of</strong> MUN as measured us<strong>in</strong>g exist<strong>in</strong>g methods.<br />
A summary <strong>of</strong> the regression data <strong>of</strong> pressure observed<br />
<strong>in</strong> 30 mg/dl <strong>of</strong> urea N samples aga<strong>in</strong>st different<br />
milk component concentrations shows that the assay<br />
has little <strong>in</strong>terference from the major components <strong>of</strong><br />
milk (Table 1). The effect <strong>of</strong> lactose is significant at the<br />
5% level. The effect, however, is slight—only a 0.6%<br />
change <strong>in</strong> assay sensitivity per change <strong>in</strong> percentage<br />
<strong>of</strong> lactose, represent<strong>in</strong>g an error <strong>of</strong> 0.2 mg/dl <strong>in</strong> a sample<br />
conta<strong>in</strong><strong>in</strong>g 30 mg/dl <strong>of</strong> urea N. The regression statistics<br />
<strong>for</strong> case<strong>in</strong> show an effect opposite to what we expected.<br />
The observed sensitivity actually decreases with an <strong>in</strong>creas<strong>in</strong>g<br />
concentration <strong>of</strong> case<strong>in</strong>. We speculate that the<br />
acid precipitate <strong>of</strong> case<strong>in</strong> <strong>in</strong>hibit<strong>in</strong>g the diffusion <strong>of</strong> CO 2<br />
<strong>in</strong>to the gaseous phase causes this decl<strong>in</strong>e. Still, the<br />
observed effect is small, show<strong>in</strong>g a −1.7% change <strong>in</strong><br />
sensitivity per change <strong>in</strong> the concentration <strong>of</strong> case<strong>in</strong>.<br />
The regression statistics <strong>for</strong> milk fat show no significant<br />
effect <strong>of</strong> fat (p-value 0.8619). This result is surpris<strong>in</strong>g<br />
given the reported difference <strong>in</strong> CO 2 solubility <strong>in</strong> fat<br />
and water and suggests that the solubility <strong>of</strong> CO2 <strong>in</strong><br />
the solutions tested is probably higher than that described<br />
by equation [3].<br />
Comparisons <strong>of</strong> mean sensitivities <strong>for</strong> the eight<br />
spiked milk samples and urea and stoichiometrically<br />
equivalent solutions <strong>of</strong> Na2CO3 <strong>in</strong> PBS and distilled<br />
water are shown <strong>in</strong> Table 2. No differences <strong>in</strong> sensitivity<br />
were detected by s<strong>in</strong>gle-factor ANOVA at the 5% level<br />
(P = 0.4453). With the LSD test, only one milk sample<br />
was found to have a sensitivity different than the standard<br />
solutions at the 5% level. These tests <strong>in</strong>dicate<br />
that the assay should be quite reliable <strong>in</strong> milk, and no<br />
correction need be made <strong>for</strong> calibrations us<strong>in</strong>g standard<br />
solutions <strong>in</strong> PBS or distilled water.<br />
CONCLUSIONS<br />
We have shown that the new assay <strong>for</strong> milk urea is<br />
simple and robust. At 24°C, the sensitivity <strong>of</strong> the assay<br />
is 0.367 kPa per mg/dl <strong>of</strong> urea N. The standard error<br />
TABLE 1. Summary <strong>of</strong> regression statistics: assay sensitivity to major milk components.<br />
Range Basel<strong>in</strong>e Regression<br />
tested Temp. pressure slope SE 1 % Error/<br />
Component (%) (°C) (kPa) (kPa/%) (kPa) % ∆ component 2<br />
Lactose 0–10 24.8 9.37* 0.05* 0.224 0.6%*<br />
Case<strong>in</strong> 0–5 23.9 9.20* −0.16* 0.245 −1.7%*<br />
Fat 0–5 24.2 9.27* 0.007 0.261 0.07%<br />
1Standard error <strong>of</strong> observations about regression.<br />
2Change <strong>in</strong> sensitivity per change <strong>in</strong> percent component. Calculated as ratio <strong>of</strong> regression slope to regression<br />
<strong>in</strong>tercept (basel<strong>in</strong>e pressure).<br />
*Significant at the 5% level.<br />
Journal <strong>of</strong> Dairy Science Vol. 82, No. 9, 1999
2004<br />
TABLE 2. Comparisons <strong>of</strong> mean assay sensitivities <strong>in</strong> milk, PBS,<br />
and distilled water.<br />
Sample tested Sensitivity 1<br />
<strong>Urea</strong> <strong>in</strong> PBS 0.315 a<br />
0.005<br />
<strong>Milk</strong> sample 7 0.318a 0.011<br />
<strong>Milk</strong> sample 8 0.319a 0.005<br />
Na2CO3 <strong>in</strong> PBS 0.320 a<br />
Na2CO3 <strong>in</strong> water 0.320<br />
0.001<br />
a <strong>Urea</strong> <strong>in</strong> water 0.320<br />
0.001<br />
a<br />
0.001<br />
<strong>Milk</strong> sample 2 0.324 ab<br />
0.007<br />
<strong>Milk</strong> sample 1 0.325 ab<br />
0.008<br />
<strong>Milk</strong> sample 3 0.326 ab<br />
0.009<br />
<strong>Milk</strong> sample 6 0.327 ab<br />
0.007<br />
<strong>Milk</strong> sample 4 0.333 ab<br />
0.010<br />
<strong>Milk</strong> sample 5 0.343b 0.012<br />
Standard Error 1<br />
a,b<br />
Values with the same letter are not significantly different at the<br />
5% level.<br />
1<br />
Units <strong>of</strong> kilopascals per equivalent milligram per deciliter <strong>of</strong> urea<br />
N.<br />
<strong>for</strong> buffered standards is 0.3 mg/dl <strong>in</strong> the range from 0<br />
to 30 mg/dl. Because <strong>of</strong> the <strong>for</strong>mat <strong>of</strong> the assay, there are<br />
no effects <strong>of</strong> sample pH and buffer<strong>in</strong>g capacity except <strong>in</strong><br />
terms <strong>of</strong> carbonate loss after urea hydrolysis. This effect<br />
should not be a problem under the short cycl<strong>in</strong>g times<br />
<strong>of</strong> an automated sensor. We estimate that the standard<br />
errors <strong>in</strong> milk would be with<strong>in</strong> 1 mg/dl based on observed<br />
<strong>in</strong>terferences by milk solids and comparison <strong>of</strong><br />
the assay results <strong>in</strong> milk with traditional chemical<br />
methods. The presence <strong>of</strong> milk fat had no significant<br />
effect on the sensitivity <strong>of</strong> the assay, and the effects <strong>of</strong><br />
milk prote<strong>in</strong>s and lactose were slight (−1.7 and 0.6%<br />
change <strong>in</strong> sensitivity per change <strong>in</strong> w/v percent, respectively).<br />
No significant differences were detected <strong>in</strong> assay<br />
sensitivity <strong>in</strong> standards <strong>in</strong> water, buffer and milk. The<br />
assay may be adapted <strong>for</strong> use as a robust and reproducible<br />
on-l<strong>in</strong>e MUN sensor <strong>in</strong> the milk<strong>in</strong>g parlor. <strong>Automated</strong><br />
versions <strong>of</strong> the assay have been built and tested<br />
successfully <strong>in</strong> the laboratory, and work to improve the<br />
fluid handl<strong>in</strong>g and the efficiency <strong>of</strong> the enzymatic hydrolysis<br />
step cont<strong>in</strong>ues. Future work will <strong>in</strong>clude test<strong>in</strong>g<br />
different configurations <strong>of</strong> the biosensor and eng<strong>in</strong>eer<strong>in</strong>g<br />
temperature compensation <strong>in</strong>to the system.<br />
ACKNOWLEDGMENT<br />
This research was partially supported by USDA/<br />
BARD research project US-2638-95.<br />
Journal <strong>of</strong> Dairy Science Vol. 82, No. 9, 1999<br />
JENKINS ET AL.<br />
REFERENCES<br />
1 Baker, L. D., J. D. Ferguson, and W. Chalupa. 1995. Responses<br />
<strong>in</strong> urea and true prote<strong>in</strong> <strong>of</strong> milk to different feed<strong>in</strong>g schemes <strong>for</strong><br />
dairy cows. J. Dairy Sci. 78:2424–2434.<br />
2 Boyde, T.R.C., and M. Rahmatullah. 1980. Optimization <strong>of</strong> conditions<br />
<strong>for</strong> the colorimetric determ<strong>in</strong>ation <strong>of</strong> citrull<strong>in</strong>e, us<strong>in</strong>g diacetyl<br />
monoxime. Anal. Biochem. 107:424–431.<br />
3 Broderick, G. A., and M. K. Clayton. 1997. A statistical evaluation<br />
<strong>of</strong> animal and nutritional factors <strong>in</strong>fluenc<strong>in</strong>g concentrations <strong>of</strong><br />
milk urea nitrogen. J. Dairy Sci. 80:2964–2971.<br />
4 Butler, W. R., J. J. Calaman, and S. W. Beam. 1996. Plasma and<br />
milk urea nitrogen <strong>in</strong> relation to pregnancy rate <strong>in</strong> lactat<strong>in</strong>g dairy<br />
cows. J. Anim. Sci. 74:858–865.<br />
5 Ciana, L. D., and G. Caputo. 1996. Robust, reliable biosensor<br />
<strong>for</strong> cont<strong>in</strong>uous monitor<strong>in</strong>g <strong>of</strong> urea dur<strong>in</strong>g dialysis. Cl<strong>in</strong>. Chem.<br />
42:1079–1085.<br />
6 DePeters, E. J., and J. D. Ferguson. 1992. Non-prote<strong>in</strong> nitrogen<br />
and prote<strong>in</strong> distribution <strong>in</strong> the milk <strong>of</strong> cows. J. Dairy Sci. 75:3192–<br />
3209.<br />
7 Fogg, P.G.T., and W. Gerrard. 1991. Solubility <strong>of</strong> Gases <strong>in</strong> Liquids.<br />
John Wiley & Sons, New York, NY.<br />
8 Gerrard, W. 1980. Gas Solubilities, Widespread Applications. Pergamon<br />
Press, Ox<strong>for</strong>d, United K<strong>in</strong>gdom.<br />
9 H<strong>of</strong>, G., M. D. Vervoorn, P. J. Lenaers, and S. Tamm<strong>in</strong>ga. 1997.<br />
<strong>Milk</strong> urea nitrogen as a tool to monitor the prote<strong>in</strong> nutrition <strong>of</strong><br />
dairy cows. J. Dairy Sci. 80:3333–3340.<br />
10 Kazanskaya, N., A. Kukht<strong>in</strong>, and M. Manenkova. 1996. FETbased<br />
sensors with robust photosensitive polymer membranes <strong>for</strong><br />
detection <strong>of</strong> ammonium ions and urea. Biosens/Bioelect. 11:253–<br />
261.<br />
11 Koncki, R., G. Mohr, and O. Wolfbeis. 1995. Enzyme biosensor<br />
<strong>for</strong> urea based on a novel pH bulk optode membrane. Biosens/<br />
Bioelect. 10:653–659.<br />
12 Kriz, D., and A. Johansson. 1996. A prelim<strong>in</strong>ary study <strong>of</strong> a biosensor<br />
based on flow <strong>in</strong>jection <strong>of</strong> the recognition element. Biosens/<br />
Bioelect. 11:1259–1265.<br />
13 Lane, E. E., and J. F. Walker. 1987. Cl<strong>in</strong>ical Arterial Blood Gas<br />
Analysis. The C. V. Mosby Co., St. Louis, MO.<br />
14 Larson, S. F., W. R. Butler, and W. B. Currie. 1997. Reduced<br />
fertility associated with low progesterone postbreed<strong>in</strong>g and <strong>in</strong>creased<br />
milk urea nitrogen <strong>in</strong> lactat<strong>in</strong>g dairy cows. J. Dairy Sci.<br />
80:1288–1295.<br />
15 Liu, D., K. Ge, K. Chen, L. Nie, and S. Yao. 1996. Sensitive<br />
specialization analysis <strong>of</strong> urea <strong>in</strong> human blood by surface acoustic<br />
wave urea sensor system. Microchemical J. 53:6–17.<br />
16 Marsh, W. H., B. F<strong>in</strong>gerhut, and E. Kirsch. 1957. Determ<strong>in</strong>ation<br />
<strong>of</strong> urea nitrogen with the diacetyl method and an automated<br />
dialyz<strong>in</strong>g apparatus. Am. J. Cl<strong>in</strong>. Pathol. 28:681–688.<br />
17 Mizutani, F., S. Yabuki, and Y. Sato. 1997. Voltammetric enzyme<br />
sensor <strong>for</strong> urea us<strong>in</strong>g mercaptohydroqu<strong>in</strong>one-modified gold electrode<br />
as the base transducer. Biosens/Bioelect. 12:321–328.<br />
18 Schepers, A. J., and R.G.M. Meijer. 1998. Evaluation <strong>of</strong> the utilization<br />
<strong>of</strong> dietary nitrogen by dairy cows based on urea concentration<br />
<strong>in</strong> milk. J. Dairy Sci. 81:579–584.<br />
19 Skeggs, L. T. 1957. An automated method <strong>for</strong> colorimetric analysis.<br />
Am. J. Cl<strong>in</strong>. Pathol. 28:311–322.<br />
20 Ste<strong>in</strong>schaden, A., D. Adamovic, G. Jobst, R. Glatz, and G. Urban.<br />
1997. M<strong>in</strong>iaturized th<strong>in</strong> film conductimetric biosensors with high<br />
dynamic range and high sensitivity. Sensors/Actuators (B).<br />
44:365–389.<br />
21 Webb, B. H., A. H. Johnson, and J. A. Al<strong>for</strong>d, ed. 1974. Fundamentals<br />
<strong>of</strong> Dairy Chemistry. The Avi Publish<strong>in</strong>g Company, Inc., Westchester,<br />
CT.


