Lamna nasus - Cites
Lamna nasus - Cites
Lamna nasus - Cites

You also want an ePaper? Increase the reach of your titles
YUMPU automatically turns print PDFs into web optimized ePapers that Google loves.
Annexes to Draft Proposal to list <strong>Lamna</strong> <strong>nasus</strong> in Appendix II - January 2012<br />
Annex 1.<br />
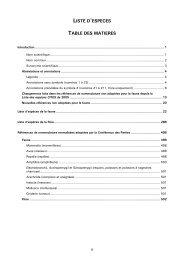
Figures and Tables<br />
Table 1. Indices of percentage decline illustrated in Figure 2 (see proposal p. 5)<br />
Table 2. <strong>Lamna</strong> <strong>nasus</strong> life history parameters<br />
Table 3. Summary of population and catch trend data<br />
Table 4. EU Commodity codes related to trade in <strong>Lamna</strong> <strong>nasus</strong>.<br />
Table 5. EU imports of porbeagle <strong>Lamna</strong> <strong>nasus</strong> products, products (fresh and frozen) by source<br />
countries/territories, value and weight, 2010 and 2011.<br />
Table 6. EU exports of <strong>Lamna</strong> <strong>nasus</strong> products (fresh and frozen) by destination, value and weight,<br />
2010-2011.<br />
Figure 1. Porbeagle <strong>Lamna</strong> <strong>nasus</strong> (see proposal p. 1)<br />
Figure 2. Decline trends for porbeagle <strong>Lamna</strong> <strong>nasus</strong> stocks (see proposal p. 4)<br />
Figure 3. Global <strong>Lamna</strong> <strong>nasus</strong> distribution (Source: FAO FIGIS)<br />
Figure 4. FAO fishing areas<br />
Figure 5. Global reported landings (tonnes) of <strong>Lamna</strong> <strong>nasus</strong> by major FAO fishing areas, 1950–2009.<br />
(Source: FAO FishStat) (Data will be updated at a later stage)<br />
Figure 6. Landings (tonnes) of <strong>Lamna</strong> <strong>nasus</strong> from the Northeast Atlantic by major fishing States, 1950–<br />
2009. (Source: FAO Fishstat) (Data will be updated at a later stage)<br />
Figure 7. Landings (tonnes) of <strong>Lamna</strong> <strong>nasus</strong> from ICES Areas (Northeast Atlantic), 1973–2009.<br />
(Source: ICES Working Group on Elasmobranch Fishes 2010) (Data will be updated at a later<br />
stage)<br />
Figure 8. Landings (tonnes) of <strong>Lamna</strong> <strong>nasus</strong> by Norway in the Northeast Atlantic, 1926–2009. (Source:<br />
Norwegian fisheries data & ICES WGEF) (Data will be updated at a later stage)<br />
Figure 9. Landings (tonnes) of <strong>Lamna</strong> <strong>nasus</strong> by Denmark in the Northeast Atlantic, 1954–2009.<br />
(Source: ICES Working Group on Elasmobranch Fishes) (Data will be updated at a later stage)<br />
Figure 10. Landings (tonnes) of <strong>Lamna</strong> <strong>nasus</strong> by Faroe Islands in the Northeast Atlantic, 1973–2009.<br />
(Source: ICES WGEF and European Commission.) (Data will be updated at a later stage)<br />
Figure 11. French landings (tonnes) of <strong>Lamna</strong> <strong>nasus</strong> in the Northeast Atlantic, 1978–2009. (Source:<br />
ICES Working Group on Elasmobranch Fishes) (Data will be updated at a later stage)<br />
Figure 12. Surplus production age-structured model fits to French longline CPUE indices (assuming<br />
virgin conditions in 1926) for northeast Atlantic porbeagle shark. Source ICCAT SCRS/ICES<br />
2009.<br />
Figure 13. Depletion in total biomass (upper panel) and numbers (lower panel) for a surplus production<br />
age-structured model for Northeast Atlantic porbeagle shark. The dots indicated on the line<br />
correspond to depletion at the beginning of the modern period (1972) and current depletion<br />
(2008).Source ICCAT/ICES 2009.<br />
Figure 14. <strong>Lamna</strong> <strong>nasus</strong> landings in the Northwest Atlantic, 1961–2008 (excluding unreported high seas<br />
captures). (Source: Campana et al. 2010)<br />
Figure 15. Estimated trends in numbers of mature females (top), age-1 recruits (centre) and total<br />
number of <strong>Lamna</strong> <strong>nasus</strong> in Canadian waters, 1960–2010, from four porbeagle population<br />
models (all show similar trajectories). (Source: Campana et al. 2010.)<br />
Figure 16. Comparison of recovery targets and trajectories for the Canadian porbeagle stock during<br />
2009–2100, obtained using Population Viability Analysis from four population models projected<br />
deterministically under four different exploitation rates (0% to 8% per annum). (Source:<br />
Campana et al. 2010.)<br />
Figure 17. New Zealand commercial landings of porbeagle sharks reported by fishers and processors<br />
(LFRR), 1989/90 to 2004/05. (Source Ministry of Fisheries 2008.)<br />
Figure 18. Unstandardised CPUE indices (number of <strong>Lamna</strong> <strong>nasus</strong> per 1000 hooks) for the New<br />
Zealand tuna longline fishery based on observer reports.<br />
Figure 19. Relative spawning stock biomass (SSB) trend for the catch free age structured production<br />
model, assuming virgin conditions in 1961, for southwest Atlantic porbeagle shark.<br />
Figure 20. Southern hemisphere landings of porbeagle <strong>Lamna</strong> <strong>nasus</strong>, 1990–2009 (FISHSTAT).<br />
Annexes p. 1 of 24<br />
AC26 Doc. 26.2, Annex 1 – p. 15<br />
AC26 Doc. 26.2<br />
Annex / Anexo /Annexe<br />
(English only / únicamente en inglés / seulement en anglais)